Opposite of Pandas Melt: Using pivot and pivot_table
In data manipulation with Pandas, the opposite of the melt function is typically achieved through the pivot or pivot_table functions. While melt is used to transform data from a wide format to a long format, pivot and pivot_table are used to transform data from a long format to a wide format. This article will explore how to use these functions with detailed examples.
Introduction to pivot
The pivot function is used to create a new derived table out of a given one. The syntax for pivot is:
DataFrame.pivot(index=None, columns=None, values=None)
index: This is the column to make the new frame’s index. If none is passed, it uses existing row labels.columns: The column to use to make new frame’s columns.values: The column(s) to use for populating new frame’s values. If not specified, all remaining columns will be used.
Example 1: Basic Pivot
import pandas as pd

data = {
    'date': ['2023-01-01', '2023-01-01', '2023-01-02', '2023-01-02'],
    'type': ['A', 'B', 'A', 'B'],
    'value': [10, 20, 30, 40]
}

df = pd.DataFrame(data)
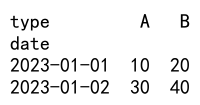
pivot_df = df.pivot(index='date', columns='type', values='value')
print(pivot_df)
Output:

Introduction to pivot_table
pivot_table is a more general form of pivot that can handle duplicate entries for one pivoted index/column pair. It also allows for the use of aggregate functions.
The syntax for pivot_table is:
DataFrame.pivot_table(values=None, index=None, columns=None, aggfunc='mean', fill_value=None, margins=False, dropna=True, margins_name='All')
values: The column to aggregate.index: The keys to group by on the pivot table index.columns: The keys to group by on the pivot table columns.aggfunc: Function to use for aggregation, defaulting to numpy.mean.fill_value: Value to replace missing values with.margins: Add all row / columns (e.g., for subtotal / grand totals).dropna: Do not include columns whose entries are all NaN.margins_name: Name of the row / column that will contain the totals if margins is True.
Example 2: Basic Pivot Table
import pandas as pd

data = {
    'date': ['2023-01-01', '2023-01-01', '2023-01-02', '2023-01-02'],
    'type': ['A', 'B', 'A', 'B'],
    'value': [10, 20, 30, 40]
}

df = pd.DataFrame(data)
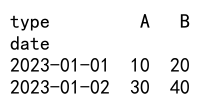
pivot_table_df = df.pivot_table(index='date', columns='type', values='value', aggfunc='sum')
print(pivot_table_df)
Output:

Advanced Usage of pivot_table
Example 3: Using pivot_table with Multiple Aggregations
import pandas as pd
import numpy as np

data = {
    'date': ['2023-01-01', '2023-01-01', '2023-01-02', '2023-01-02'],
    'type': ['A', 'B', 'A', 'B'],
    'value': [10, 20, 30, 40]
}

df = pd.DataFrame(data)
pivot_table_df = df.pivot_table(index='date', columns='type', values='value', aggfunc=[np.sum, np.mean])
print(pivot_table_df)
Example 4: Pivot Table with Margins
import pandas as pd

data = {
    'date': ['2023-01-01', '2023-01-01', '2023-01-02', '2023-01-02'],
    'type': ['A', 'B', 'A', 'B'],
    'value': [10, 20, 30, 40]
}

df = pd.DataFrame(data)
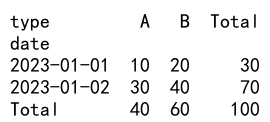
pivot_table_df = df.pivot_table(index='date', columns='type', values='value', aggfunc='sum', margins=True, margins_name='Total')
print(pivot_table_df)
Output:

Example 5: Handling Missing Data in Pivot Tables
import pandas as pd

data = {
    'date': ['2023-01-01', '2023-01-01', '2023-01-02', '2023-01-02'],
    'type': ['A', 'B', 'A', 'B'],
    'value': [10, 20, None, 40]
}

df = pd.DataFrame(data)
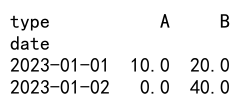
pivot_table_df = df.pivot_table(index='date', columns='type', values='value', aggfunc='sum', fill_value=0)
print(pivot_table_df)
Output:

Opposite of Pandas Melt Conclusion
In this article, we explored how to use the pivot and pivot_table functions in Pandas, which serve as the opposite of the melt function. These functions are essential for reshaping data in Python and can be highly customized with different parameters to handle various data manipulation tasks effectively. By understanding how to use these tools, you can efficiently transform and analyze your data in Python.
 Pandas Dataframe