Pandas Aggregation: Count Distinct
Pandas is a powerful Python library for data manipulation and analysis. It provides numerous functions to perform complex operations with ease. One such operation is aggregation, which is often used in conjunction with counting distinct values in a dataset. This article will explore how to use the agg function in Pandas to count distinct values across different scenarios.
Introduction to Pandas Aggregation
Aggregation in Pandas is a process of transforming a DataFrame into a summary table where each group of the original data is summarized using a statistical function. Common aggregation functions include sum, mean, maximum, minimum, count, etc. However, counting distinct values requires a bit more attention because it involves identifying unique values within each group.
Setting Up Your Environment
Before diving into the examples, ensure you have the Pandas library installed in your Python environment:
pip install pandas
Example 1: Basic DataFrame Creation
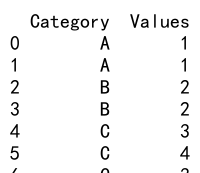
Let’s start by creating a simple DataFrame that we will use in our examples:
import pandas as pd

data = {
    'Category': ['A', 'A', 'B', 'B', 'C', 'C', 'C'],
    'Values': [1, 1, 2, 2, 3, 4, 3]
}
df = pd.DataFrame(data)
print(df)
Output:
Example 2: Count Distinct Values in Entire DataFrame
To count distinct values across the entire DataFrame, you can use the nunique method:
import pandas as pd

data = {
    'Category': ['A', 'A', 'B', 'B', 'C', 'C', 'C'],
    'Values': [1, 1, 2, 2, 3, 4, 3]
}
df = pd.DataFrame(data)
distinct_count = df.nunique()
print(distinct_count)
Output:

Example 3: Count Distinct Values for a Single Column
If you need to count distinct values in a specific column, you can specify the column name:
import pandas as pd

data = {
    'Category': ['A', 'A', 'B', 'B', 'C', 'C', 'C'],
    'Values': [1, 1, 2, 2, 3, 4, 3]
}
df = pd.DataFrame(data)
distinct_values = df['Category'].nunique()
print(distinct_values)
Output:

Example 4: Count Distinct Values Using GroupBy
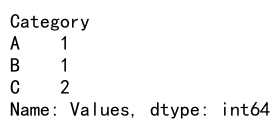
Grouping data and then counting distinct values within each group is a common operation:
import pandas as pd

data = {
    'Category': ['A', 'A', 'B', 'B', 'C', 'C', 'C'],
    'Values': [1, 1, 2, 2, 3, 4, 3]
}
df = pd.DataFrame(data)
distinct_count_grouped = df.groupby('Category')['Values'].nunique()
print(distinct_count_grouped)
Output:
Example 5: Using Agg with Count Distinct
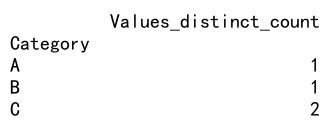
The agg function can be used to apply multiple aggregation operations, including counting distinct values:
import pandas as pd

data = {
    'Category': ['A', 'A', 'B', 'B', 'C', 'C', 'C'],
    'Values': [1, 1, 2, 2, 3, 4, 3]
}
df = pd.DataFrame(data)
result = df.groupby('Category').agg(Values_distinct_count=('Values', 'nunique'))
print(result)
Output:
Example 6: Count Distinct in Multiple Columns
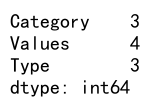
You can also count distinct values across multiple columns using agg:
import pandas as pd

data = {
    'Category': ['A', 'A', 'B', 'B', 'C', 'C', 'C'],
    'Values': [1, 1, 2, 2, 3, 4, 3],
    'Type': ['X', 'X', 'Y', 'Y', 'Z', 'X', 'Z']
}
df = pd.DataFrame(data)
result = df.agg({'Category': 'nunique', 'Values': 'nunique', 'Type': 'nunique'})
print(result)
Output:
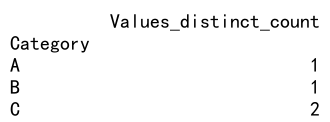
Example 7: Custom Aggregation Function
Sometimes, you might need to define a custom function for aggregation. Here’s how you can do it:
import pandas as pd

data = {
    'Category': ['A', 'A', 'B', 'B', 'C', 'C', 'C'],
    'Values': [1, 1, 2, 2, 3, 4, 3]
}
df = pd.DataFrame(data)

def count_distinct(series):
    return series.nunique()

result = df.groupby('Category').agg(Values_distinct_count=('Values', count_distinct))
print(result)
Output:
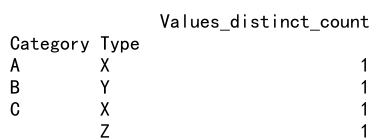
Example 8: Count Distinct Across Multiple GroupBy Columns
Grouping by multiple columns and counting distinct values can provide deeper insights:
import pandas as pd

data = {
    'Category': ['A', 'A', 'B', 'B', 'C', 'C', 'C'],
    'Values': [1, 1, 2, 2, 3, 4, 3],
    'Type': ['X', 'X', 'Y', 'Y', 'Z', 'X', 'Z']
}
df = pd.DataFrame(data)
result = df.groupby(['Category', 'Type']).agg(Values_distinct_count=('Values', 'nunique'))
print(result)
Output:
Example 9: Count Distinct with Condition
Applying conditions while counting distinct values can be achieved using a lambda function:
import pandas as pd

data = {
    'Category': ['A', 'A', 'B', 'B', 'C', 'C', 'C'],
    'Values': [1, 1, 2, 2, 3, 4, 3],
    'Type': ['X', 'X', 'Y', 'Y', 'Z', 'X', 'Z']
}
df = pd.DataFrame(data)
result = df[df['Type'] == 'X'].agg(Values_distinct_count=('Values', 'nunique'))
print(result)
Output:

Example 10: Complex Aggregation with Multiple Functions
Combining multiple aggregation functions, including count distinct, can be very powerful:
import pandas as pd

data = {
    'Category': ['A', 'A', 'B', 'B', 'C', 'C', 'C'],
    'Values': [1, 1, 2, 2, 3, 4, 3],
    'Type': ['X', 'X', 'Y', 'Y', 'Z', 'X', 'Z']
}
df = pd.DataFrame(data)
result = df.groupby('Category').agg(
    Values_distinct_count=('Values', 'nunique'),
    Total_Values=('Values', 'sum')
)
print(result)
Output:

Pandas agg count distinct conclusion
Counting distinct values is a crucial operation in data analysis, especially when dealing with large datasets. Pandas provides flexible and powerful tools to perform this operation efficiently. By using the agg function along with nunique, you can easily count distinct values across different dimensions of your data. This capability is essential for summarizing and understanding the unique characteristics of your data.
In this article, we explored various ways to count distinct values using Pandas, from simple counts to more complex grouped aggregations. These examples should help you apply these techniques in your own data analysis tasks.
 Pandas Dataframe