How to Use Pandas cut
Pandas is a powerful data manipulation library in Python, widely used in data analysis and data science. One of the useful functions provided by Pandas is cut, which is used to segment and sort data values into bins. This function is incredibly useful for converting continuous data into categorical data, which can be beneficial for analysis, visualization, and machine learning preprocessing. In this article, we will explore the cut function in detail, providing comprehensive examples to illustrate its usage.
Understanding the cut Function
The cut function in Pandas is used to bin continuous data into discrete intervals. This can help in transforming continuous variables into categorical variables, which are easier to analyze and interpret in certain scenarios. The basic syntax of the cut function is:
pandas.cut(x, bins, right=True, labels=None, retbins=False, precision=3, include_lowest=False, duplicates='raise')
x: The input array to be binned.bins: Defines the bin edges.right: Indicates whether the bins include the rightmost edge or not.labels: Specifies the labels for the returned bins.retbins: Whether to return the bins or not.precision: The precision of the bin edges.include_lowest: Whether the first interval should be left-inclusive or not.duplicates: Handling of duplicate edges.
Basic Usage of cut
Example 1: Basic Binning
import pandas as pd

data = pd.Series([0.1, 1.5, 2.4, 4.8, 7.3])
bins = [0, 1, 2, 3, 4, 5]
categories = pd.cut(data, bins)
print(categories)
Output:

Example 2: Labeling Bins
import pandas as pd

data = pd.Series([0.1, 1.5, 2.4, 4.8, 7.3])
bins = [0, 1, 2, 3, 4, 5]
labels = ['Very Low', 'Low', 'Medium', 'High', 'Very High']
categories = pd.cut(data, bins, labels=labels)
print(categories)
Output:

Example 3: Including the Lowest Bin
import pandas as pd

data = pd.Series([0.1, 1.5, 2.4, 4.8, 7.3])
bins = [0, 1, 2, 3, 4, 5]
categories = pd.cut(data, bins, include_lowest=True)
print(categories)
Output:

Example 4: Excluding the Rightmost Edge
import pandas as pd

data = pd.Series([0.1, 1.5, 2.4, 4.8, 7.3])
bins = [0, 1, 2, 3, 4, 5]
categories = pd.cut(data, bins, right=False)
print(categories)
Output:

Advanced Usage of cut
Example 5: Returning Bins
import pandas as pd

data = pd.Series([0.1, 1.5, 2.4, 4.8, 7.3])
bins = [0, 1, 2, 3, 4, 5]
categories, returned_bins = pd.cut(data, bins, retbins=True)
print(returned_bins)
Output:

Example 6: Handling Duplicates
import pandas as pd

data = pd.Series([0.1, 1.5, 2.4, 4.8, 7.3])
bins = [0, 1, 2, 2, 3, 4, 5]  # Notice the duplicate '2'
categories = pd.cut(data, bins, duplicates='drop')
print(categories)
Output:

Example 7: Precision of Bins
import pandas as pd

data = pd.Series([0.1234, 1.5678, 2.9999, 4.4444, 7.8888])
bins = [0, 1, 2, 3, 4, 5]
categories = pd.cut(data, bins, precision=2)
print(categories)
Output:

Practical Examples
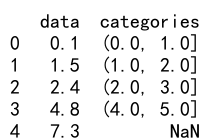
Example 8: Binning a DataFrame Column
import pandas as pd

df = pd.DataFrame({
    'data': [0.1, 1.5, 2.4, 4.8, 7.3]
})
bins = [0, 1, 2, 3, 4, 5]
df['categories'] = pd.cut(df['data'], bins)
print(df)
Output:

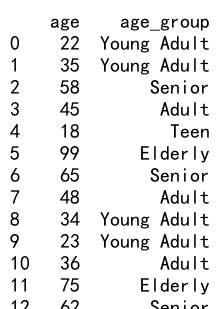
Example 9: Using cut with Real-World Data
import pandas as pd

# Assume df is a DataFrame obtained from some real-world dataset
df = pd.DataFrame({
    'age': [22, 35, 58, 45, 18, 99, 65, 48, 34, 23, 36, 75, 62, 44, 27]
})
bins = [0, 18, 35, 50, 65, 100]
age_groups = pd.cut(df['age'], bins, labels=['Teen', 'Young Adult', 'Adult', 'Senior', 'Elderly'])
df['age_group'] = age_groups
print(df)
Output:

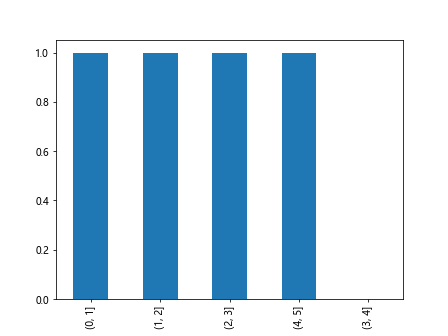
Example 10: Visualizing Binned Data
import pandas as pd
import matplotlib.pyplot as plt

data = pd.Series([0.1, 1.5, 2.4, 4.8, 7.3])
bins = [0, 1, 2, 3, 4, 5]
categories = pd.cut(data, bins)
categories.value_counts().plot(kind='bar')
plt.show()
Output:

How to Use Pandas cut Conclusion
The cut function in Pandas is a versatile tool for binning continuous data into discrete intervals. It can be used for data preprocessing, feature engineering, and data visualization. By understanding and utilizing this function, data analysts and scientists can effectively transform and analyze their data.
 Pandas Dataframe