Pandas Correlation Between One Column and All Others
Correlation analysis is a vital statistical tool that helps to understand the relationship between two variables. In data science, understanding these relationships can help in feature selection, data preprocessing, and gaining insights into the data set. Pandas, a powerful Python library for data manipulation and analysis, provides straightforward methods to compute correlations. This article will focus on how to calculate the correlation between one specific column and all other columns in a DataFrame using Pandas.
Introduction to Correlation
Correlation measures the degree to which two variables move in relation to each other. Correlation coefficients can range from -1 to 1. A correlation of +1 indicates a perfect positive relationship, -1 indicates a perfect negative relationship, and 0 indicates no relationship between the variables.
In Pandas, the primary function used to calculate correlation is DataFrame.corr(), which provides the correlation matrix for the DataFrame columns. However, when the requirement is to find the correlation of one specific column with all others, a more targeted approach is needed.
Setting Up Your Environment
Before diving into the examples, ensure you have the Pandas library installed in your Python environment:
pip install pandas
Creating a Sample DataFrame
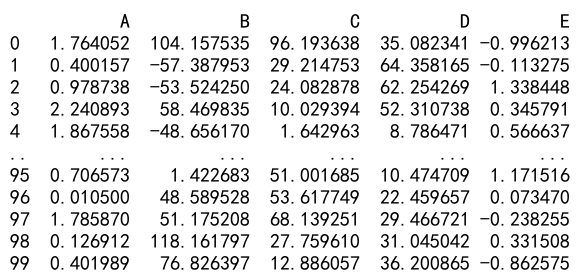
First, let’s create a sample DataFrame to work with. This DataFrame will contain some synthetic data which we will use to demonstrate how to compute correlations.
import pandas as pd
import numpy as np

# Seed for reproducibility
np.random.seed(0)

data = {
    'A': np.random.randn(100),
    'B': np.random.randn(100) * 50 + 10,
    'C': np.random.rand(100) * 100,
    'D': np.random.beta(2, 5, size=100) * 100,
    'E': np.random.normal(loc=0.0, scale=1.0, size=100)
}

df = pd.DataFrame(data)

print(df)
Output:

Calculating Correlation
Basic Correlation Calculation
To calculate the correlation between all columns, you can use:
import pandas as pd
import numpy as np

# Seed for reproducibility
np.random.seed(0)

data = {
    'A': np.random.randn(100),
    'B': np.random.randn(100) * 50 + 10,
    'C': np.random.rand(100) * 100,
    'D': np.random.beta(2, 5, size=100) * 100,
    'E': np.random.normal(loc=0.0, scale=1.0, size=100)
}

df = pd.DataFrame(data)

correlation_matrix = df.corr()
print(correlation_matrix)
Output:

Correlation with a Specific Column
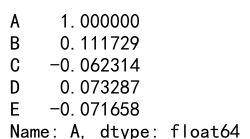
To focus on the correlation of one column with all others, you can select the specific row or column from the correlation matrix. For instance, to find how all columns correlate with column ‘A’:
import pandas as pd
import numpy as np

# Seed for reproducibility
np.random.seed(0)

data = {
    'A': np.random.randn(100),
    'B': np.random.randn(100) * 50 + 10,
    'C': np.random.rand(100) * 100,
    'D': np.random.beta(2, 5, size=100) * 100,
    'E': np.random.normal(loc=0.0, scale=1.0, size=100)
}

df = pd.DataFrame(data)

correlation_with_A = df.corr().loc['A']
print(correlation_with_A)
Output:

Example Codes
Below are various examples showing how to calculate the correlation between one column and all others in different scenarios and data manipulations.
Example 1: Basic Correlation with Column ‘B’
import pandas as pd
import numpy as np

data = {
    'pandasdataframe.com_A': np.random.randn(100),
    'pandasdataframe.com_B': np.random.randn(100) * 50 + 10,
    'pandasdataframe.com_C': np.random.rand(100) * 100,
}
df = pd.DataFrame(data)
correlation_with_B = df.corr().loc['pandasdataframe.com_B']

print(correlation_with_B)
Output:

Example 2: Adding a Categorical Variable
import pandas as pd
import numpy as np

data = {
    'pandasdataframe.com_A': np.random.randn(100),
    'pandasdataframe.com_B': np.random.randn(100) * 50 + 10,
    'pandasdataframe.com_C': np.random.rand(100) * 100,
}
df = pd.DataFrame(data)

data['pandasdataframe.com_Category'] = pd.Categorical(['cat', 'dog', 'rabbit'] * 33 + ['cat'])
df = pd.DataFrame(data)
df = pd.get_dummies(df, columns=['pandasdataframe.com_Category'])
correlation_with_B = df.corr().loc['pandasdataframe.com_B']
print(correlation_with_B)
Output:

Example 3: Handling Missing Values
import pandas as pd
import numpy as np

data = {
    'pandasdataframe.com_A': np.random.randn(100),
    'pandasdataframe.com_B': np.random.randn(100) * 50 + 10,
    'pandasdataframe.com_C': np.random.rand(100) * 100,
}

data['pandasdataframe.com_A'][5] = np.nan  # Introduce a NaN value
df = pd.DataFrame(data)
correlation_with_B = df.corr().loc['pandasdataframe.com_B']
print(correlation_with_B)
Output:

Example 4: Correlation with Time Series Data
import pandas as pd
import numpy as np

data = {
    'pandasdataframe.com_A': np.random.randn(100),
    'pandasdataframe.com_B': np.random.randn(100) * 50 + 10,
    'pandasdataframe.com_C': np.random.rand(100) * 100,
}

dates = pd.date_range(start='1/1/2020', periods=100)
data['pandasdataframe.com_Date'] = dates
df = pd.DataFrame(data)
df.set_index('pandasdataframe.com_Date', inplace=True)
correlation_with_B = df.corr().loc['pandasdataframe.com_B']
print(correlation_with_B)
Output:

Example 5: Using Spearman’s Rank Correlation
import pandas as pd
import numpy as np

data = {
    'pandasdataframe.com_A': np.random.randn(100),
    'pandasdataframe.com_B': np.random.randn(100) * 50 + 10,
    'pandasdataframe.com_C': np.random.rand(100) * 100,
}
df = pd.DataFrame(data)

correlation_with_B = df.corr(method='spearman').loc['pandasdataframe.com_B']
print(correlation_with_B)
Output:

Example 6: Correlation in a Large DataFrame
import pandas as pd
import numpy as np

data = {
    'pandasdataframe.com_A': np.random.randn(100),
    'pandasdataframe.com_B': np.random.randn(100) * 50 + 10,
    'pandasdataframe.com_C': np.random.rand(100) * 100,
}
df = pd.DataFrame(data)

large_data = {f'pandasdataframe.com_col_{i}': np.random.rand(100) for i in range(50)}
df_large = pd.DataFrame(large_data)
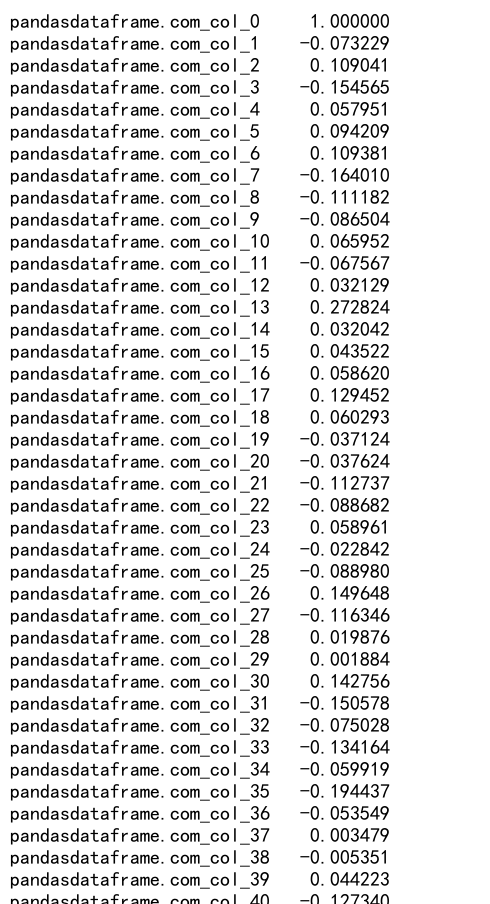
correlation_with_col_0 = df_large.corr().loc['pandasdataframe.com_col_0']
print(correlation_with_col_0)
Output:

Pandas Correlation Between One Column and All Others Conclusion
Calculating the correlation between one column and all others in a DataFrame is a common task in data analysis. Using Pandas, this can be achieved efficiently with just a few lines of code. The examples provided demonstrate various scenarios and data manipulations to help you understand and implement these calculations in your data analysis projects.
 Pandas Dataframe