Pandas Correlation Between All Columns
Correlation analysis is a vital statistical tool that helps in determining the degree to which two variables are related. In data science, understanding the correlation between different features can help in feature selection, understanding data structure, and predicting one variable from another. Pandas, a powerful data manipulation library in Python, provides straightforward methods to compute correlations between all columns in a DataFrame. This article will explore how to calculate and interpret these correlations using various methods provided by pandas.
Introduction to Correlation
Correlation measures the strength and direction of a linear relationship between two variables. The values range between -1 and 1, where:
– 1 indicates a perfect positive linear relationship,
– -1 indicates a perfect negative linear relationship,
– 0 indicates no linear relationship.
Pandas primarily uses Pearson’s correlation coefficient, but it also supports Kendall’s Tau and Spearman’s rank correlation.
Setting Up Your Environment
Before diving into the examples, ensure you have the pandas library installed in your Python environment:
pip install pandas
Example 1: Basic Correlation Matrix
Let’s start by creating a simple DataFrame and calculating the Pearson correlation matrix.
import pandas as pd
import numpy as np

# Sample data
data = {
    'A': np.random.randn(100),
    'B': np.random.rand(100),
    'C': np.random.randn(100) * 100,
    'D': np.random.rand(100) * 100
}
df = pd.DataFrame(data)

# Compute the correlation matrix
correlation_matrix = df.corr()
print(correlation_matrix)
Output:

Example 2: Spearman’s Rank Correlation
Spearman’s rank correlation is a non-parametric test that is used to measure the degree of association between two variables.
import pandas as pd
import numpy as np

# Sample data
data = {
    'A': np.random.randn(100),
    'B': np.random.rand(100),
    'C': np.random.randn(100) * 100,
    'D': np.random.rand(100) * 100
}
df = pd.DataFrame(data)

# Compute the Spearman's rank correlation matrix
spearman_corr = df.corr(method='spearman')
print(spearman_corr)
Output:

Example 3: Kendall’s Tau Correlation
Kendall’s Tau is another non-parametric statistic used to measure the ordinal association between two measured quantities.
import pandas as pd
import numpy as np

# Sample data
data = {
    'A': np.random.randn(100),
    'B': np.random.rand(100),
    'C': np.random.randn(100) * 100,
    'D': np.random.rand(100) * 100
}
df = pd.DataFrame(data)

# Compute the Kendall's Tau correlation matrix
kendall_corr = df.corr(method='kendall')
print(kendall_corr)
Output:

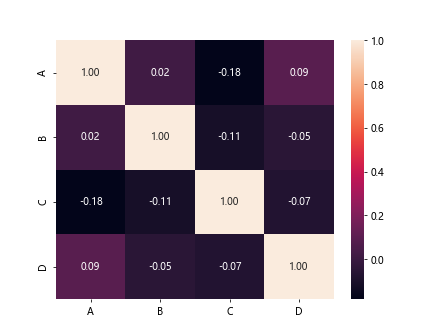
Example 4: Visualizing Correlation Matrix Using Seaborn
Visualization helps in understanding the correlation matrix better. Here’s how you can visualize it using Seaborn, another Python library for making statistical graphics.
import seaborn as sns
import matplotlib.pyplot as plt
import pandas as pd
import numpy as np

# Sample data
data = {
    'A': np.random.randn(100),
    'B': np.random.rand(100),
    'C': np.random.randn(100) * 100,
    'D': np.random.rand(100) * 100
}
df = pd.DataFrame(data)

# Compute the correlation matrix
corr = df.corr()

# Generate a heatmap
sns.heatmap(corr, annot=True, fmt=".2f")
plt.show()
Output:

Example 5: Handling Missing Data
Correlation calculations can be affected by missing data. Here’s how to handle missing values before computing correlations.
import pandas as pd
import numpy as np

# Sample data
data = {
    'A': np.random.randn(100),
    'B': np.random.rand(100),
    'C': np.random.randn(100) * 100,
    'D': np.random.rand(100) * 100
}
df = pd.DataFrame(data)

# Drop rows with missing values
df_cleaned = df.dropna()
correlation_matrix_cleaned = df_cleaned.corr()
print(correlation_matrix_cleaned)
Output:

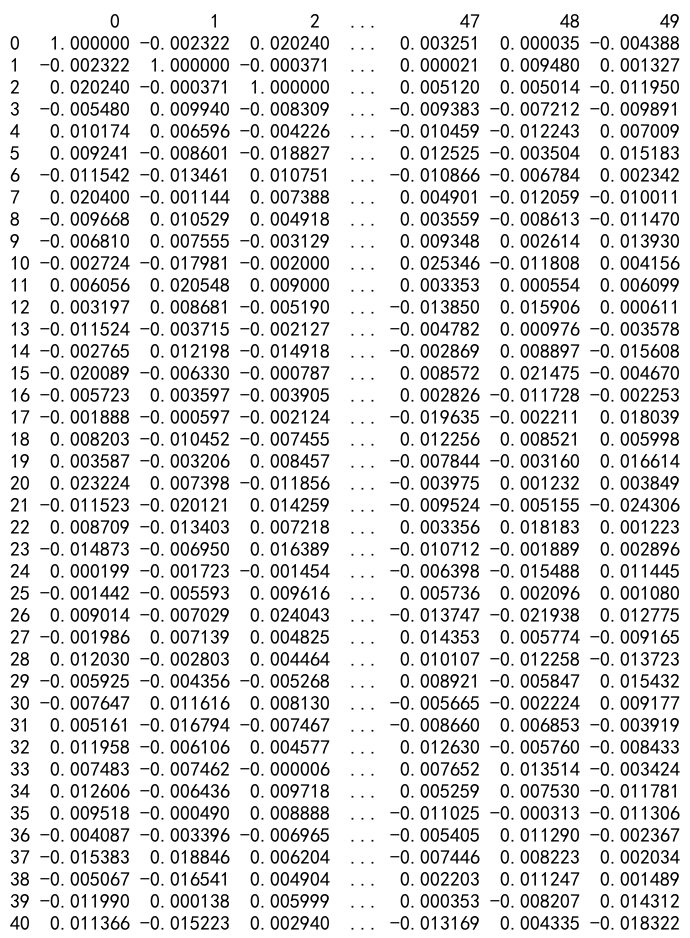
Example 6: Large DataFrames
Handling large DataFrames efficiently while computing correlation matrices is crucial for performance.
import pandas as pd
import numpy as np

# Sample data
data = {
    'A': np.random.randn(100),
    'B': np.random.rand(100),
    'C': np.random.randn(100) * 100,
    'D': np.random.rand(100) * 100
}
df = pd.DataFrame(data)

# Generating a large DataFrame
large_data = np.random.rand(10000, 50)
large_df = pd.DataFrame(large_data)

# Compute correlation matrix for a large DataFrame
large_corr_matrix = large_df.corr()
print(large_corr_matrix)
Output:

Example 7: Correlation with Lagged Variables
In time series analysis, calculating the correlation of lagged variables can provide insights into temporal dynamics.
import pandas as pd
import numpy as np

# Sample data
data = {
    'A': np.random.randn(100),
    'B': np.random.rand(100),
    'C': np.random.randn(100) * 100,
    'D': np.random.rand(100) * 100
}
df = pd.DataFrame(data)

# Creating a lagged variable
df['A_lagged'] = df['A'].shift(1)

# Compute correlation matrix with lagged variable
lagged_corr = df.corr()
print(lagged_corr)
Output:

Pandas Correlation Between All Columns Conclusion
Understanding and computing correlations in pandas is a fundamental skill for data analysis. By leveraging pandas’ built-in functions, you can efficiently explore relationships between variables in large datasets. This guide provided multiple examples to help you master correlation analysis using pandas, enhancing your data science toolkit.
 Pandas Dataframe