Pandas Correlation Between Two Series
Correlation is a statistical measure that expresses the extent to which two variables are linearly related. It is a common tool for describing simple relationships without making a statement about cause and effect. This article focuses on how to compute the correlation between two series using the Pandas library in Python. Pandas is a powerful data manipulation and analysis tool that makes it easy to work with structured data, especially for data munging and preparation.
Understanding Correlation
Before diving into the code, let’s understand what correlation is. Correlation coefficients can range from -1 to 1. A correlation of -1 indicates a perfect negative correlation, meaning as one variable increases, the other decreases. A correlation of 1 indicates a perfect positive correlation, meaning as one variable increases, the other also increases. A correlation of 0 means no correlation exists.
The most commonly used correlation coefficient is Pearson’s correlation coefficient, which measures the linear relationship between two continuous variables. However, other types of correlation coefficients include Spearman’s rank correlation (which does not assume a linear relationship and uses ranks of data) and Kendall’s tau (which is similar to Spearman’s but uses a different method of calculation).
Setting Up Your Environment
To follow along with the example codes, you will need to have Python and Pandas installed. You can install Pandas using pip:
pip install pandas
Example 1: Basic Correlation Calculation
This example demonstrates how to calculate the Pearson correlation coefficient between two pandas Series.
import pandas as pd

# Create two Series
data1 = pd.Series([1, 2, 3, 4, 5], name="pandasdataframe.com_series1")
data2 = pd.Series([5, 4, 3, 2, 1], name="pandasdataframe.com_series2")

# Calculate Pearson correlation
correlation = data1.corr(data2)
print(correlation)
Output:

Example 2: Using DataFrames
While the previous example used Series directly, it’s common to work with DataFrames. Here’s how you can calculate correlation between two columns in a DataFrame.
import pandas as pd

# Create a DataFrame
df = pd.DataFrame({
    "A": [1, 2, 3, 4, 5],
    "B": [5, 4, 3, 2, 1]
}, index=[f"pandasdataframe.com_{i}" for i in range(1, 6)])

# Calculate Pearson correlation between columns 'A' and 'B'
correlation = df['A'].corr(df['B'])
print(correlation)
Output:

Example 3: Spearman’s Rank Correlation
This example calculates Spearman’s rank correlation, which does not assume a linear relationship and can be more appropriate for ordinal data.
import pandas as pd

# Create two Series
data1 = pd.Series([1, 2, 3, 4, 5], name="pandasdataframe.com_series1")
data2 = pd.Series([5, 4, 3, 2, 1], name="pandasdataframe.com_series2")

# Calculate Spearman's correlation
correlation = data1.corr(data2, method='spearman')
print(correlation)
Output:

Example 4: Kendall’s Tau Correlation
Kendall’s tau is another non-parametric correlation measure used to determine the ordinal association between two measured quantities.
import pandas as pd

# Create two Series
data1 = pd.Series([1, 2, 3, 4, 5], name="pandasdataframe.com_series1")
data2 = pd.Series([5, 4, 3, 2, 1], name="pandasdataframe.com_series2")

# Calculate Kendall's tau correlation
correlation = data1.corr(data2, method='kendall')
print(correlation)
Output:

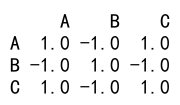
Example 5: Correlation Matrix
Often, you’ll want to calculate the correlation matrix for a dataset. Here’s how you can do it in Pandas.
import pandas as pd

# Create a DataFrame
df = pd.DataFrame({
    "A": [1, 2, 3, 4, 5],
    "B": [5, 4, 3, 2, 1],
    "C": [2, 3, 4, 5, 6]
})

# Calculate correlation matrix
correlation_matrix = df.corr()
print(correlation_matrix)
Output:

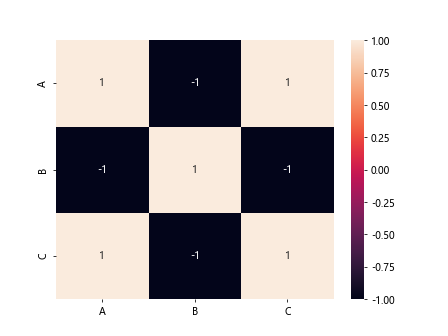
Example 6: Heatmap of Correlation Matrix
Visualizing the correlation matrix can be helpful. While this example won’t show the output, you can use seaborn to create a heatmap.
import pandas as pd
import seaborn as sns
import matplotlib.pyplot as plt

# Create a DataFrame
df = pd.DataFrame({
    "A": [1, 2, 3, 4, 5],
    "B": [5, 4, 3, 2, 1],
    "C": [2, 3, 4, 5, 6]
})

# Calculate correlation matrix
correlation_matrix = df.corr()

# Create a heatmap
sns.heatmap(correlation_matrix, annot=True)
plt.show()
Output:

Example 7: Correlation with Non-Numeric Data
Correlation calculations typically require numeric data. However, you can convert categorical data to numeric using techniques like one-hot encoding or label encoding before calculating correlation.
import pandas as pd

# Create a DataFrame with categorical data
df = pd.DataFrame({
    "A": [1, 2, 3, 4, 5],
    "B": ["low", "low", "high", "high", "medium"]
})

# Convert categorical data to numeric
df['B'] = df['B'].astype('category').cat.codes

# Calculate Pearson correlation
correlation = df['A'].corr(df['B'])
print(correlation)
Output:

Example 8: Time Series Correlation
Analyzing the correlation between time series data can reveal interesting insights, especially in finance and economics.
import pandas as pd

# Create time series data
dates = pd.date_range(start="2021-01-01", periods=5, freq='D')
data1 = pd.Series([1, 2, 3, 4, 5], index=dates, name="pandasdataframe.com_series1")
data2 = pd.Series([5, 4, 3, 2, 1], index=dates, name="pandasdataframe.com_series2")

# Calculate Pearson correlation
correlation = data1.corr(data2)
print(correlation)
Output:

Example 9: Correlation in a Large Dataset
When working with large datasets, it’s important to efficiently compute correlations. Pandas handles large datasets well, but be mindful of memory usage.
import pandas as pd
import numpy as np

# Generate large random data
data = np.random.rand(10000, 2)
df = pd.DataFrame(data, columns=["A", "B"])

# Calculate Pearson correlation
correlation = df['A'].corr(df['B'])
print(correlation)
Output:

Pandas Correlation Between Two Series Conclusion
Understanding how to compute and interpret correlation is crucial in many fields, including finance, economics, and medicine. Pandas provides a robust set of tools for calculating different types of correlation coefficients, handling missing data, and working with large datasets. By mastering these tools, you can uncover valuable insights into the relationships between variables in your data.
 Pandas Dataframe