Comprehensive Guide: Pandas GroupBy vs Pivot
Pandas groupby vs pivot are two powerful data manipulation techniques in the pandas library. Both methods allow you to reshape and aggregate data, but they serve different purposes and have distinct use cases. In this comprehensive guide, we’ll explore the differences between pandas groupby and pivot, their functionalities, and when to use each method. We’ll provide numerous examples to illustrate their usage and help you master these essential data transformation tools.
Understanding Pandas GroupBy
Pandas groupby is a versatile method for grouping data based on one or more columns and performing operations on the resulting groups. It’s particularly useful when you need to aggregate data or compute statistics for different categories within your dataset.
Basic Syntax of Pandas GroupBy
The basic syntax for using pandas groupby is as follows:
import pandas as pd

# Create a sample DataFrame
df = pd.DataFrame({
    'Name': ['John', 'Emma', 'John', 'Emma', 'Mike'],
    'Subject': ['Math', 'Science', 'English', 'Math', 'Science'],
    'Score': [85, 92, 78, 95, 88]
})

# Group by 'Name' and calculate mean score
grouped = df.groupby('Name')['Score'].mean()

print(grouped)
Output:
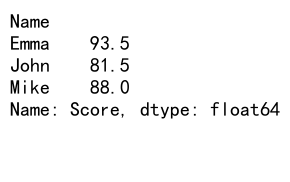
In this example, we group the DataFrame by the ‘Name’ column and calculate the mean score for each person. The groupby operation creates a GroupBy object, which we can then apply various aggregation functions to.
Aggregation Functions with GroupBy
Pandas groupby supports a wide range of aggregation functions. Here are some common ones:
import pandas as pd

# Create a sample DataFrame
df = pd.DataFrame({
    'Category': ['A', 'B', 'A', 'B', 'A', 'B'],
    'Value': [10, 20, 15, 25, 30, 35],
    'Quantity': [2, 3, 1, 4, 2, 3]
})

# Group by 'Category' and apply multiple aggregation functions
result = df.groupby('Category').agg({
    'Value': ['sum', 'mean', 'max'],
    'Quantity': ['sum', 'min']
})

print(result)
Output:
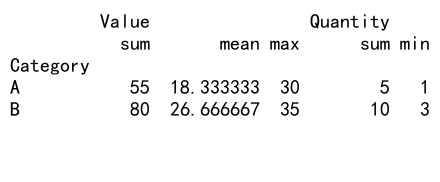
This example demonstrates how to apply multiple aggregation functions to different columns within a groupby operation. We calculate the sum, mean, and max of ‘Value’, and the sum and min of ‘Quantity’ for each category.
GroupBy with Multiple Columns
You can group by multiple columns to create more specific groupings:
import pandas as pd

# Create a sample DataFrame
df = pd.DataFrame({
    'Date': ['2023-01-01', '2023-01-01', '2023-01-02', '2023-01-02'],
    'Product': ['A', 'B', 'A', 'B'],
    'Sales': [100, 150, 120, 180]
})

# Convert 'Date' to datetime
df['Date'] = pd.to_datetime(df['Date'])

# Group by 'Date' and 'Product', then sum sales
result = df.groupby(['Date', 'Product'])['Sales'].sum().reset_index()

print(result)
Output:
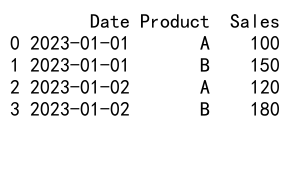
In this example, we group the data by both ‘Date’ and ‘Product’, then sum the ‘Sales’ for each unique combination. The reset_index() method is used to convert the result back to a DataFrame with named columns.
Applying Custom Functions with GroupBy
You can also apply custom functions to grouped data using the apply() method:
import pandas as pd

# Create a sample DataFrame
df = pd.DataFrame({
    'Name': ['John', 'Emma', 'Mike', 'Sarah'],
    'Age': [25, 30, 35, 28],
    'City': ['New York', 'London', 'New York', 'Paris']
})

# Define a custom function
def age_category(group):
    avg_age = group['Age'].mean()
    return 'Young' if avg_age < 30 else 'Adult'

# Apply the custom function to groups
result = df.groupby('City').apply(age_category)

print(result)
This example demonstrates how to apply a custom function to grouped data. We define an age_category function that categorizes each city based on the average age of its residents.
Understanding Pandas Pivot
Pandas pivot is a method used to reshape data by turning unique values from one column into multiple columns. It’s particularly useful when you want to create a spreadsheet-like view of your data or when you need to transform long-format data into wide-format.
Basic Syntax of Pandas Pivot
The basic syntax for using pandas pivot is as follows:
import pandas as pd

# Create a sample DataFrame
df = pd.DataFrame({
    'Date': ['2023-01-01', '2023-01-01', '2023-01-02', '2023-01-02'],
    'Product': ['A', 'B', 'A', 'B'],
    'Sales': [100, 150, 120, 180]
})

# Pivot the DataFrame
pivoted = df.pivot(index='Date', columns='Product', values='Sales')

print(pivoted)
Output:
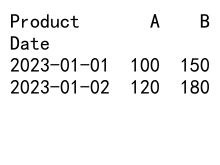
In this example, we pivot the DataFrame to create a new table where each unique product becomes a column, dates are the index, and sales values fill the cells.
Handling Multiple Values with Pivot
When you have multiple values for each combination of index and columns, you need to specify an aggregation function:
import pandas as pd

# Create a sample DataFrame with duplicate entries
df = pd.DataFrame({
    'Date': ['2023-01-01', '2023-01-01', '2023-01-01', '2023-01-02', '2023-01-02'],
    'Product': ['A', 'B', 'A', 'A', 'B'],
    'Sales': [100, 150, 110, 120, 180]
})

# Pivot the DataFrame with aggregation
pivoted = df.pivot_table(index='Date', columns='Product', values='Sales', aggfunc='sum')

print(pivoted)
Output:
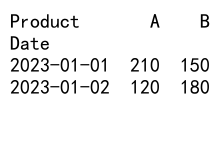
In this case, we use pivot_table() instead of pivot() and specify the aggfunc parameter to sum the sales for each product on each date.
Multi-Index Pivot Tables
You can create more complex pivot tables with multiple index or column levels:
import pandas as pd

# Create a sample DataFrame
df = pd.DataFrame({
    'Date': ['2023-01-01', '2023-01-01', '2023-01-02', '2023-01-02'],
    'Product': ['A', 'B', 'A', 'B'],
    'Category': ['Electronics', 'Clothing', 'Electronics', 'Clothing'],
    'Sales': [100, 150, 120, 180],
    'Units': [5, 10, 6, 12]
})

# Create a multi-index pivot table
pivoted = pd.pivot_table(df,
                         values=['Sales', 'Units'],
                         index=['Date'],
                         columns=['Category', 'Product'],
                         aggfunc='sum')

print(pivoted)
Output:
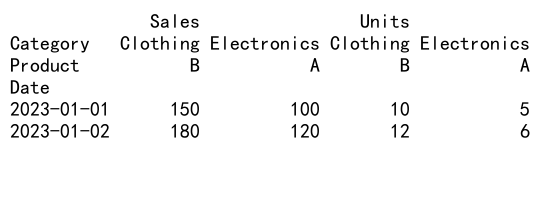
This example creates a pivot table with multiple column levels (Category and Product) and multiple value columns (Sales and Units).
Reshaping Data with Pivot
Pivot can be used to reshape data from long to wide format:
import pandas as pd

# Create a sample DataFrame in long format
df = pd.DataFrame({
    'Name': ['John', 'John', 'Emma', 'Emma', 'Mike', 'Mike'],
    'Subject': ['Math', 'Science', 'Math', 'Science', 'Math', 'Science'],
    'Score': [85, 92, 78, 95, 90, 88]
})

# Reshape data from long to wide format
reshaped = df.pivot(index='Name', columns='Subject', values='Score')

print(reshaped)
Output:
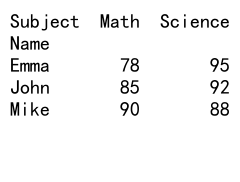
This example demonstrates how to use pivot to transform data from a long format (where each row represents a single observation) to a wide format (where each subject becomes a column).
Key Differences Between GroupBy and Pivot
While both pandas groupby and pivot are used for data transformation, they serve different purposes and have distinct characteristics:
- Purpose:
- GroupBy: Used for grouping data and performing aggregations or computations on groups.
- Pivot: Used for reshaping data by turning unique values from one column into multiple columns.
- Output Structure:
- GroupBy: Typically results in a reduced number of rows, with aggregated values for each group.
- Pivot: Changes the shape of the data, often resulting in a wider table with new columns.
- Aggregation:
- GroupBy: Requires explicit aggregation functions to be applied to grouped data.
- Pivot: Can perform implicit aggregation when there are multiple values for each combination of index and columns.
- Flexibility:
- GroupBy: More flexible for complex aggregations and custom operations on groups.
- Pivot: More straightforward for creating cross-tabulations and spreadsheet-like views.
- Data Format:
- GroupBy: Works well with data in various formats.
- Pivot: Often used to transform data from long format to wide format.
When to Use GroupBy vs Pivot
Choosing between pandas groupby and pivot depends on your specific data manipulation needs:
Use GroupBy When:
- You need to perform aggregations or computations on groups of data.
- You want to apply custom functions to grouped data.
- You need to maintain the original data structure while summarizing information.
- You’re working with large datasets and need to perform efficient group-wise operations.
Example use case for GroupBy:
import pandas as pd

# Create a sample sales DataFrame
df = pd.DataFrame({
    'Date': ['2023-01-01', '2023-01-01', '2023-01-02', '2023-01-02', '2023-01-03'],
    'Product': ['A', 'B', 'A', 'B', 'A'],
    'Sales': [100, 150, 120, 180, 90],
    'Region': ['North', 'South', 'North', 'South', 'East']
})

# Calculate total sales and average sales per product
result = df.groupby('Product').agg({
    'Sales': ['sum', 'mean']
})

print(result)
Output:
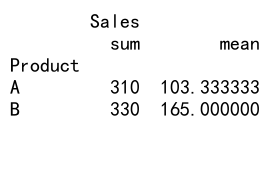
This example uses GroupBy to calculate total sales and average sales for each product across all dates and regions.
Use Pivot When:
- You want to reshape your data into a spreadsheet-like format.
- You need to transform data from long format to wide format.
- You want to create cross-tabulations or contingency tables.
- You’re preparing data for visualization or reporting purposes.
Example use case for Pivot:
import pandas as pd

# Create a sample survey DataFrame
df = pd.DataFrame({
    'Respondent': ['A', 'A', 'B', 'B', 'C', 'C'],
    'Question': ['Q1', 'Q2', 'Q1', 'Q2', 'Q1', 'Q2'],
    'Response': ['Yes', 'No', 'No', 'Yes', 'Yes', 'Yes']
})

# Pivot the data to create a cross-tabulation
pivoted = pd.pivot_table(df, values='Response', index='Respondent', columns='Question', aggfunc='first')

print(pivoted)
Output:
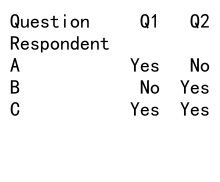
This example uses Pivot to transform survey data from long format to wide format, creating a cross-tabulation of responses for each respondent and question.
Advanced Techniques: Combining GroupBy and Pivot
In some cases, you might need to use both pandas groupby and pivot in combination to achieve more complex data transformations. Here’s an example that demonstrates this:
import pandas as pd

# Create a sample sales DataFrame
df = pd.DataFrame({
    'Date': ['2023-01-01', '2023-01-01', '2023-01-02', '2023-01-02', '2023-01-03'],
    'Product': ['A', 'B', 'A', 'B', 'A'],
    'Category': ['Electronics', 'Clothing', 'Electronics', 'Clothing', 'Electronics'],
    'Sales': [100, 150, 120, 180, 90],
    'Units': [5, 10, 6, 12, 4]
})

# Step 1: Group by Date and Category, and sum Sales and Units
grouped = df.groupby(['Date', 'Category']).agg({
    'Sales': 'sum',
    'Units': 'sum'
}).reset_index()

# Step 2: Pivot the grouped data
pivoted = grouped.pivot(index='Date', columns='Category', values=['Sales', 'Units'])

# Step 3: Flatten column names
pivoted.columns = [f'{col[1]}_{col[0]}' for col in pivoted.columns]

print(pivoted)
Output:
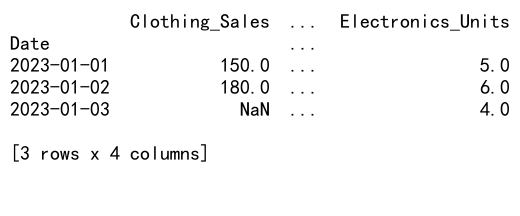
In this advanced example, we first use GroupBy to aggregate sales and units by date and category. Then, we use Pivot to reshape the data, creating a wide format table with sales and units for each category as separate columns.
Performance Considerations
When working with large datasets, it’s important to consider the performance implications of using pandas groupby vs pivot:
- Memory Usage:
- GroupBy: Generally more memory-efficient, especially for large datasets.
- Pivot: Can be memory-intensive, particularly when creating wide tables with many columns.
- Execution Speed:
- GroupBy: Often faster for aggregations and computations on groups.
- Pivot: Can be slower when dealing with large datasets or creating complex pivot tables.
- Data Size:
- GroupBy: Scales well with increasing data size.
- Pivot: Performance may degrade with very large datasets, especially when creating many new columns.
To optimize performance when using these methods:
- Use appropriate data types (e.g., categorical data for grouping columns).
- Filter and select only necessary columns before applying GroupBy or Pivot.
- Consider using alternative methods like
pivot_table()with specified aggregation functions for better control over memory usage.
Common Pitfalls and How to Avoid Them
When working with pandas groupby and pivot, there are some common pitfalls to be aware of:
- Duplicate Index Values:
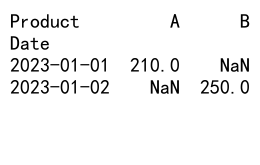
- Problem: Pivot can raise an error if there are duplicate values in the index.
- Solution: Use
pivot_table()instead ofpivot()and specify an aggregation function.
Example:
import pandas as pd

# Create a DataFrame with duplicate index values
df = pd.DataFrame({
    'Date': ['2023-01-01', '2023-01-01', '2023-01-02', '2023-01-02'],
    'Product': ['A', 'A', 'B', 'B'],
    'Sales': [100, 110, 120, 130]
})

# This will raise an error
# pivoted = df.pivot(index='Date', columns='Product', values='Sales')

# Use pivot_table instead
pivoted = pd.pivot_table(df, values='Sales', index='Date', columns='Product', aggfunc='sum')

print(pivoted)
Output:
- Missing Data:
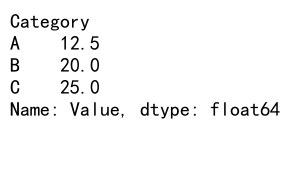
- Problem: GroupBy and Pivot can produce NaN values for missing combinations.
- Solution: Use the
fillna()method to replace NaN values with a desired value.
Example:
import pandas as pd

# Create a DataFrame with missing data
df = pd.DataFrame({
    'Category': ['A', 'B', 'A', 'C'],
    'Value': [10, 20, 15, 25]
})

# Group by Category and calculate mean
grouped = df.groupby('Category')['Value'].mean()

# Fill NaN values with 0
grouped_filled = grouped.fillna(0)

print(grouped_filled)
Output:
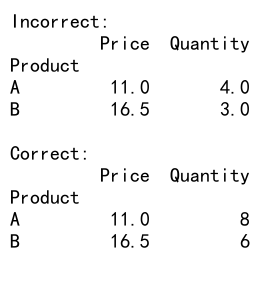
- Incorrect Aggregation:
- Problem: Using the wrong aggregation function can lead to incorrect results.
- Solution: Carefully choose the appropriate aggregation function for your data and analysis needs.
Example:
import pandas as pd

# Create a sample DataFrame
df = pd.DataFrame({
    'Product': ['A', 'A', 'B', 'B'],
    'Price': [10, 12, 15, 18],
    'Quantity': [5, 3, 4, 2]
})

# Incorrect: Using mean for both price and quantity
incorrect = df.groupby('Product').mean()

# Correct: Using mean for price and sum for quantity
correct = df.groupby('Product').agg({
    'Price': 'mean',
    'Quantity': 'sum'
})

print("Incorrect:")
print(incorrect)
print("\nCorrect:")
print(correct)
Output:
- Forgetting to Reset Index:
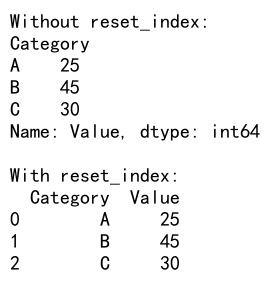
- Problem: GroupBy operations often result in a multi-index, which can be difficult to work with.
- Solution: Use the
reset_index()method to convert the result back to a regular DataFrame.
Example:
import pandas as pd

# Create a sample DataFrame
df = pd.DataFrame({
    'Category': ['A', 'B', 'A', 'B', 'C'],
    'Value': [10, 20, 15, 25, 30]
})

# GroupBy without resetting index
grouped = df.groupby('Category')['Value'].sum()

# GroupBy with reset_index
grouped_reset = df.groupby('Category')['Value'].sum().reset_index()

print("Without reset_index:")
print(grouped)
print("\nWith reset_index:")
print(grouped_reset)
Output:
Real-World Applications
Both pandas groupby and pivot have numerous real-world applications across various industries and data analysis tasks. Here are some examples:
Financial Analysis
In financial analysis, groupby is often used to aggregate transaction data and calculate summary statistics:
import pandas as pd

# Create a sample financial transactions DataFrame
df = pd.DataFrame({
    'Date': ['2023-01-01', '2023-01-02', '2023-01-01', '2023-01-02', '2023-01-03'],
    'Account': ['A', 'A', 'B', 'B', 'A'],
    'Transaction': [100, -50, 200, -75, 150],
    'Category': ['Income', 'Expense', 'Income', 'Expense', 'Income']
})

# Calculate total income and expenses by account
result = df.groupby(['Account', 'Category'])['Transaction'].sum().unstack()

print(result)
Output:
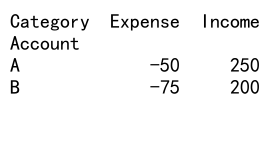
This example demonstrates how to use groupby to calculate total income and expenses for each account.
Sales Analysis
Pivot is particularly useful in sales analysis for creating cross-tabulations of sales data:
import pandas as pd

# Create a sample sales DataFrame
df = pd.DataFrame({
    'Date': ['2023-01-01', '2023-01-01', '2023-01-02', '2023-01-02', '2023-01-03'],
    'Product': ['A', 'B', 'A', 'B', 'C'],
    'Region': ['North', 'South', 'North', 'South', 'East'],
    'Sales': [100, 150, 120, 180, 90]
})

# Create a pivot table of sales by product and region
pivoted = pd.pivot_table(df, values='Sales', index='Product', columns='Region', aggfunc='sum', fill_value=0)

print(pivoted)
Output:
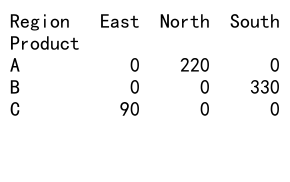
This example shows how to use pivot to create a summary of sales by product and region.
Customer Segmentation
GroupBy can be used for customer segmentation based on various metrics:
import pandas as pd

# Create a sample customer DataFrame
df = pd.DataFrame({
    'CustomerID': [1, 2, 3, 4, 5],
    'TotalPurchases': [500, 1200, 300, 800, 1500],
    'Frequency': [5, 10, 3, 7, 12],
    'RecencyDays': [30, 5, 60, 15, 2]
})

# Segment customers based on total purchases
def segment_customer(purchases):
    if purchases < 500:
        return 'Low Value'
    elif purchases < 1000:
        return 'Medium Value'
    else:
        return 'High Value'

# Apply segmentation
df['Segment'] = df['TotalPurchases'].apply(segment_customer)

# Calculate average metrics for each segment
result = df.groupby('Segment').agg({
    'TotalPurchases': 'mean',
    'Frequency': 'mean',
    'RecencyDays': 'mean'
})

print(result)
Output:
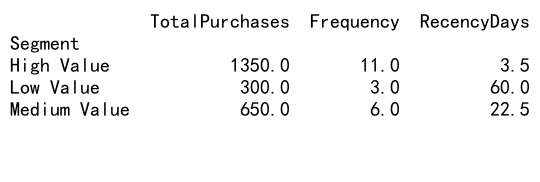
This example demonstrates how to use groupby for customer segmentation and calculating average metrics for each segment.
Conclusion
Pandas groupby and pivot are powerful tools for data manipulation and analysis in Python. While they serve different purposes, both methods are essential for transforming and summarizing data effectively. GroupBy is ideal for aggregating data and performing computations on groups, while Pivot excels at reshaping data and creating cross-tabulations.
 Pandas Dataframe