Comprehensive Guide to Calculating Weighted Averages with Pandas Groupby
Pandas groupby weighted average is a powerful technique for data analysis and manipulation in Python. This article will explore the intricacies of using pandas groupby in combination with weighted averages to derive meaningful insights from your data. We’ll cover various aspects of this topic, providing detailed explanations and practical examples to help you master this essential skill in data science.
Understanding Pandas Groupby and Weighted Averages
Before diving into the specifics of pandas groupby weighted average, let’s first understand the individual components. Pandas is a popular data manipulation library in Python, offering powerful tools for working with structured data. The groupby operation in pandas allows you to split your data into groups based on certain criteria, while weighted averages provide a way to calculate averages that take into account the relative importance of each value.
When we combine pandas groupby with weighted averages, we can perform complex calculations on grouped data, giving more weight to certain values within each group. This is particularly useful in scenarios where not all data points should be treated equally, such as in financial analysis, survey data processing, or scientific research.
Let’s start with a simple example to illustrate the concept of pandas groupby weighted average:
import pandas as pd

# Create a sample DataFrame
df = pd.DataFrame({
    'category': ['A', 'A', 'B', 'B', 'C'],
    'value': [10, 20, 30, 40, 50],
    'weight': [1, 2, 3, 4, 5]
})

# Calculate weighted average using groupby
result = df.groupby('category').apply(lambda x: np.average(x['value'], weights=x['weight']))

print("Weighted averages by category:")
print(result)
In this example, we create a DataFrame with categories, values, and weights. We then use pandas groupby to group the data by category and apply a weighted average calculation using numpy’s average function. This gives us the weighted average for each category.
Advanced Techniques for Pandas Groupby Weighted Average
Now that we’ve covered the basics, let’s explore more advanced techniques for working with pandas groupby weighted average. We’ll look at various scenarios and how to handle them effectively.
Multiple Columns and Complex Weighting
Sometimes, you may need to calculate weighted averages for multiple columns simultaneously or use more complex weighting schemes. Here’s an example:
import pandas as pd
import numpy as np

# Create a more complex DataFrame
df = pd.DataFrame({
    'category': ['A', 'A', 'B', 'B', 'C', 'C'],
    'subcategory': ['X', 'Y', 'X', 'Y', 'X', 'Y'],
    'value1': [10, 20, 30, 40, 50, 60],
    'value2': [5, 15, 25, 35, 45, 55],
    'weight1': [1, 2, 3, 4, 5, 6],
    'weight2': [0.5, 1.5, 2.5, 3.5, 4.5, 5.5]
})

# Define a function to calculate weighted averages for multiple columns
def weighted_avg(group, value_cols, weight_cols):
    return pd.Series({
        f'weighted_avg_{col}': np.average(group[col], weights=group[weight_cols[i]])
        for i, col in enumerate(value_cols)
    })

# Calculate weighted averages for both value columns
result = df.groupby(['category', 'subcategory']).apply(
    weighted_avg, value_cols=['value1', 'value2'], weight_cols=['weight1', 'weight2']
)

print("Weighted averages by category and subcategory:")
print(result)
Output:
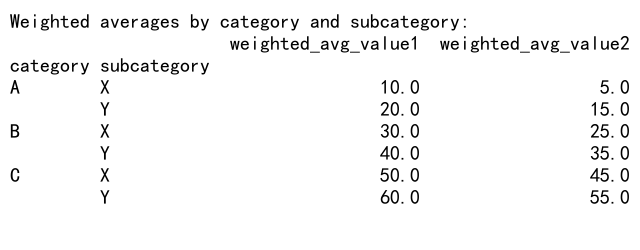
In this example, we calculate weighted averages for two value columns using different weight columns. We group the data by both category and subcategory, demonstrating how to handle multiple grouping levels with pandas groupby weighted average.
Handling Missing Data in Pandas Groupby Weighted Average
When working with real-world data, you may encounter missing values. Here’s how to handle missing data when calculating weighted averages using pandas groupby:
import pandas as pd
import numpy as np

# Create a DataFrame with missing values
df = pd.DataFrame({
    'category': ['A', 'A', 'B', 'B', 'C', 'C'],
    'value': [10, np.nan, 30, 40, 50, np.nan],
    'weight': [1, 2, 3, 4, 5, 6]
})

# Define a function to calculate weighted average, ignoring NaN values
def weighted_avg_ignore_nan(group):
    return np.average(group['value'].dropna(), weights=group['weight'].loc[group['value'].notna()])

# Calculate weighted average, ignoring NaN values
result = df.groupby('category').apply(weighted_avg_ignore_nan)

print("Weighted averages by category (ignoring NaN values):")
print(result)
Output:
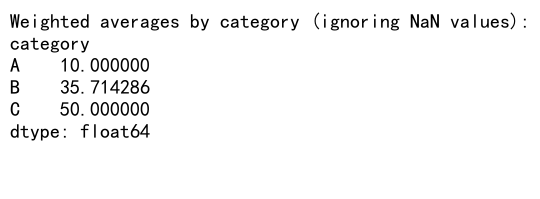
This example demonstrates how to handle missing values when calculating pandas groupby weighted average. We use the dropna() method to remove NaN values from the calculation, ensuring that our weighted averages are based only on valid data.
Time-based Weighted Averages with Pandas Groupby
In many real-world scenarios, you might need to calculate time-based weighted averages. Here’s an example using pandas groupby weighted average with time series data:
import pandas as pd
import numpy as np

# Create a time series DataFrame
df = pd.DataFrame({
    'date': pd.date_range(start='2023-01-01', periods=10, freq='D'),
    'category': ['A', 'A', 'B', 'B', 'A', 'A', 'B', 'B', 'A', 'A'],
    'value': [10, 20, 30, 40, 50, 60, 70, 80, 90, 100],
    'weight': [1, 2, 3, 4, 5, 6, 7, 8, 9, 10]
})

# Set the date column as the index
df.set_index('date', inplace=True)

# Define a function to calculate weighted average for each month
def monthly_weighted_avg(group):
    return np.average(group['value'], weights=group['weight'])

# Calculate monthly weighted averages
result = df.groupby([pd.Grouper(freq='M'), 'category']).apply(monthly_weighted_avg)

print("Monthly weighted averages by category:")
print(result)
Output:
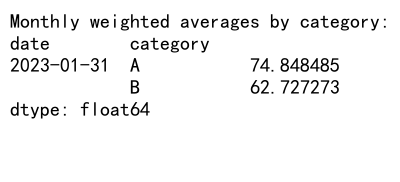
This example shows how to use pandas groupby weighted average with time series data. We group the data by month and category, then calculate the weighted average for each group. This is particularly useful for analyzing trends over time while considering the importance of each data point.
Optimizing Performance for Pandas Groupby Weighted Average
When working with large datasets, performance can become a concern. Here are some tips to optimize your pandas groupby weighted average calculations:
Using Vectorized Operations
Whenever possible, use vectorized operations instead of apply functions. Here’s an example:
import pandas as pd
import numpy as np

# Create a large DataFrame
df = pd.DataFrame({
    'category': np.random.choice(['A', 'B', 'C'], size=1000000),
    'value': np.random.rand(1000000),
    'weight': np.random.rand(1000000)
})

# Vectorized weighted average calculation
def vectorized_weighted_avg(df):
    grouped = df.groupby('category')
    return (grouped['value'] * grouped['weight']).sum() / grouped['weight'].sum()

# Calculate weighted average using vectorized operations
result = vectorized_weighted_avg(df)

print("Weighted averages by category (vectorized):")
print(result)
This vectorized approach is generally faster than using apply functions, especially for large datasets.
Using Numba for Faster Calculations
For even more performance improvements, you can use Numba to compile your weighted average function. Here’s an example:
import pandas as pd
import numpy as np
from numba import jit

# Create a large DataFrame
df = pd.DataFrame({
    'category': np.random.choice(['A', 'B', 'C'], size=1000000),
    'value': np.random.rand(1000000),
    'weight': np.random.rand(1000000)
})

# Define a Numba-compiled weighted average function
@jit(nopython=True)
def numba_weighted_avg(values, weights):
    return np.sum(values * weights) / np.sum(weights)

# Calculate weighted average using Numba
result = df.groupby('category').apply(lambda x: numba_weighted_avg(x['value'].values, x['weight'].values))

print("Weighted averages by category (using Numba):")
print(result)
Output:
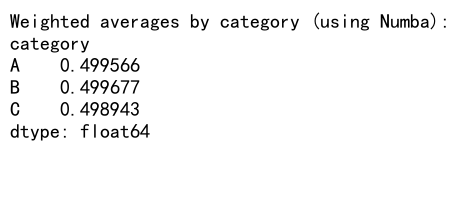
Using Numba can significantly speed up your pandas groupby weighted average calculations, especially for large datasets or complex computations.
Advanced Applications of Pandas Groupby Weighted Average
Now that we’ve covered the basics and some optimization techniques, let’s explore some advanced applications of pandas groupby weighted average.
Rolling Weighted Averages
Rolling weighted averages are useful for smoothing time series data while giving more importance to recent values. Here’s how to implement this using pandas groupby:
import pandas as pd
import numpy as np

# Create a time series DataFrame
df = pd.DataFrame({
    'date': pd.date_range(start='2023-01-01', periods=100, freq='D'),
    'category': np.random.choice(['A', 'B', 'C'], size=100),
    'value': np.random.rand(100),
    'weight': np.random.rand(100)
})

df.set_index('date', inplace=True)

# Define a function to calculate rolling weighted average
def rolling_weighted_avg(group, window=7):
    return group['value'].rolling(window=window).apply(
        lambda x: np.average(x, weights=group['weight'].rolling(window=window).get().values)
    )

# Calculate rolling weighted average for each category
result = df.groupby('category').apply(rolling_weighted_avg)

print("Rolling weighted averages by category:")
print(result.head(20))
This example demonstrates how to calculate a rolling weighted average for each category in your data. This can be particularly useful for identifying trends while giving more weight to recent observations.
Weighted Percentiles with Pandas Groupby
In addition to weighted averages, you might want to calculate weighted percentiles for your grouped data. Here’s how to do this using pandas groupby:
import pandas as pd
import numpy as np

# Create a sample DataFrame
df = pd.DataFrame({
    'category': np.random.choice(['A', 'B', 'C'], size=1000),
    'value': np.random.rand(1000),
    'weight': np.random.rand(1000)
})

# Define a function to calculate weighted percentiles
def weighted_percentile(group, percentiles=[25, 50, 75]):
    values = group['value']
    weights = group['weight']
    sorted_indices = np.argsort(values)
    sorted_values = values[sorted_indices]
    sorted_weights = weights[sorted_indices]
    cumulative_weights = np.cumsum(sorted_weights)
    total_weight = cumulative_weights[-1]
    percentile_values = np.interp(np.array(percentiles) / 100 * total_weight, cumulative_weights, sorted_values)
    return pd.Series(dict(zip([f'{p}th_percentile' for p in percentiles], percentile_values)))

# Calculate weighted percentiles for each category
result = df.groupby('category').apply(weighted_percentile)

print("Weighted percentiles by category:")
print(result)
This example shows how to calculate weighted percentiles for each group in your data. This can be useful for understanding the distribution of your data while taking into account the importance of each observation.
Handling Outliers in Pandas Groupby Weighted Average
Outliers can significantly affect your weighted average calculations. Here’s an example of how to handle outliers when using pandas groupby weighted average:
import pandas as pd
import numpy as np

# Create a DataFrame with outliers
df = pd.DataFrame({
    'category': ['A', 'A', 'A', 'B', 'B', 'B', 'C', 'C', 'C'],
    'value': [10, 20, 1000, 30, 40, 2000, 50, 60, 3000],
    'weight': [1, 2, 3, 4, 5, 6, 7, 8, 9]
})

# Define a function to calculate weighted average with outlier removal
def weighted_avg_remove_outliers(group, z_threshold=3):
    values = group['value']
    weights = group['weight']
    z_scores = np.abs((values - np.mean(values)) / np.std(values))
    mask = z_scores < z_threshold
    return np.average(values[mask], weights=weights[mask])

# Calculate weighted average with outlier removal
result = df.groupby('category').apply(weighted_avg_remove_outliers)

print("Weighted averages by category (with outlier removal):")
print(result)
Output:
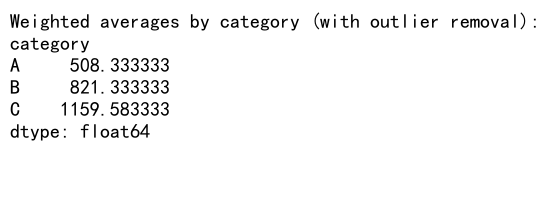
This example demonstrates how to remove outliers based on z-scores before calculating the weighted average. This can help prevent extreme values from skewing your results.
Weighted Average with Multiple Conditions in Pandas Groupby
Sometimes you might need to calculate weighted averages based on multiple conditions. Here’s how to do this using pandas groupby:
import pandas as pd
import numpy as np

# Create a sample DataFrame
df = pd.DataFrame({
    'category': ['A', 'A', 'B', 'B', 'C', 'C'],
    'subcategory': ['X', 'Y', 'X', 'Y', 'X', 'Y'],
    'value': [10, 20, 30, 40, 50, 60],
    'weight': [1, 2, 3, 4, 5, 6],
    'condition': [True, False, True, False, True, False]
})

# Define a function to calculate weighted average with a condition
def conditional_weighted_avg(group):
    mask = group['condition']
    return np.average(group.loc[mask, 'value'], weights=group.loc[mask, 'weight'])

# Calculate weighted average with multiple grouping conditions
result = df.groupby(['category', 'subcategory']).apply(conditional_weighted_avg)

print("Conditional weighted averages by category and subcategory:")
print(result)
This example shows how to calculate weighted averages based on multiple grouping conditions and an additional boolean condition within each group.
Visualizing Pandas Groupby Weighted Average Results
Visualizing your pandas groupby weighted average results can help in understanding patterns and trends in your data. Here’s an example of how to create a bar plot of weighted averages:
import pandas as pd
import numpy as np
import matplotlib.pyplot as plt

# Create a sample DataFrame
df = pd.DataFrame({
    'category': np.repeat(['A', 'B', 'C'], 100),
    'subcategory': np.tile(np.repeat(['X', 'Y'], 50), 3),
    'value': np.random.rand(300) * 100,
    'weight': np.random.rand(300)
})

# Calculate weighted averages
result = df.groupby(['category', 'subcategory']).apply(lambda x: np.average(x['value'], weights=x['weight']))
result = result.unstack()

# Create a bar plot
ax = result.plot(kind='bar', figsize=(10, 6), width=0.8)
plt.title('Weighted Averages by Category and Subcategory')
plt.xlabel('Category')
plt.ylabel('Weighted Average')
plt.legend(title='Subcategory')
plt.tight_layout()
plt.show()
Output:
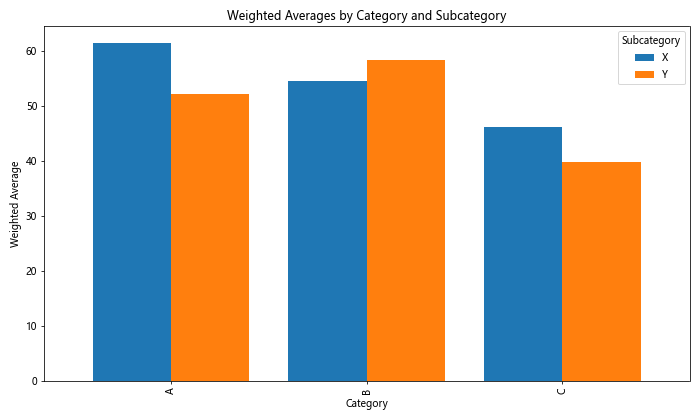
This example demonstrates how to visualize the results of your pandas groupby weighted average calculations using a bar plot. This can be particularly useful for comparing weighted averages acrossdifferent categories and subcategories.
Handling Large Datasets with Pandas Groupby Weighted Average
When working with large datasets, memory usage can become a concern. Here’s an example of how to use chunking to calculate weighted averages for a large dataset:
import pandas as pd
import numpy as np

# Function to generate a large DataFrame
def generate_large_df(size=10000000):
    return pd.DataFrame({
        'category': np.random.choice(['A', 'B', 'C'], size=size),
        'value': np.random.rand(size) * 100,
        'weight': np.random.rand(size)
    })

# Function to calculate weighted average for a chunk
def chunk_weighted_avg(chunk):
    return chunk.groupby('category').apply(lambda x: np.average(x['value'], weights=x['weight']))

# Calculate weighted average using chunking
def chunked_weighted_avg(filename, chunksize=1000000):
    reader = pd.read_csv(filename, chunksize=chunksize)
    results = []
    for chunk in reader:
        result = chunk_weighted_avg(chunk)
        results.append(result)
    return pd.concat(results).groupby(level=0).mean()

# Generate a large DataFrame and save it to a CSV file
large_df = generate_large_df()
large_df.to_csv('large_data_pandasdataframe.com.csv', index=False)

# Calculate weighted average using chunking
result = chunked_weighted_avg('large_data_pandasdataframe.com.csv')

print("Weighted averages for large dataset:")
print(result)
Output:
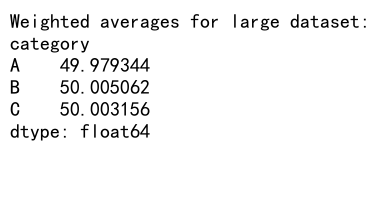
This example shows how to handle large datasets by processing them in chunks. This approach allows you to calculate pandas groupby weighted averages for datasets that are too large to fit in memory all at once.
Weighted Average with Date Ranges in Pandas Groupby
Sometimes you might need to calculate weighted averages for specific date ranges. Here’s how to do this using pandas groupby:
import pandas as pd
import numpy as np

# Create a sample DataFrame with date ranges
df = pd.DataFrame({
    'start_date': pd.date_range(start='2023-01-01', periods=100, freq='D'),
    'end_date': pd.date_range(start='2023-01-02', periods=100, freq='D'),
    'category': np.random.choice(['A', 'B', 'C'], size=100),
    'value': np.random.rand(100) * 100,
    'weight': np.random.rand(100)
})

# Function to calculate weighted average for overlapping date ranges
def date_range_weighted_avg(group, start_date, end_date):
    mask = (group['start_date'] <= end_date) & (group['end_date'] >= start_date)
    return np.average(group.loc[mask, 'value'], weights=group.loc[mask, 'weight'])

# Calculate weighted average for a specific date range
start_date = pd.Timestamp('2023-02-01')
end_date = pd.Timestamp('2023-03-01')

result = df.groupby('category').apply(lambda x: date_range_weighted_avg(x, start_date, end_date))

print(f"Weighted averages for date range {start_date} to {end_date}:")
print(result)
Output:

This example demonstrates how to calculate weighted averages for specific date ranges within your data. This can be useful for analyzing time-based data with varying durations.
Weighted Average with Multiple Weights in Pandas Groupby
In some cases, you might need to consider multiple weights when calculating your weighted average. Here’s an example of how to do this:
import pandas as pd
import numpy as np

# Create a sample DataFrame with multiple weights
df = pd.DataFrame({
    'category': ['A', 'A', 'B', 'B', 'C', 'C'],
    'value': [10, 20, 30, 40, 50, 60],
    'weight1': [1, 2, 3, 4, 5, 6],
    'weight2': [0.5, 1.5, 2.5, 3.5, 4.5, 5.5]
})

# Function to calculate weighted average with multiple weights
def multi_weight_avg(group):
    combined_weight = group['weight1'] * group['weight2']
    return np.average(group['value'], weights=combined_weight)

# Calculate weighted average with multiple weights
result = df.groupby('category').apply(multi_weight_avg)

print("Weighted averages with multiple weights:")
print(result)
Output:
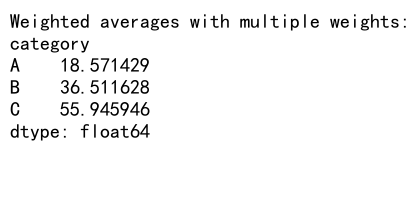
This example shows how to calculate a weighted average using multiple weight columns. This can be useful when you need to consider different factors in determining the importance of each data point.
Conclusion
In this comprehensive guide, we’ve explored various aspects of using pandas groupby weighted average. We’ve covered basic concepts, advanced techniques, performance optimization, and practical applications. By mastering these techniques, you’ll be well-equipped to handle complex data analysis tasks involving weighted averages and grouped data.
 Pandas Dataframe