Pandas Correlation by Group
Pandas is a powerful library in Python used for data manipulation and analysis. One of the common tasks in data analysis is to compute the correlation between variables. Correlation measures how closely two variables move in relation to each other. In this article, we will explore how to calculate correlations within groups of data using the Pandas library.
Understanding Correlation
Before diving into group-specific correlations, let’s understand the basics of correlation. Correlation coefficients range from -1 to 1. A correlation of 1 indicates a perfect positive relationship, -1 indicates a perfect negative relationship, and 0 indicates no relationship between the variables.
Example 1: Basic Correlation Calculation
import pandas as pd
import numpy as np

# Create a DataFrame
data = {'A': np.random.randn(100), 'B': np.random.randn(100)}
df = pd.DataFrame(data)

# Calculate correlation
correlation = df.corr()
print(correlation)
Output:

In this example, we create a DataFrame with two columns, A and B, filled with random numbers. We then use the corr() method to calculate the correlation between these two columns.
Grouping Data in Pandas
Pandas provides the groupby() function, which allows you to group data based on some criteria. Once data is grouped, you can apply various operations on these groups.
Example 2: Grouping Data
import pandas as pd

# Create a DataFrame
data = {'Group': ['A', 'A', 'B', 'B', 'C', 'C'], 'Value1': [1, 2, 3, 4, 5, 6], 'Value2': [6, 5, 4, 3, 2, 1]}
df = pd.DataFrame(data)

# Group data by the 'Group' column
grouped = df.groupby('Group')
print(grouped.mean())
Output:
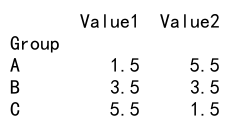
This example demonstrates how to group data by the ‘Group’ column and then calculate the mean of each group.
Calculating Correlation by Group
To calculate the correlation by group, we first group the data and then apply the correlation function to each group.
Example 3: Correlation by Group
import pandas as pd

# Create a DataFrame
data = {'Group': ['A', 'A', 'B', 'B', 'C', 'C'], 'Value1': [1, 2, 3, 4, 5, 6], 'Value2': [6, 5, 4, 3, 2, 1]}
df = pd.DataFrame(data)

# Group data and calculate correlation
grouped = df.groupby('Group').corr()
print(grouped)
Output:
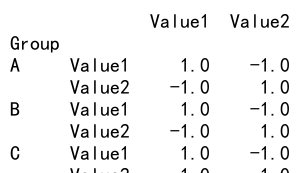
In this example, we group the data by the ‘Group’ column and then calculate the correlation for each group between ‘Value1’ and ‘Value2’.
Example 4: More Complex Grouping
import pandas as pd

# Create a DataFrame
data = {'Group1': ['X', 'X', 'Y', 'Y'], 'Group2': ['A', 'B', 'A', 'B'], 'Value1': [10, 20, 30, 40], 'Value2': [40, 30, 20, 10]}
df = pd.DataFrame(data)

# Group data by multiple columns and calculate correlation
grouped = df.groupby(['Group1', 'Group2']).corr()
print(grouped)
Output:
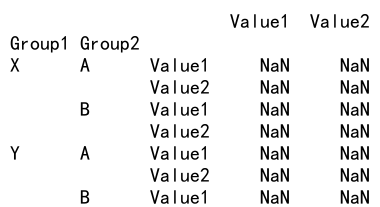
This example shows how to group data by multiple columns (‘Group1’ and ‘Group2’) and then calculate the correlation within each subgroup.
Example 5: Resetting Index after Grouping
import pandas as pd

# Create a DataFrame
data = {'Group': ['A', 'A', 'B', 'B', 'C', 'C'], 'Value1': [1, 2, 3, 4, 5, 6], 'Value2': [6, 5, 4, 3, 2, 1]}
df = pd.DataFrame(data)

# Group data, calculate correlation, and reset index
grouped = df.groupby('Group').corr().reset_index()
print(grouped)
Output:
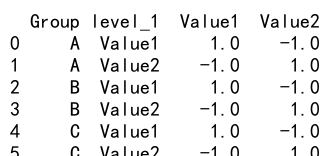
After grouping and calculating the correlation, we often need to reset the index to make the data more readable or for further processing. This example demonstrates how to reset the index after grouping and calculating correlations.
Example 6: Filtering Groups Based on Size
import pandas as pd

# Create a DataFrame
data = {'Group': ['A', 'A', 'B', 'B', 'B', 'C', 'C', 'C', 'C'], 'Value1': [1, 2, 3, 4, 5, 6, 7, 8, 9], 'Value2': [9, 8, 7, 6, 5, 4, 3, 2, 1]}
df = pd.DataFrame(data)

# Group data, filter groups with more than 2 elements, and calculate correlation
grouped = df.groupby('Group').filter(lambda x: len(x) > 2).groupby('Group').corr()
print(grouped)
Output:
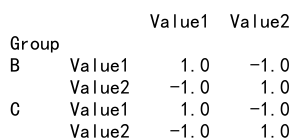
In some cases, you might want to calculate correlations only for groups that meet certain criteria, such as having more than a specific number of elements. This example demonstrates how to filter groups based on their size before calculating correlations.
Example 7: Visualizing Correlation Matrices
import pandas as pd
import seaborn as sns
import matplotlib.pyplot as plt

# Create a DataFrame
data = {'Group': ['A', 'A', 'B', 'B', 'C', 'C'], 'Value1': [1, 2, 3, 4, 5, 6], 'Value2': [6, 5, 4, 3, 2, 1]}
df = pd.DataFrame(data)

# Group data and calculate correlation
grouped = df.groupby('Group').corr()

# Loop through groups and plot correlation matrix
for name, group in grouped.groupby(level=0):
    plt.figure()
    sns.heatmap(group, annot=True)
    plt.title(f'Correlation Matrix for Group {name}')
    plt.show()
Output:
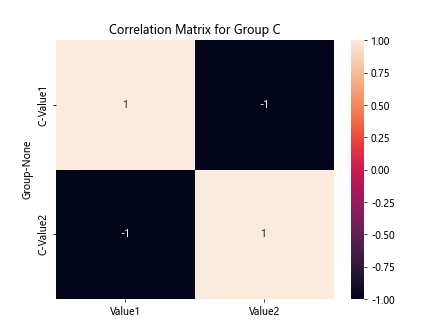
Visualizing the correlation matrix can provide insights that are not immediately obvious from the numbers alone. This example uses the Seaborn library to create a heatmap of the correlation matrix for each group.
Pandas Correlation by Group Conclusion
Group-specific correlation analysis is a powerful tool in exploratory data analysis, allowing you to understand relationships within subsets of your data. By using Pandas’ grouping and correlation functions, you can efficiently compute and analyze these relationships. Whether you are dealing with simple or complex datasets, the flexibility of Pandas ensures that you can tailor your analysis to meet your specific needs.
 Pandas Dataframe