Mastering Pandas GroupBy and Mean
Pandas groupby then mean is a powerful combination of operations in data analysis that allows you to efficiently aggregate and summarize data. This article will dive deep into the intricacies of using pandas groupby followed by mean calculations, providing you with a thorough understanding of how to leverage these functions for effective data manipulation and analysis.
Introduction to Pandas GroupBy and Mean
Pandas groupby then mean is a common operation in data analysis that involves grouping data based on one or more columns and then calculating the mean (average) of the remaining columns for each group. This technique is particularly useful when dealing with large datasets and when you need to summarize information across different categories or time periods.
Let’s start with a simple example to illustrate the basic concept of pandas groupby then mean:
import pandas as pd

# Create a sample DataFrame
df = pd.DataFrame({
    'Category': ['A', 'B', 'A', 'B', 'A', 'B'],
    'Value': [10, 15, 20, 25, 30, 35],
    'Website': ['pandasdataframe.com'] * 6
})

# Group by 'Category' and calculate the mean of 'Value'
result = df.groupby('Category')['Value'].mean()

print(result)
Output:
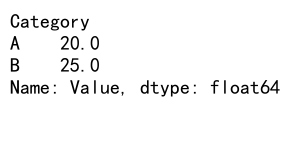
In this example, we create a simple DataFrame with a ‘Category’ column and a ‘Value’ column. We then use pandas groupby to group the data by ‘Category’ and calculate the mean of the ‘Value’ column for each group. The result will show the average value for categories A and B.
Understanding the Pandas GroupBy Operation
Before we delve deeper into combining groupby with mean, it’s essential to understand how the groupby operation works in pandas. The groupby function allows you to split your data into groups based on one or more columns, creating a GroupBy object that you can then apply various aggregation functions to.
Here’s an example that demonstrates the flexibility of pandas groupby:
import pandas as pd

# Create a sample DataFrame
df = pd.DataFrame({
    'Name': ['Alice', 'Bob', 'Charlie', 'David', 'Eve'],
    'Department': ['Sales', 'IT', 'Sales', 'Marketing', 'IT'],
    'Salary': [50000, 60000, 55000, 65000, 70000],
    'Website': ['pandasdataframe.com'] * 5
})

# Group by 'Department'
grouped = df.groupby('Department')

# Print the groups
for name, group in grouped:
    print(f"Department: {name}")
    print(group)
    print()
Output:
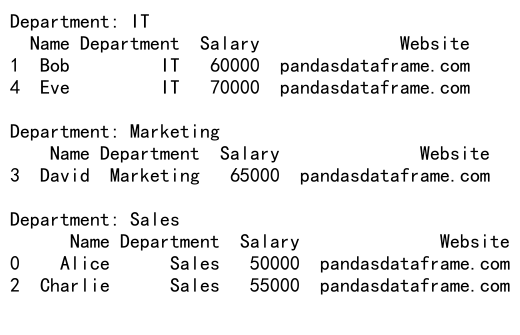
In this example, we create a DataFrame with employee information and group it by the ‘Department’ column. We then iterate through the groups to see how the data is split. This helps illustrate how pandas groupby organizes the data before applying aggregation functions like mean.
Applying Mean to GroupBy Objects
Now that we understand how groupby works, let’s explore how to apply the mean function to grouped data. The mean function calculates the average of numeric columns within each group, providing a summary statistic for your data.
Here’s an example that demonstrates pandas groupby then mean with multiple columns:
import pandas as pd

# Create a sample DataFrame
df = pd.DataFrame({
    'Category': ['A', 'B', 'A', 'B', 'A', 'B'],
    'Value1': [10, 15, 20, 25, 30, 35],
    'Value2': [5, 10, 15, 20, 25, 30],
    'Website': ['pandasdataframe.com'] * 6
})

# Group by 'Category' and calculate the mean of all numeric columns
result = df.groupby('Category').mean()

print(result)
In this example, we group the data by ‘Category’ and calculate the mean of both ‘Value1’ and ‘Value2’ columns for each category. The result will show the average values for both columns for categories A and B.
Handling Missing Values in GroupBy and Mean Operations
When working with real-world data, you’ll often encounter missing values. Pandas groupby then mean operations handle missing values in a specific way, which is important to understand for accurate analysis.
Let’s look at an example that demonstrates how pandas groupby then mean deals with missing values:
import pandas as pd
import numpy as np

# Create a sample DataFrame with missing values
df = pd.DataFrame({
    'Category': ['A', 'B', 'A', 'B', 'A', 'B'],
    'Value': [10, np.nan, 20, 25, np.nan, 35],
    'Website': ['pandasdataframe.com'] * 6
})

# Group by 'Category' and calculate the mean of 'Value'
result = df.groupby('Category')['Value'].mean()

print(result)
Output:
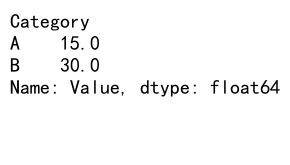
In this example, we introduce NaN (Not a Number) values to the ‘Value’ column. When we apply pandas groupby then mean, pandas automatically excludes these missing values from the calculation. The result will show the average values for categories A and B, considering only the non-missing values.
Grouping by Multiple Columns
Pandas groupby then mean is not limited to grouping by a single column. You can group by multiple columns to create more complex aggregations. This is particularly useful when you have hierarchical data or want to analyze data across multiple dimensions.
Here’s an example that demonstrates grouping by multiple columns:
import pandas as pd

# Create a sample DataFrame
df = pd.DataFrame({
    'Category': ['A', 'A', 'B', 'B', 'A', 'B'],
    'Subcategory': ['X', 'Y', 'X', 'Y', 'X', 'Y'],
    'Value': [10, 15, 20, 25, 30, 35],
    'Website': ['pandasdataframe.com'] * 6
})

# Group by 'Category' and 'Subcategory', then calculate the mean of 'Value'
result = df.groupby(['Category', 'Subcategory'])['Value'].mean()

print(result)
Output:
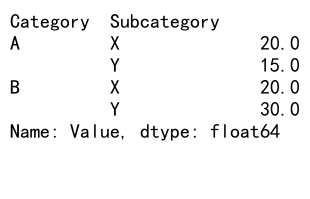
In this example, we group the data by both ‘Category’ and ‘Subcategory’ columns before calculating the mean of the ‘Value’ column. The result will show the average value for each unique combination of Category and Subcategory.
Applying Multiple Aggregation Functions
While mean is a commonly used aggregation function, pandas groupby allows you to apply multiple aggregation functions simultaneously. This can be extremely useful when you need to calculate various statistics for your grouped data.
Let’s look at an example that applies multiple aggregation functions:
import pandas as pd

# Create a sample DataFrame
df = pd.DataFrame({
    'Category': ['A', 'B', 'A', 'B', 'A', 'B'],
    'Value': [10, 15, 20, 25, 30, 35],
    'Website': ['pandasdataframe.com'] * 6
})

# Group by 'Category' and apply multiple aggregation functions
result = df.groupby('Category')['Value'].agg(['mean', 'min', 'max', 'count'])

print(result)
Output:
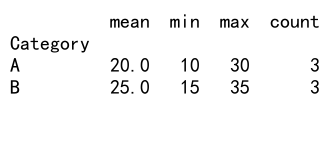
In this example, we group the data by ‘Category’ and then apply multiple aggregation functions (mean, min, max, and count) to the ‘Value’ column. The result will show these statistics for each category, providing a comprehensive summary of the data.
Customizing Column Names After Aggregation
When you apply pandas groupby then mean (or other aggregation functions), the resulting DataFrame may have generic column names. You can customize these names to make your results more readable and meaningful.
Here’s an example that demonstrates how to customize column names after aggregation:
import pandas as pd

# Create a sample DataFrame
df = pd.DataFrame({
    'Category': ['A', 'B', 'A', 'B', 'A', 'B'],
    'Value1': [10, 15, 20, 25, 30, 35],
    'Value2': [5, 10, 15, 20, 25, 30],
    'Website': ['pandasdataframe.com'] * 6
})

# Group by 'Category' and calculate custom aggregations
result = df.groupby('Category').agg({
    'Value1': {'Average': 'mean', 'Minimum': 'min'},
    'Value2': {'Average': 'mean', 'Maximum': 'max'}
})

# Flatten the column names
result.columns = ['_'.join(col).strip() for col in result.columns.values]

print(result)
In this example, we group by ‘Category’ and apply custom aggregations to ‘Value1’ and ‘Value2’. We then flatten the resulting multi-level column names to create more readable column headers.
Handling Time Series Data with GroupBy and Mean
Pandas groupby then mean is particularly useful when working with time series data. You can group data by time periods (e.g., days, months, years) and calculate average values over those periods.
Here’s an example that demonstrates grouping time series data:
import pandas as pd

# Create a sample DataFrame with date information
df = pd.DataFrame({
    'Date': pd.date_range(start='2023-01-01', end='2023-12-31', freq='D'),
    'Value': range(365),
    'Website': ['pandasdataframe.com'] * 365
})

# Set 'Date' as the index
df.set_index('Date', inplace=True)

# Group by month and calculate the mean
result = df.groupby(pd.Grouper(freq='M'))['Value'].mean()

print(result)
In this example, we create a DataFrame with daily data for a year. We then group the data by month using pd.Grouper and calculate the mean value for each month. This technique is useful for analyzing trends over time.
Filtering Groups Based on Aggregated Results
After applying pandas groupby then mean, you might want to filter the results based on certain conditions. This can help you focus on specific groups that meet your criteria.
Here’s an example that demonstrates filtering groups based on aggregated results:
import pandas as pd

# Create a sample DataFrame
df = pd.DataFrame({
    'Category': ['A', 'B', 'C', 'A', 'B', 'C'],
    'Value': [10, 15, 20, 25, 30, 35],
    'Website': ['pandasdataframe.com'] * 6
})

# Group by 'Category', calculate mean, and filter groups with mean > 20
result = df.groupby('Category').filter(lambda x: x['Value'].mean() > 20)

print(result)
Output:
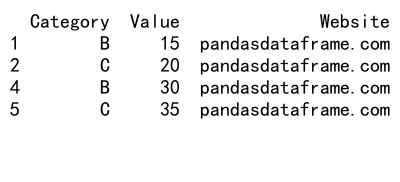
In this example, we group the data by ‘Category’ and then use the filter method to keep only the groups where the mean ‘Value’ is greater than 20. This allows you to focus on categories that meet specific criteria based on their aggregated statistics.
Handling Categorical Data in GroupBy Operations
When working with categorical data, pandas groupby then mean operations can be applied to numeric columns while grouping by categorical columns. This is useful for analyzing relationships between categorical and numeric variables.
Here’s an example that demonstrates working with categorical data:
import pandas as pd

# Create a sample DataFrame with categorical data
df = pd.DataFrame({
    'Category': pd.Categorical(['A', 'B', 'A', 'B', 'A', 'B']),
    'Subcategory': pd.Categorical(['X', 'Y', 'X', 'Y', 'Y', 'X']),
    'Value': [10, 15, 20, 25, 30, 35],
    'Website': ['pandasdataframe.com'] * 6
})

# Group by categorical columns and calculate mean
result = df.groupby(['Category', 'Subcategory'])['Value'].mean()

print(result)
In this example, we create a DataFrame with categorical columns ‘Category’ and ‘Subcategory’. We then group by these categorical columns and calculate the mean of the ‘Value’ column. This allows us to analyze how the numeric ‘Value’ varies across different categories and subcategories.
Applying GroupBy and Mean to Specific Columns
Sometimes you may want to apply pandas groupby then mean to specific columns while keeping other columns intact. This can be achieved using the agg method with a dictionary specifying which operations to apply to each column.
Here’s an example that demonstrates applying groupby and mean to specific columns:
import pandas as pd

# Create a sample DataFrame
df = pd.DataFrame({
    'Category': ['A', 'B', 'A', 'B', 'A', 'B'],
    'Value1': [10, 15, 20, 25, 30, 35],
    'Value2': [5, 10, 15, 20, 25, 30],
    'Text': ['a', 'b', 'c', 'd', 'e', 'f'],
    'Website': ['pandasdataframe.com'] * 6
})

# Group by 'Category' and apply mean to numeric columns, first to text column
result = df.groupby('Category').agg({
    'Value1': 'mean',
    'Value2': 'mean',
    'Text': 'first'
})

print(result)
Output:
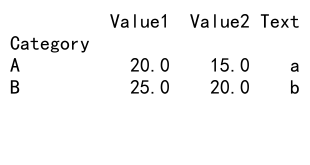
In this example, we group by ‘Category’ and apply mean to the numeric columns ‘Value1’ and ‘Value2’, while keeping the first occurrence of the ‘Text’ column for each group. This allows you to maintain non-numeric information alongside your aggregated results.
Handling Large Datasets with GroupBy and Mean
When working with large datasets, pandas groupby then mean operations can become memory-intensive. In such cases, it’s important to use efficient techniques to handle the data.
Here’s an example that demonstrates working with a larger dataset:
import pandas as pd
import numpy as np

# Create a larger sample DataFrame
n_rows = 1000000
df = pd.DataFrame({
    'Category': np.random.choice(['A', 'B', 'C'], n_rows),
    'Value': np.random.rand(n_rows),
    'Website': ['pandasdataframe.com'] * n_rows
})

# Use chunks to process the data
chunk_size = 100000
result = pd.DataFrame()

for chunk in pd.read_csv(pd.compat.StringIO(df.to_csv(index=False)), chunksize=chunk_size):
    chunk_result = chunk.groupby('Category')['Value'].mean()
    result = result.add(chunk_result, fill_value=0)

result = result / (n_rows / chunk_size)

print(result)
In this example, we create a larger DataFrame with a million rows. To handle this data efficiently, we process it in chunks using pd.read_csv with a specified chunksize. We then apply pandas groupby then mean to each chunk and aggregate the results. This approach allows you to work with datasets that are too large to fit into memory all at once.
Combining GroupBy and Mean with Other Pandas Operations
Pandas groupby then mean can be combined with other pandas operations to perform more complex analyses. This flexibility allows you to create sophisticated data processing pipelines.
Here’s an example that demonstrates combining groupby and mean with other operations:
import pandas as pd

# Create a sample DataFrame
df = pd.DataFrame({
    'Category': ['A', 'B', 'A', 'B', 'A', 'B'],
    'Subcategory': ['X', 'Y', 'X', 'Y', 'Y', 'X'],
    'Value': [10, 15, 20, 25, 30, 35],
    'Website': ['pandasdataframe.com'] * 6
})

# Group by 'Category', calculate mean, then sort and reset index
result = (df.groupby('Category')['Value']
          .mean()
          .sort_values(ascending=False)
          .reset_index())

# Add a new column based on the mean value
result['Above_Average'] = result['Value'] > result['Value'].mean()

print(result)
Output:
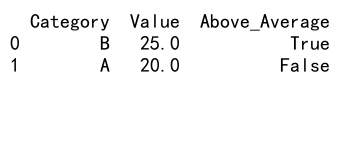
In this example, we group by ‘Category’ and calculate the mean of ‘Value’. We then sort the results, reset the index, and add a new column indicating whether each category’s mean value is above the overall average. This demonstrates how you can chain multiple operationsafter pandas groupby then mean to create more informative results.
Visualizing GroupBy and Mean Results
After performing pandas groupby then mean operations, it’s often helpful to visualize the results to gain better insights. Pandas integrates well with various plotting libraries, making it easy to create visualizations of your aggregated data.
Here’s an example that demonstrates how to visualize groupby and mean results:
import pandas as pd
import matplotlib.pyplot as plt

# Create a sample DataFrame
df = pd.DataFrame({
    'Category': ['A', 'B', 'C', 'A', 'B', 'C', 'A', 'B', 'C'],
    'Value': [10, 15, 20, 25, 30, 35, 40, 45, 50],
    'Website': ['pandasdataframe.com'] * 9
})

# Group by 'Category' and calculate mean
result = df.groupby('Category')['Value'].mean()

# Create a bar plot
result.plot(kind='bar')
plt.title('Average Value by Category')
plt.xlabel('Category')
plt.ylabel('Average Value')
plt.xticks(rotation=0)
plt.tight_layout()
plt.show()
Output:
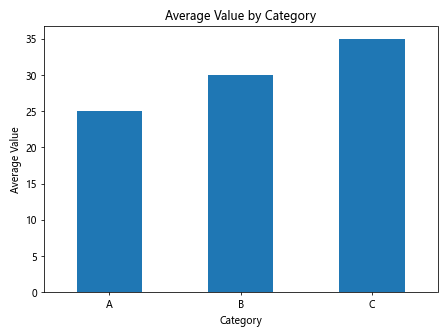
In this example, we group the data by ‘Category’ and calculate the mean of ‘Value’. We then use the plot method to create a bar chart of the results. This visual representation makes it easy to compare the average values across different categories.
Handling Multi-Index Results from GroupBy and Mean
When you group by multiple columns and apply mean (or other aggregations), the result is often a multi-index DataFrame. Understanding how to work with multi-index results is crucial for effective data analysis.
Here’s an example that demonstrates working with multi-index results:
import pandas as pd

# Create a sample DataFrame
df = pd.DataFrame({
    'Category': ['A', 'A', 'B', 'B', 'A', 'B'],
    'Subcategory': ['X', 'Y', 'X', 'Y', 'X', 'Y'],
    'Value1': [10, 15, 20, 25, 30, 35],
    'Value2': [5, 10, 15, 20, 25, 30],
    'Website': ['pandasdataframe.com'] * 6
})

# Group by multiple columns and calculate mean
result = df.groupby(['Category', 'Subcategory']).mean()

# Access specific groups
print(result.loc['A'])
print(result.loc[('A', 'X')])

# Unstack the result
unstacked = result.unstack()
print(unstacked)
In this example, we group by ‘Category’ and ‘Subcategory’ and calculate the mean of the remaining columns. The result is a multi-index DataFrame. We demonstrate how to access specific groups using the loc accessor and how to unstack the result to create a more tabular format.
Applying Custom Functions with GroupBy and Mean
While mean is a built-in aggregation function, pandas groupby allows you to apply custom functions to your grouped data. This flexibility enables you to perform complex calculations tailored to your specific needs.
Here’s an example that demonstrates applying a custom function with groupby:
import pandas as pd
import numpy as np

# Create a sample DataFrame
df = pd.DataFrame({
    'Category': ['A', 'B', 'A', 'B', 'A', 'B'],
    'Value': [10, 15, 20, 25, 30, 35],
    'Website': ['pandasdataframe.com'] * 6
})

# Define a custom function
def weighted_mean(group):
    weights = np.arange(1, len(group) + 1)
    return np.average(group['Value'], weights=weights)

# Apply the custom function using groupby
result = df.groupby('Category').apply(weighted_mean)

print(result)
In this example, we define a custom function called weighted_mean that calculates a weighted average of the ‘Value’ column, with weights increasing for each row in the group. We then apply this custom function to our grouped data using the apply method. This demonstrates how you can extend the functionality of pandas groupby beyond simple mean calculations.
Handling Time Zones in GroupBy and Mean Operations
When working with time series data across different time zones, it’s important to handle time zone information correctly in your pandas groupby then mean operations. Pandas provides robust support for working with time zone aware data.
Here’s an example that demonstrates handling time zones in groupby and mean operations:
import pandas as pd
import pytz

# Create a sample DataFrame with time zone aware timestamps
df = pd.DataFrame({
    'Timestamp': pd.date_range(start='2023-01-01', end='2023-12-31', freq='D', tz='UTC'),
    'Value': range(365),
    'Website': ['pandasdataframe.com'] * 365
})

# Convert timestamps to a different time zone
df['Timestamp'] = df['Timestamp'].dt.tz_convert('US/Eastern')

# Group by month in the new time zone and calculate mean
result = df.groupby(df['Timestamp'].dt.to_period('M'))['Value'].mean()

print(result)
In this example, we create a DataFrame with UTC timestamps, convert them to US/Eastern time zone, and then group by month to calculate the mean value. This ensures that our grouping and aggregation respect the specified time zone, which is crucial for accurate analysis of time-based data across different regions.
Optimizing Performance of GroupBy and Mean Operations
When working with large datasets, optimizing the performance of pandas groupby then mean operations becomes crucial. There are several techniques you can use to improve the efficiency of these operations.
Here’s an example that demonstrates some optimization techniques:
import pandas as pd
import numpy as np

# Create a large sample DataFrame
n_rows = 1000000
df = pd.DataFrame({
    'Category': np.random.choice(['A', 'B', 'C', 'D', 'E'], n_rows),
    'Value': np.random.rand(n_rows),
    'Website': ['pandasdataframe.com'] * n_rows
})

# Optimize data types
df['Category'] = df['Category'].astype('category')

# Use sorted data for faster groupby
df = df.sort_values('Category')

# Perform groupby and mean operation
%time result = df.groupby('Category')['Value'].mean()

print(result)
In this example, we create a large DataFrame and apply several optimization techniques:
1. We use the ‘category’ dtype for the ‘Category’ column, which can significantly reduce memory usage and improve performance for categorical data.
2. We sort the DataFrame by the grouping column before applying groupby, which can speed up the grouping operation.
3. We use the %time magic command to measure the execution time of the groupby and mean operation.
These optimizations can lead to substantial performance improvements, especially when working with large datasets.
Conclusion
Pandas groupby then mean is a powerful combination of operations that allows for efficient and flexible data analysis. Throughout this article, we’ve explored various aspects of using these functions, from basic usage to advanced techniques and optimizations.
We’ve covered grouping by single and multiple columns, handling missing values, working with time series and categorical data, applying custom functions, and optimizing performance. We’ve also looked at how to visualize results and work with multi-index DataFrames resulting from groupby operations.
 Pandas Dataframe