Mastering Pandas GroupBy Transform
Pandas groupby transform is a powerful feature in the pandas library that allows for efficient and flexible data manipulation on grouped data. This article will explore the various aspects of pandas groupby transform, providing detailed explanations and practical examples to help you master this essential tool for data analysis and transformation.
Introduction to Pandas GroupBy Transform
Pandas groupby transform is a method that combines the functionality of groupby operations with transformation functions. It allows you to apply functions to groups of data and return a result with the same shape as the input, making it ideal for various data manipulation tasks. The pandas groupby transform operation is particularly useful when you need to perform calculations on grouped data while maintaining the original structure of your DataFrame.
Let’s start with a simple example to illustrate the basic concept of pandas groupby transform:
import pandas as pd

# Create a sample DataFrame
df = pd.DataFrame({
    'category': ['A', 'B', 'A', 'B', 'A', 'B'],
    'value': [10, 20, 15, 25, 5, 30],
    'name': ['pandasdataframe.com_1', 'pandasdataframe.com_2', 'pandasdataframe.com_3',
             'pandasdataframe.com_4', 'pandasdataframe.com_5', 'pandasdataframe.com_6']
})

# Apply groupby transform to calculate the mean value for each category
df['category_mean'] = df.groupby('category')['value'].transform('mean')

print(df)
Output:
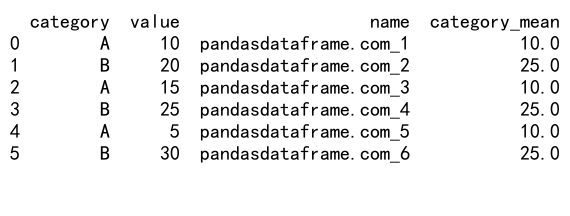
In this example, we create a simple DataFrame with categories, values, and names. We then use pandas groupby transform to calculate the mean value for each category and add it as a new column to the DataFrame. The transform method applies the ‘mean’ function to each group, and the result is broadcast back to the original DataFrame shape.
Understanding the Syntax of Pandas GroupBy Transform
The general syntax for using pandas groupby transform is as follows:
df['new_column'] = df.groupby('group_column')['value_column'].transform(function)
Here’s a breakdown of the components:
df: The input DataFrame'new_column': The name of the new column to be created'group_column': The column used for grouping'value_column': The column containing the values to be transformedtransform(function): The transform method applied to the grouped data, with the specified function
The function parameter can be a string representing a built-in function (e.g., ‘mean’, ‘sum’, ‘count’), a custom function, or a lambda function.
Let’s look at an example using a custom function with pandas groupby transform:
import pandas as pd

# Create a sample DataFrame
df = pd.DataFrame({
    'category': ['A', 'B', 'A', 'B', 'A', 'B'],
    'value': [10, 20, 15, 25, 5, 30],
    'name': ['pandasdataframe.com_1', 'pandasdataframe.com_2', 'pandasdataframe.com_3',
             'pandasdataframe.com_4', 'pandasdataframe.com_5', 'pandasdataframe.com_6']
})

# Define a custom function to calculate the percentage of the group sum
def percent_of_group_sum(x):
    return x / x.sum() * 100

# Apply groupby transform with the custom function
df['percent_of_category'] = df.groupby('category')['value'].transform(percent_of_group_sum)

print(df)
Output:
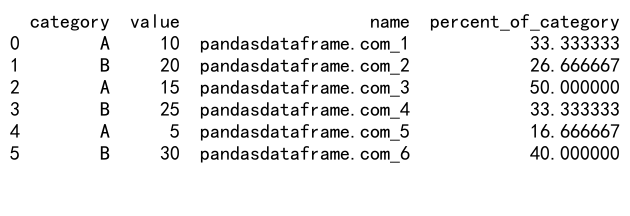
In this example, we define a custom function percent_of_group_sum that calculates the percentage of each value relative to the group sum. We then use pandas groupby transform to apply this function to our DataFrame, creating a new column ‘percent_of_category’ that shows the percentage contribution of each value within its category.
Common Use Cases for Pandas GroupBy Transform
Pandas groupby transform is versatile and can be applied to various data manipulation tasks. Here are some common use cases:
1. Calculating Group Statistics
One of the most frequent uses of pandas groupby transform is to calculate group statistics such as mean, median, sum, or count. These statistics can be easily added to the original DataFrame without changing its structure.
import pandas as pd

# Create a sample DataFrame
df = pd.DataFrame({
    'department': ['Sales', 'HR', 'Sales', 'IT', 'HR', 'IT'],
    'salary': [50000, 60000, 55000, 70000, 65000, 75000],
    'name': ['pandasdataframe.com_1', 'pandasdataframe.com_2', 'pandasdataframe.com_3',
             'pandasdataframe.com_4', 'pandasdataframe.com_5', 'pandasdataframe.com_6']
})

# Calculate various group statistics
df['dept_mean_salary'] = df.groupby('department')['salary'].transform('mean')
df['dept_median_salary'] = df.groupby('department')['salary'].transform('median')
df['dept_total_salary'] = df.groupby('department')['salary'].transform('sum')
df['dept_employee_count'] = df.groupby('department')['salary'].transform('count')

print(df)
Output:
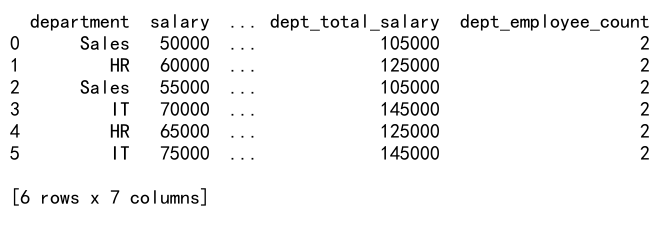
In this example, we use pandas groupby transform to calculate the mean, median, sum, and count of salaries for each department. These statistics are added as new columns to the DataFrame, providing valuable insights into the salary distribution across departments.
2. Ranking Within Groups
Pandas groupby transform can be used to rank values within groups, which is useful for identifying top performers or outliers within categories.
import pandas as pd

# Create a sample DataFrame
df = pd.DataFrame({
    'product': ['A', 'B', 'A', 'B', 'A', 'B'],
    'sales': [100, 150, 120, 180, 90, 200],
    'store': ['pandasdataframe.com_1', 'pandasdataframe.com_2', 'pandasdataframe.com_3',
              'pandasdataframe.com_4', 'pandasdataframe.com_5', 'pandasdataframe.com_6']
})

# Rank sales within each product group
df['sales_rank'] = df.groupby('product')['sales'].transform(lambda x: x.rank(ascending=False))

print(df)
Output:
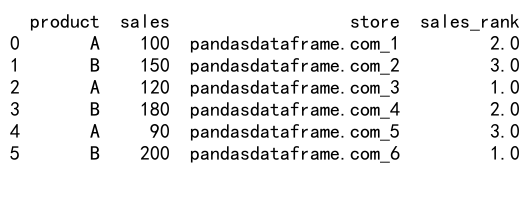
In this example, we use pandas groupby transform with a lambda function to rank sales within each product group. The rank is calculated in descending order, so the highest sales value gets rank 1.
3. Calculating Cumulative Statistics
Pandas groupby transform is excellent for calculating cumulative statistics within groups, such as cumulative sum or cumulative count.
import pandas as pd

# Create a sample DataFrame
df = pd.DataFrame({
    'date': pd.date_range(start='2023-01-01', periods=6),
    'category': ['A', 'B', 'A', 'B', 'A', 'B'],
    'sales': [100, 150, 120, 180, 90, 200],
    'store': ['pandasdataframe.com_1', 'pandasdataframe.com_2', 'pandasdataframe.com_3',
              'pandasdataframe.com_4', 'pandasdataframe.com_5', 'pandasdataframe.com_6']
})

# Calculate cumulative sales within each category
df['cumulative_sales'] = df.groupby('category')['sales'].transform(pd.Series.cumsum)

print(df)
Output:

In this example, we use pandas groupby transform with the pd.Series.cumsum function to calculate the cumulative sales within each category. This is particularly useful for tracking progress over time or analyzing trends within groups.
4. Calculating Percentages or Proportions
Pandas groupby transform can be used to calculate percentages or proportions within groups, which is useful for understanding the relative contribution of each item to the group total.
import pandas as pd

# Create a sample DataFrame
df = pd.DataFrame({
    'category': ['A', 'B', 'A', 'B', 'A', 'B'],
    'value': [10, 20, 15, 25, 5, 30],
    'name': ['pandasdataframe.com_1', 'pandasdataframe.com_2', 'pandasdataframe.com_3',
             'pandasdataframe.com_4', 'pandasdataframe.com_5', 'pandasdataframe.com_6']
})

# Calculate percentage of total within each category
df['percent_of_category'] = df.groupby('category')['value'].transform(lambda x: x / x.sum() * 100)

print(df)
Output:
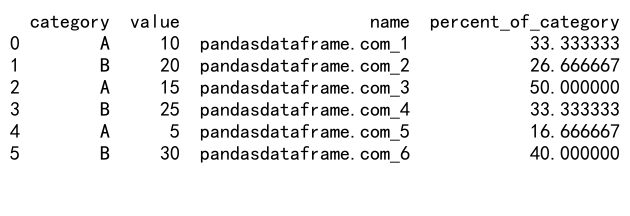
In this example, we use pandas groupby transform with a lambda function to calculate the percentage of each value relative to the total within its category. This is useful for understanding the distribution of values within groups.
Advanced Techniques with Pandas GroupBy Transform
While the basic usage of pandas groupby transform is straightforward, there are several advanced techniques that can enhance its power and flexibility. Let’s explore some of these techniques:
1. Using Multiple Columns for Grouping
Pandas groupby transform allows you to group by multiple columns, enabling more complex aggregations and transformations.
import pandas as pd

# Create a sample DataFrame
df = pd.DataFrame({
    'category': ['A', 'B', 'A', 'B', 'A', 'B'],
    'subcategory': ['X', 'Y', 'X', 'Y', 'Z', 'Z'],
    'value': [10, 20, 15, 25, 5, 30],
    'name': ['pandasdataframe.com_1', 'pandasdataframe.com_2', 'pandasdataframe.com_3',
             'pandasdataframe.com_4', 'pandasdataframe.com_5', 'pandasdataframe.com_6']
})

# Calculate mean value for each category-subcategory combination
df['group_mean'] = df.groupby(['category', 'subcategory'])['value'].transform('mean')

print(df)
Output:

In this example, we group the DataFrame by both ‘category’ and ‘subcategory’ columns before applying the transform method. This allows us to calculate the mean value for each unique combination of category and subcategory.
2. Applying Multiple Transformations
You can apply multiple transformations in a single pandas groupby transform operation by using a dictionary of functions.
import pandas as pd

# Create a sample DataFrame
df = pd.DataFrame({
    'category': ['A', 'B', 'A', 'B', 'A', 'B'],
    'value': [10, 20, 15, 25, 5, 30],
    'name': ['pandasdataframe.com_1', 'pandasdataframe.com_2', 'pandasdataframe.com_3',
             'pandasdataframe.com_4', 'pandasdataframe.com_5', 'pandasdataframe.com_6']
})

# Apply multiple transformations
transformations = {
    'mean': 'mean',
    'max': 'max',
    'min': 'min',
    'range': lambda x: x.max() - x.min()
}

result = df.groupby('category')['value'].transform(transformations)
df = pd.concat([df, result], axis=1)

print(df)
In this example, we define a dictionary of transformations, including built-in functions and a custom lambda function. We then apply these transformations using pandas groupby transform and concatenate the results with the original DataFrame.
3. Using Window Functions
Pandas groupby transform can be combined with window functions to perform rolling calculations within groups.
import pandas as pd

# Create a sample DataFrame
df = pd.DataFrame({
    'date': pd.date_range(start='2023-01-01', periods=10),
    'category': ['A', 'B'] * 5,
    'value': [10, 20, 15, 25, 5, 30, 12, 18, 8, 22],
    'name': [f'pandasdataframe.com_{i}' for i in range(1, 11)]
})

# Calculate 3-day rolling average within each category
df['rolling_avg'] = df.groupby('category')['value'].transform(lambda x: x.rolling(window=3, min_periods=1).mean())

print(df)
Output:
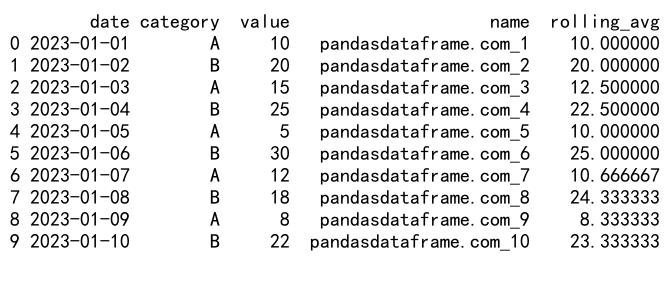
In this example, we use pandas groupby transform with a lambda function that applies a rolling average calculation to each group. This allows us to calculate a 3-day rolling average of values within each category.
4. Handling Missing Values
Pandas groupby transform can be used to handle missing values within groups by filling them with group-specific values.
import pandas as pd
import numpy as np

# Create a sample DataFrame with missing values
df = pd.DataFrame({
    'category': ['A', 'B', 'A', 'B', 'A', 'B'],
    'value': [10, np.nan, 15, 25, np.nan, 30],
    'name': ['pandasdataframe.com_1', 'pandasdataframe.com_2', 'pandasdataframe.com_3',
             'pandasdataframe.com_4', 'pandasdataframe.com_5', 'pandasdataframe.com_6']
})

# Fill missing values with group mean
df['filled_value'] = df.groupby('category')['value'].transform(lambda x: x.fillna(x.mean()))

print(df)
Output:
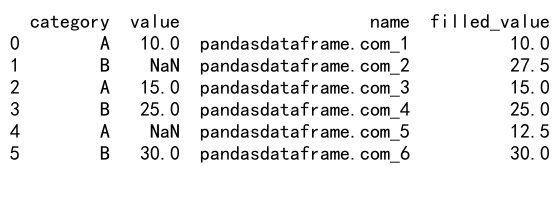
In this example, we use pandas groupby transform with a lambda function to fill missing values (NaN) with the mean value of their respective category. This approach allows for more intelligent handling of missing data based on group characteristics.
Best Practices and Performance Considerations
When working with pandas groupby transform, it’s important to keep in mind some best practices and performance considerations to ensure efficient and effective data manipulation:
- Use built-in functions when possible: Built-in functions like ‘mean’, ‘sum’, ‘count’, etc., are optimized for performance and should be used instead of custom functions when applicable.
-
Avoid unnecessary computations: If you only need to transform a subset of columns, specify those columns explicitly in the groupby operation to avoid unnecessary computations on other columns.
-
Consider using
aggfor multiple operations: If you need to perform multiple aggregations, consider using theaggmethod instead of multiple transform operations, as it can be more efficient. -
Be mindful of memory usage: For large datasets, pandas groupby transform operations can consume significant memory. Consider using chunking or iterating over groups for very large datasets.
-
Use appropriate data types: Ensure that your columns have appropriate data types (e.g., numeric types for numerical operations) to avoid type conversion overhead during groupby transform operations.
-
Leverage vectorized operations: When writing custom functions for transform, try to use vectorized operations (e.g., NumPy functions) instead of iterating over rows for better performance.
Here’s an example demonstrating some of these best practices:
import pandas as pd
import numpy as np

# Create a larger sample DataFrame
np.random.seed(42)
df = pd.DataFrame({
    'category': np.random.choice(['A', 'B', 'C'], size=100000),
    'value1': np.random.randn(100000),
    'value2': np.random.randn(100000),
    'name': [f'pandasdataframe.com_{i}' for i in range(100000)]
})

# Efficient groupby transform operation
result = df.groupby('category')[['value1', 'value2']].transform({
    'value1_mean': 'mean',
    'value1_sum': 'sum',
    'value2_median': 'median',
    'value2_std': 'std'
})

df = pd.concat([df, result], axis=1)

print(df.head())
In this example, we create a larger DataFrame and demonstrate efficient use of pandas groupby transform by:
- Specifying only the columns we need to transform (‘value1’ and ‘value2’)
- Using built-in functions for transformations
- Performing multiple transformations in a single operation
- Using appropriate data types (float for numerical values)
These practices help ensure that the pandas groupby transform operation is as efficient as possible, even with larger datasets.
Common Pitfalls and How to Avoid Them
While pandas groupby transform is a powerful tool, there are some common pitfalls that users may encounter. Here are some of these pitfalls and how to avoid them:
1. Incorrect Group Keys
One common mistake is using incorrect or mismatched group keys, which can lead to unexpected results or errors.
import pandas as pd

# Create a sample DataFrame
df = pd.DataFrame({
    'category': ['A', 'B', 'A', 'B', 'A', 'B'],
    'value': [10, 20, 15, 25, 5, 30],
    'name': ['pandasdataframe.com_1', 'pandasdataframe.com_2', 'pandasdataframe.com_3',
             'pandasdataframe.com_4', 'pandasdataframe.com_5', 'pandasdataframe.com_6']
})

# Incorrect: Using a non-existent column as group key
try:
    df['group_mean'] = df.groupby('non_existent_column')['value'].transform('mean')
except KeyError as e:
    print(f"Error: {e}")

# Correct: Using the proper column name as group key
df['group_mean'] = df.groupby('category')['value'].transform('mean')

print(df)
Output:
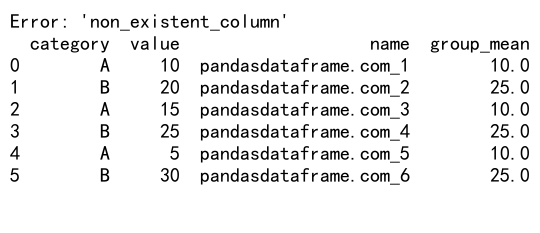
To avoid this pitfall, always double-check your group keys and ensure they exist in your DataFrame before applying pandas groupby transform.
2. Returning Incorrect Shapes
When using custom functions with pandas groupby transform, it’s crucial to ensure that the function returns a result with the same shape as the input. Failing to do so can lead to errors or unexpected results.
import pandas as pd

# Create a sample DataFrame
df = pd.DataFrame({
    'category': ['A', 'B', 'A', 'B', 'A', 'B'],
    'value': [10, 20, 15, 25, 5, 30],
    'name': ['pandasdataframe.com_1', 'pandasdataframe.com_2', 'pandasdataframe.com_3',
             'pandasdataframe.com_4', 'pandasdataframe.com_5', 'pandasdataframe.com_6']
})

# Incorrect: Function returns a single value instead of a Series
def incorrect_transform(x):
    return x.mean()

try:
    df['incorrect_result'] = df.groupby('category')['value'].transform(incorrect_transform)
except ValueError as e:
    print(f"Error: {e}")

# Correct: Function returns a Series with the same shape as the input
def correct_transform(x):
    return pd.Series([x.mean()] * len(x), index=x.index)

df['correct_result'] = df.groupby('category')['value'].transform(correct_transform)

print(df)
Output:

To avoid this pitfall, ensure that your custom functions return a Series or array with the same length as the input group.
3. Ignoring Data Types
Ignoring data types can lead to unexpected results or errors when using pandas groupby transform, especially with numerical operations.
import pandas as pd

# Create a sample DataFrame with mixed data types
df = pd.DataFrame({
    'category': ['A', 'B', 'A', 'B', 'A', 'B'],
    'value': ['10', '20', '15', '25', '5', '30'],  # String values
    'name': ['pandasdataframe.com_1', 'pandasdataframe.com_2', 'pandasdataframe.com_3',
             'pandasdataframe.com_4', 'pandasdataframe.com_5', 'pandasdataframe.com_6']
})

# Incorrect: Attempting numerical operation on string values
try:
    df['incorrect_mean'] = df.groupby('category')['value'].transform('mean')
except TypeError as e:
    print(f"Error: {e}")

# Correct: Convert to appropriate data type before transformation
df['value'] = pd.to_numeric(df['value'])
df['correct_mean'] = df.groupby('category')['value'].transform('mean')

print(df)
Output:
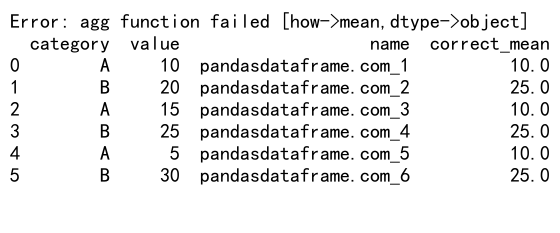
To avoid this pitfall, always ensure that your data is of the appropriate type before applying pandas groupby transform operations. Use functions like pd.to_numeric(), pd.to_datetime(), or astype() to convert data types when necessary.
Comparing Pandas GroupBy Transform with Other GroupBy Methods
While pandas groupby transform is a powerful tool, it’s important to understand how it compares to other groupby methods in pandas. Let’s compare pandas groupby transform with groupby().agg() and groupby().apply():
1. GroupBy Transform vs. GroupBy Aggregate
The main difference between pandas groupby transform and groupby aggregate is that transform returns a result with the same shape as the input, while aggregate returns a reduced result.
import pandas as pd

# Create a sample DataFrame
df = pd.DataFrame({
    'category': ['A', 'B', 'A', 'B', 'A', 'B'],
    'value': [10, 20, 15, 25, 5, 30],
    'name': ['pandasdataframe.com_1', 'pandasdataframe.com_2', 'pandasdataframe.com_3',
             'pandasdataframe.com_4', 'pandasdataframe.com_5', 'pandasdataframe.com_6']
})

# Using groupby transform
df['transform_mean'] = df.groupby('category')['value'].transform('mean')

# Using groupby aggregate
agg_result = df.groupby('category')['value'].agg('mean')

print("Transform result:")
print(df)
print("\nAggregate result:")
print(agg_result)
Output:
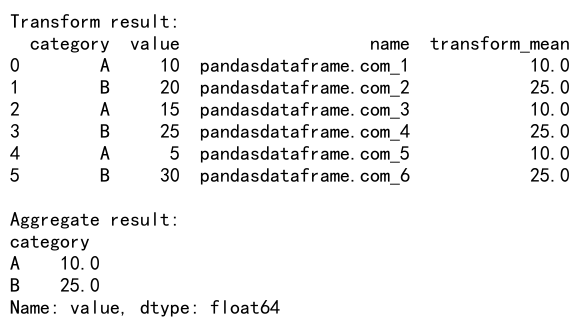
In this example, the transform operation adds a new column to the original DataFrame with the mean value for each category, while the aggregate operation returns a Series with one mean value per category.
2. GroupBy Transform vs. GroupBy Apply
The main difference between pandas groupby transform and groupby apply is that transform is more restrictive but generally more efficient, while apply is more flexible but can be slower for large datasets.
import pandas as pd

# Create a sample DataFrame
df = pd.DataFrame({
    'category': ['A', 'B', 'A', 'B', 'A', 'B'],
    'value': [10, 20, 15, 25, 5, 30],
    'name': ['pandasdataframe.com_1', 'pandasdataframe.com_2', 'pandasdataframe.com_3',
             'pandasdataframe.com_4', 'pandasdataframe.com_5', 'pandasdataframe.com_6']
})

# Using groupby transform
df['transform_result'] = df.groupby('category')['value'].transform(lambda x: x - x.mean())

# Using groupby apply
df['apply_result'] = df.groupby('category')['value'].apply(lambda x: x - x.mean())

print(df)
In this example, both transform and apply are used to calculate the difference from the group mean. The results are identical, but transform is generally faster for this type of operation, especially on larger datasets.
Real-world Applications of Pandas GroupBy Transform
Pandas groupby transform has numerous real-world applications across various industries and data analysis tasks. Here are some examples:
1. Financial Analysis
In financial analysis, pandas groupby transform can be used to calculate rolling averages, cumulative returns, or risk metrics for different asset classes or time periods.
import pandas as pd
import numpy as np

# Create a sample financial DataFrame
np.random.seed(42)
df = pd.DataFrame({
    'date': pd.date_range(start='2023-01-01', periods=100),
    'asset': np.random.choice(['Stock', 'Bond', 'Commodity'], size=100),
    'return': np.random.randn(100) * 0.01,
    'name': [f'pandasdataframe.com_{i}' for i in range(100)]
})

# Calculate cumulative returns for each asset
df['cumulative_return'] = df.groupby('asset')['return'].transform(lambda x: (1 + x).cumprod() - 1)

# Calculate 10-day rolling volatility for each asset
df['rolling_volatility'] = df.groupby('asset')['return'].transform(lambda x: x.rolling(window=10).std())

print(df.head(10))
Output:
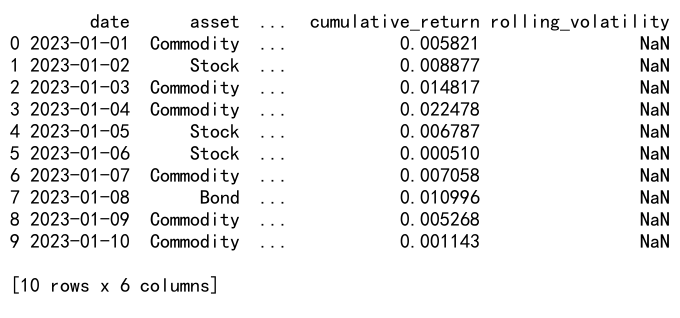
In this example, we use pandas groupby transform to calculate cumulative returns and rolling volatility for different asset classes, which are common metrics used in financial analysis and risk management.
2. Sales Analysis
In sales analysis, pandas groupby transform can be used to calculate market share, year-over-year growth, or sales rankings within product categories.
import pandas as pd
import numpy as np

# Create a sample sales DataFrame
np.random.seed(42)
df = pd.DataFrame({
    'date': pd.date_range(start='2023-01-01', periods=100),
    'product': np.random.choice(['A', 'B', 'C'], size=100),
    'sales': np.random.randint(100, 1000, size=100),
    'store': [f'pandasdataframe.com_{i}' for i in range(100)]
})

# Calculate market share within each date
df['market_share'] = df.groupby('date')['sales'].transform(lambda x: x / x.sum() * 100)

# Calculate sales rank within each product category
df['sales_rank'] = df.groupby('product')['sales'].transform(lambda x: x.rank(ascending=False))

print(df.head(10))
Output:
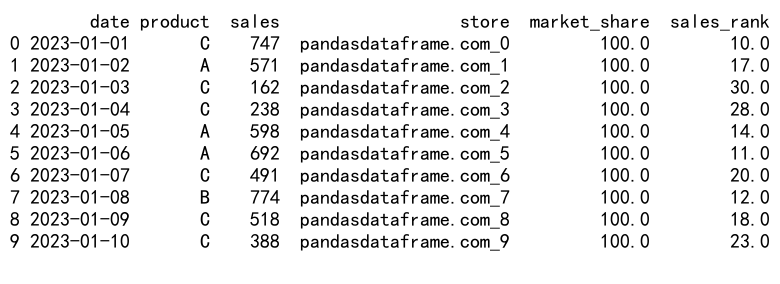
In this example, we use pandas groupby transform to calculate market share for each product on each date and sales rankings within product categories, providing valuable insights for sales analysis.
3. Customer Segmentation
In customer segmentation analysis, pandas groupby transform can be used to calculate customer-specific metrics or compare individual customers to their segment averages.
import pandas as pd
import numpy as np

# Create a sample customer DataFrame
np.random.seed(42)
df = pd.DataFrame({
    'customer_id': range(1000),
    'segment': np.random.choice(['High', 'Medium', 'Low'], size=1000),
    'spending': np.random.randint(100, 1000, size=1000),
    'name': [f'pandasdataframe.com_{i}' for i in range(1000)]
})

# Calculate average spending for each segment
df['segment_avg_spending'] = df.groupby('segment')['spending'].transform('mean')

# Calculate customer spending relative to segment average
df['relative_spending'] = df['spending'] / df['segment_avg_spending']

print(df.head(10))
Output:
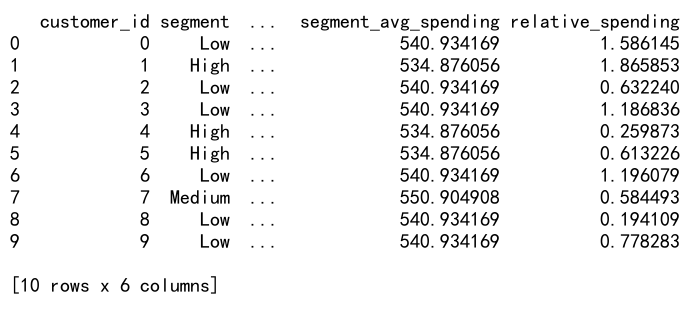
In this example, we use pandas groupby transform to calculate average spending for each customer segment and then compute each customer’s spending relative to their segment average, which can be useful for identifying high-value customers within each segment.
Conclusion
Pandas groupby transform is a powerful and versatile tool for data manipulation and analysis in Python. Its ability to perform group-wise calculations while maintaining the original DataFrame structure makes it invaluable for a wide range of data processing tasks.
 Pandas Dataframe