Mastering Pandas GroupBy with Two Columns
Pandas groupby two columns is a powerful technique for data analysis and manipulation in Python. This article will explore the various aspects of using pandas groupby with two columns, providing detailed explanations and practical examples to help you master this essential feature of the pandas library.
Introduction to Pandas GroupBy with Two Columns
Pandas groupby two columns is a method that allows you to group data in a DataFrame based on the values in two specified columns. This operation is particularly useful when you want to analyze or aggregate data across multiple dimensions or categories. By grouping data using two columns, you can uncover more complex patterns and relationships within your dataset.
Let’s start with a simple example to illustrate the basic concept of pandas groupby two columns:
import pandas as pd

# Create a sample DataFrame
df = pd.DataFrame({
    'Category': ['A', 'A', 'B', 'B', 'A', 'B'],
    'Subcategory': ['X', 'Y', 'X', 'Y', 'X', 'Y'],
    'Value': [10, 15, 20, 25, 30, 35]
})

# Group by two columns and calculate the mean
grouped = df.groupby(['Category', 'Subcategory'])['Value'].mean()

print("Grouped data:")
print(grouped)
Output:
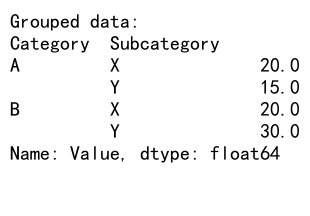
In this example, we create a DataFrame with three columns: ‘Category’, ‘Subcategory’, and ‘Value’. We then use pandas groupby two columns to group the data by both ‘Category’ and ‘Subcategory’, and calculate the mean of the ‘Value’ column for each group.
Understanding the Syntax of Pandas GroupBy with Two Columns
The basic syntax for using pandas groupby two columns is as follows:
grouped = df.groupby(['column1', 'column2'])
Here, ‘column1’ and ‘column2’ are the names of the columns you want to group by. You can then apply various aggregation functions or transformations to the grouped data.
Let’s look at a more detailed example to understand the syntax better:
import pandas as pd

# Create a sample DataFrame
df = pd.DataFrame({
    'Store': ['PandasDataFrame.com', 'PandasDataFrame.com', 'OtherStore', 'OtherStore'],
    'Product': ['A', 'B', 'A', 'B'],
    'Sales': [100, 150, 200, 250],
    'Quantity': [10, 15, 20, 25]
})

# Group by two columns and calculate multiple aggregations
grouped = df.groupby(['Store', 'Product']).agg({
    'Sales': 'sum',
    'Quantity': 'mean'
})

print("Grouped data with multiple aggregations:")
print(grouped)
Output:
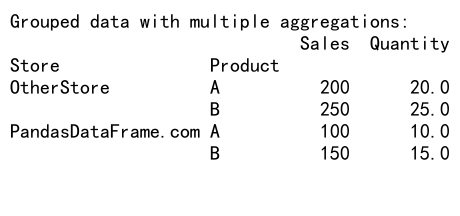
In this example, we group the DataFrame by ‘Store’ and ‘Product’ columns, then apply different aggregation functions to ‘Sales’ and ‘Quantity’ columns. The ‘sum’ function is applied to ‘Sales’, while the ‘mean’ function is applied to ‘Quantity’.
Common Aggregation Functions with Pandas GroupBy Two Columns
When using pandas groupby two columns, you can apply various aggregation functions to summarize the data within each group. Some common aggregation functions include:
- sum(): Calculate the sum of values
- mean(): Calculate the average of values
- count(): Count the number of non-null values
- min(): Find the minimum value
- max(): Find the maximum value
- median(): Calculate the median value
- std(): Calculate the standard deviation
- var(): Calculate the variance
Let’s see an example that demonstrates the use of multiple aggregation functions:
import pandas as pd

# Create a sample DataFrame
df = pd.DataFrame({
    'Region': ['PandasDataFrame.com', 'PandasDataFrame.com', 'OtherRegion', 'OtherRegion'],
    'Category': ['Electronics', 'Clothing', 'Electronics', 'Clothing'],
    'Sales': [1000, 1500, 2000, 2500],
    'Units': [50, 100, 150, 200]
})

# Group by two columns and apply multiple aggregation functions
grouped = df.groupby(['Region', 'Category']).agg({
    'Sales': ['sum', 'mean', 'max'],
    'Units': ['count', 'min', 'max']
})

print("Grouped data with multiple aggregation functions:")
print(grouped)
Output:
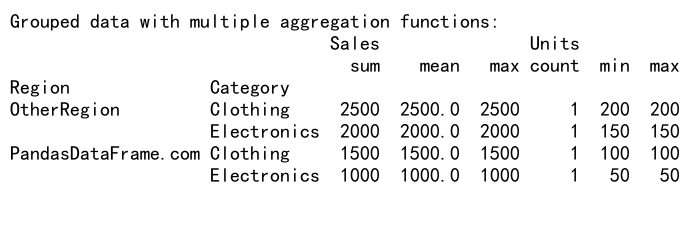
In this example, we group the DataFrame by ‘Region’ and ‘Category’ columns, then apply multiple aggregation functions to the ‘Sales’ and ‘Units’ columns. This provides a comprehensive summary of the data for each group.
Filtering Groups in Pandas GroupBy with Two Columns
Sometimes you may want to filter the groups based on certain conditions after performing a groupby operation. Pandas provides the filter() method for this purpose. Here’s an example:
import pandas as pd

# Create a sample DataFrame
df = pd.DataFrame({
    'Store': ['PandasDataFrame.com', 'PandasDataFrame.com', 'OtherStore', 'OtherStore'],
    'Product': ['A', 'B', 'A', 'B'],
    'Sales': [100, 150, 200, 250],
    'Quantity': [10, 15, 20, 25]
})

# Group by two columns and filter groups with total sales greater than 300
filtered = df.groupby(['Store', 'Product']).filter(lambda x: x['Sales'].sum() > 300)

print("Filtered grouped data:")
print(filtered)
Output:
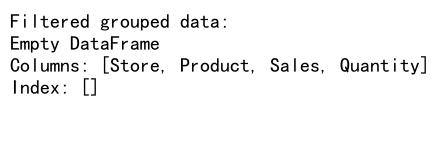
In this example, we group the DataFrame by ‘Store’ and ‘Product’ columns, then filter the groups to include only those with total sales greater than 300.
Transforming Data with Pandas GroupBy Two Columns
The transform() method allows you to apply a function to each group and broadcast the result back to the original DataFrame. This is useful for operations like normalization or calculating group-specific statistics. Here’s an example:
import pandas as pd

# Create a sample DataFrame
df = pd.DataFrame({
    'Category': ['PandasDataFrame.com', 'PandasDataFrame.com', 'OtherCategory', 'OtherCategory'],
    'Subcategory': ['X', 'Y', 'X', 'Y'],
    'Value': [10, 15, 20, 25]
})

# Group by two columns and transform the data
df['Normalized'] = df.groupby(['Category', 'Subcategory'])['Value'].transform(lambda x: (x - x.mean()) / x.std())

print("Transformed data:")
print(df)
Output:
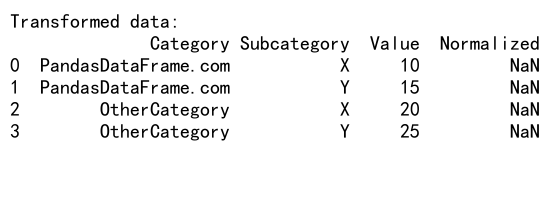
In this example, we group the DataFrame by ‘Category’ and ‘Subcategory’ columns, then use the transform() method to normalize the ‘Value’ column within each group.
Applying Custom Functions with Pandas GroupBy Two Columns
The apply() method allows you to use custom functions with pandas groupby two columns. This is particularly useful when you need to perform complex operations that aren’t covered by built-in aggregation functions. Here’s an example:
import pandas as pd

# Create a sample DataFrame
df = pd.DataFrame({
    'Store': ['PandasDataFrame.com', 'PandasDataFrame.com', 'OtherStore', 'OtherStore'],
    'Product': ['A', 'B', 'A', 'B'],
    'Sales': [100, 150, 200, 250],
    'Quantity': [10, 15, 20, 25]
})

# Define a custom function
def custom_agg(group):
    return pd.Series({
        'Total_Sales': group['Sales'].sum(),
        'Avg_Quantity': group['Quantity'].mean(),
        'Sales_per_Unit': group['Sales'].sum() / group['Quantity'].sum()
    })

# Group by two columns and apply the custom function
result = df.groupby(['Store', 'Product']).apply(custom_agg)

print("Result of custom aggregation:")
print(result)
In this example, we define a custom function custom_agg() that calculates total sales, average quantity, and sales per unit for each group. We then apply this function to the grouped data using the apply() method.
Handling Missing Values in Pandas GroupBy with Two Columns
When working with real-world data, you may encounter missing values. Pandas provides options to handle missing values when using groupby operations. Here’s an example:
import pandas as pd
import numpy as np

# Create a sample DataFrame with missing values
df = pd.DataFrame({
    'Category': ['PandasDataFrame.com', 'PandasDataFrame.com', 'OtherCategory', 'OtherCategory'],
    'Subcategory': ['X', 'Y', 'X', 'Y'],
    'Value': [10, np.nan, 20, 25]
})

# Group by two columns and calculate the mean, handling missing values
grouped = df.groupby(['Category', 'Subcategory'])['Value'].mean(skipna=True)

print("Grouped data with missing values handled:")
print(grouped)
In this example, we use the skipna=True parameter in the mean() function to ignore missing values when calculating the mean for each group.
Reshaping Data with Pandas GroupBy Two Columns
Pandas groupby two columns can be used in combination with other pandas functions to reshape your data. One common operation is pivoting, which can create a new DataFrame with a different structure based on the grouped data. Here’s an example:
import pandas as pd

# Create a sample DataFrame
df = pd.DataFrame({
    'Date': ['2023-01-01', '2023-01-01', '2023-01-02', '2023-01-02'],
    'Product': ['PandasDataFrame.com', 'OtherProduct', 'PandasDataFrame.com', 'OtherProduct'],
    'Sales': [100, 150, 200, 250]
})

# Group by two columns and pivot the data
pivoted = df.pivot_table(values='Sales', index='Date', columns='Product', aggfunc='sum')

print("Pivoted data:")
print(pivoted)
Output:
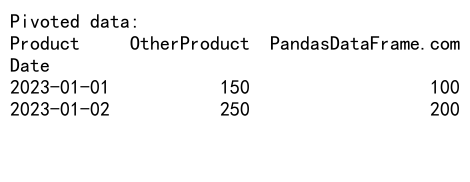
In this example, we use the pivot_table() function to reshape the data, creating a new DataFrame where each unique product becomes a column, and the sales values are aggregated for each date.
Combining Multiple DataFrames with Pandas GroupBy Two Columns
Pandas groupby two columns can be useful when combining multiple DataFrames. You can use it to aggregate data from different sources before merging them. Here’s an example:
import pandas as pd

# Create two sample DataFrames
df1 = pd.DataFrame({
    'Store': ['PandasDataFrame.com', 'PandasDataFrame.com', 'OtherStore'],
    'Product': ['A', 'B', 'A'],
    'Sales': [100, 150, 200]
})

df2 = pd.DataFrame({
    'Store': ['PandasDataFrame.com', 'OtherStore', 'OtherStore'],
    'Product': ['A', 'B', 'C'],
    'Quantity': [10, 15, 20]
})

# Group both DataFrames by Store and Product
grouped1 = df1.groupby(['Store', 'Product'])['Sales'].sum().reset_index()
grouped2 = df2.groupby(['Store', 'Product'])['Quantity'].sum().reset_index()

# Merge the grouped DataFrames
merged = pd.merge(grouped1, grouped2, on=['Store', 'Product'], how='outer')

print("Merged data:")
print(merged)
Output:
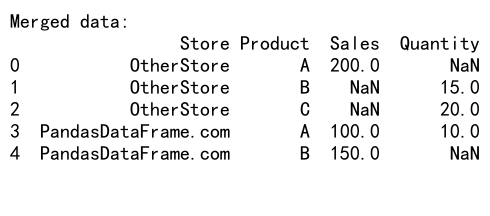
In this example, we group both DataFrames by ‘Store’ and ‘Product’ columns, aggregate the ‘Sales’ and ‘Quantity’ columns, and then merge the resulting DataFrames.
Time-based Grouping with Pandas GroupBy Two Columns
When working with time series data, you can use pandas groupby two columns to perform time-based grouping and analysis. Here’s an example:
import pandas as pd

# Create a sample DataFrame with datetime index
df = pd.DataFrame({
    'Date': pd.date_range(start='2023-01-01', end='2023-12-31', freq='D'),
    'Store': ['PandasDataFrame.com', 'OtherStore'] * 182 + ['PandasDataFrame.com'],
    'Sales': np.random.randint(100, 1000, 365)
})

df.set_index('Date', inplace=True)

# Group by store and month, then calculate monthly sales
monthly_sales = df.groupby([df.index.to_period('M'), 'Store'])['Sales'].sum()

print("Monthly sales by store:")
print(monthly_sales)
In this example, we group the DataFrame by both the month (derived from the datetime index) and the ‘Store’ column, then calculate the total sales for each store in each month.
Hierarchical Indexing with Pandas GroupBy Two Columns
When you use pandas groupby two columns, the result often has a hierarchical (multi-level) index. Understanding how to work with these indices is crucial for effective data manipulation. Here’s an example:
import pandas as pd

# Create a sample DataFrame
df = pd.DataFrame({
    'Region': ['PandasDataFrame.com', 'PandasDataFrame.com', 'OtherRegion', 'OtherRegion'],
    'Category': ['Electronics', 'Clothing', 'Electronics', 'Clothing'],
    'Sales': [1000, 1500, 2000, 2500]
})

# Group by two columns and calculate the sum of sales
grouped = df.groupby(['Region', 'Category'])['Sales'].sum()

print("Grouped data with hierarchical index:")
print(grouped)

# Access a specific group
print("\nSales for PandasDataFrame.com Electronics:")
print(grouped.loc[('PandasDataFrame.com', 'Electronics')])

# Unstack the result to create a pivot table-like structure
unstacked = grouped.unstack()

print("\nUnstacked data:")
print(unstacked)
Output:
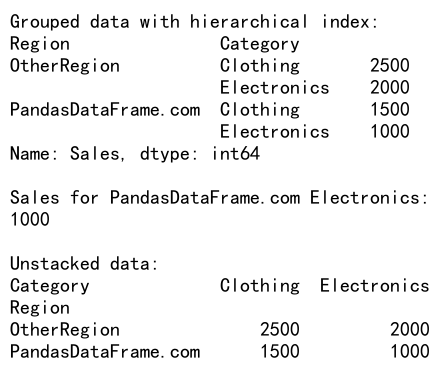
In this example, we group the DataFrame by ‘Region’ and ‘Category’ columns and calculate the sum of sales. The result has a hierarchical index. We demonstrate how to access specific groups and how to unstack the result to create a pivot table-like structure.
Grouping and Aggregating Multiple Columns with Pandas GroupBy Two Columns
When you have multiple columns that you want to aggregate after grouping, you can specify different aggregation functions for each column. Here’s an example:
import pandas as pd

# Create a sample DataFrame
df = pd.DataFrame({
    'Store': ['PandasDataFrame.com', 'PandasDataFrame.com', 'OtherStore', 'OtherStore'],
    'Product': ['A', 'B', 'A', 'B'],
    'Sales': [100, 150, 200, 250],
    'Quantity': [10, 15, 20, 25],
    'Profit': [20, 30, 40, 50]
})

# Group by two columns and aggregate multiple columns
grouped = df.groupby(['Store', 'Product']).agg({
    'Sales': 'sum',
    'Quantity': 'mean',
    'Profit': ['min', 'max']
})

print("Grouped data with multiple column aggregations:")
print(grouped)
Output:
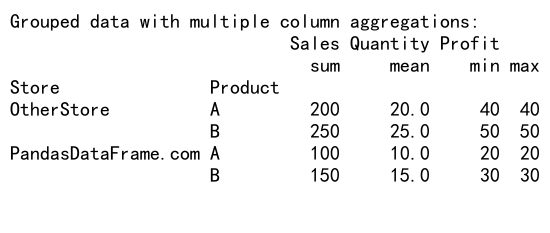
In this example, we group the DataFrame by ‘Store’ and ‘Product’ columns, then apply different aggregation functions to ‘Sales’, ‘Quantity’, and ‘Profit’ columns. Note that we can apply multiple aggregation functions to a single column, as demonstrated with the ‘Profit’ column.
Grouping and Sorting with Pandas GroupBy Two Columns
After grouping data using pandas groupby two columns, you might want to sort the results based on certain criteria. Here’s an example of how to do this:
import pandas as pd

# Create a sample DataFrame
df = pd.DataFrame({
    'Category': ['PandasDataFrame.com', 'PandasDataFrame.com', 'OtherCategory', 'OtherCategory'],
    'Subcategory': ['X', 'Y', 'X', 'Y'],
    'Sales': [1000, 1500, 2000, 2500],
    'Quantity': [100, 150, 200, 250]
})

# Group by two columns, calculate total sales, and sort by sales in descending order
grouped = df.groupby(['Category', 'Subcategory']).agg({
    'Sales': 'sum',
    'Quantity': 'sum'
}).sort_values('Sales', ascending=False)

print("Grouped and sorted data:")
print(grouped)
Output:
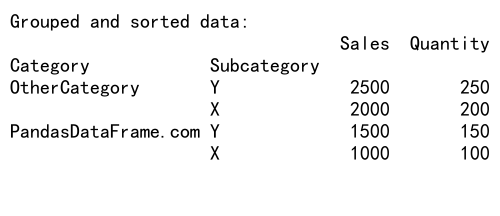
In this example, we group the DataFrame by ‘Category’ and ‘Subcategory’ columns, calculate the sum of ‘Sales’ and ‘Quantity’, and then sort the results based on ‘Sales’ in descending order.
Grouping and Filtering with Pandas GroupBy Two Columns
Sometimes you may want to filter your data based on group-level statistics. Pandas provides the filter() method for this purpose. Here’s an example:
import pandas as pd

# Create a sample DataFrame
df = pd.DataFrame({
    'Store': ['PandasDataFrame.com', 'PandasDataFrame.com', 'OtherStore', 'OtherStore'],
    'Product': ['A', 'B', 'A', 'B'],
    'Sales': [100, 150, 200, 250],
    'Quantity': [10, 15, 20, 25]
})

# Group by two columns and filter groups with total sales greater than 300
filtered = df.groupby(['Store', 'Product']).filter(lambda x: x['Sales'].sum() > 300)

print("Filtered data:")
print(filtered)
Output:
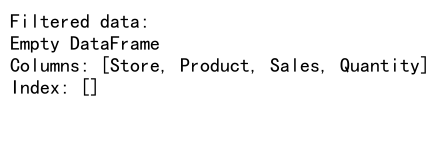
In this example, we group the DataFrame by ‘Store’ and ‘Product’ columns, then filter the groups to include only those with total sales greater than 300.
Advanced Techniques with Pandas GroupBy Two Columns
Rolling Window Calculations
You can combine pandas groupby two columns with rolling window calculations to perform more complex analyses. Here’s an example:
import pandas as pd
import numpy as np

# Create a sample DataFrame with a date index
df = pd.DataFrame({
    'Date': pd.date_range(start='2023-01-01', end='2023-12-31', freq='D'),
    'Store': ['PandasDataFrame.com', 'OtherStore'] * 182 + ['PandasDataFrame.com'],
    'Sales': np.random.randint(100, 1000, 365)
})

df.set_index('Date', inplace=True)

# Group by store and calculate 7-day rolling average of sales
rolling_avg = df.groupby('Store')['Sales'].rolling(window=7).mean()

print("7-day rolling average of sales by store:")
print(rolling_avg)
Output:
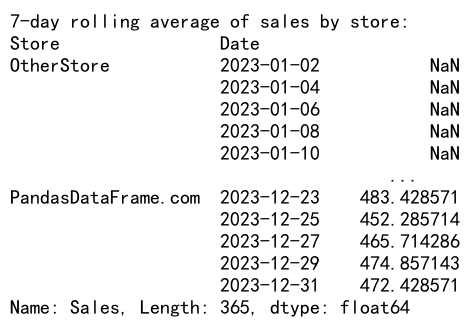
In this example, we group the DataFrame by ‘Store’ and calculate a 7-day rolling average of sales for each store.
Grouping with Custom Functions
You can use custom functions with pandas groupby two columns to perform more complex operations. Here’s an example:
import pandas as pd

# Create a sample DataFrame
df = pd.DataFrame({
    'Category': ['PandasDataFrame.com', 'PandasDataFrame.com', 'OtherCategory', 'OtherCategory'],
    'Subcategory': ['X', 'Y', 'X', 'Y'],
    'Value': [10, 15, 20, 25]
})

# Define a custom function
def custom_agg(group):
    return pd.Series({
        'Total': group['Value'].sum(),
        'Average': group['Value'].mean(),
        'Range': group['Value'].max() - group['Value'].min()
    })

# Group by two columns and apply the custom function
result = df.groupby(['Category', 'Subcategory']).apply(custom_agg)

print("Result of custom aggregation:")
print(result)
In this example, we define a custom function that calculates the total, average, and range of values for each group. We then apply this function to the grouped data using the apply() method.
Best Practices for Using Pandas GroupBy with Two Columns
When working with pandas groupby two columns, keep these best practices in mind:
- Choose appropriate columns for grouping: Select columns that create meaningful groups for your analysis.
-
Handle missing values: Decide how to handle missing values before grouping, as they can affect your results.
-
Use efficient aggregation functions: Choose built-in aggregation functions when possible, as they are optimized for performance.
-
Be mindful of memory usage: Grouping large datasets can be memory-intensive. Consider using chunking or iterating over groups for very large datasets.
-
Understand the resulting data structure: Grouping by two columns often results in a multi-index DataFrame. Familiarize yourself with multi-index operations for effective data manipulation.
-
Use method chaining: Combine groupby operations with other pandas methods for more concise and readable code.
-
Leverage pandas’ built-in plotting capabilities: Use the
plot()method on grouped data for quick visualizations.
Here’s an example that demonstrates some of these best practices:
import pandas as pd
import matplotlib.pyplot as plt

# Create a sample DataFrame
df = pd.DataFrame({
    'Date': pd.date_range(start='2023-01-01', end='2023-12-31', freq='D'),
    'Store': ['PandasDataFrame.com', 'OtherStore'] * 182 + ['PandasDataFrame.com'],
    'Product': ['A', 'B', 'C'] * 121 + ['A', 'B'],
    'Sales': np.random.randint(100, 1000, 365),
    'Quantity': np.random.randint(10, 100, 365)
})

# Group by store and product, calculate multiple aggregations, and sort by total sales
result = (df.groupby(['Store', 'Product'])
            .agg({
                'Sales': ['sum', 'mean'],
                'Quantity': ['sum', 'mean']
            })
            .sort_values(('Sales', 'sum'), ascending=False)
         )

print("Grouped, aggregated, and sorted data:")
print(result)

# Plot total sales by store and product
result[('Sales', 'sum')].unstack().plot(kind='bar', stacked=True)
plt.title('Total Sales by Store and Product')
plt.xlabel('Store')
plt.ylabel('Total Sales')
plt.show()
This example demonstrates method chaining, efficient aggregation, sorting, and visualization of grouped data.
Conclusion
Pandas groupby two columns is a powerful feature that allows for complex data analysis and manipulation. By grouping data based on two columns, you can uncover insights and patterns that might not be apparent when looking at individual records or single-column groupings.
 Pandas Dataframe