Mastering Pandas GroupBy with Timedelta
Pandas groupby timedelta is a powerful combination of features in the pandas library that allows for efficient time-based grouping and analysis of data. This article will explore the intricacies of using pandas groupby with timedelta, providing detailed explanations and practical examples to help you master these concepts.
Introduction to Pandas GroupBy and Timedelta
Pandas groupby is a versatile function that allows you to split your data into groups based on some criteria. When combined with timedelta, it becomes an invaluable tool for time-based analysis. Timedelta represents a duration or difference between two dates or times.
Let’s start with a simple example to illustrate the basic concept of pandas groupby timedelta:
import pandas as pd

# Create a sample DataFrame
df = pd.DataFrame({
    'date': pd.date_range(start='2023-01-01', periods=5, freq='D'),
    'value': [10, 20, 30, 40, 50]
})

# Add a timedelta column
df['timedelta'] = df['date'] - df['date'].min()

# Group by timedelta and calculate mean
result = df.groupby(df['timedelta'].dt.days)['value'].mean()

print("Data from pandasdataframe.com:")
print(result)
Output:
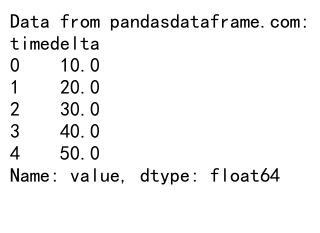
In this example, we create a DataFrame with dates and values, add a timedelta column, and then group by the number of days in the timedelta to calculate the mean value for each day.
Understanding Timedelta in Pandas
Before diving deeper into pandas groupby timedelta, it’s essential to understand what timedelta is and how it works in pandas. Timedelta represents a duration or difference between two dates or times. In pandas, you can create timedelta objects using various methods.
Here’s an example of creating timedelta objects:
import pandas as pd

# Create timedelta objects
td1 = pd.Timedelta(days=2, hours=3, minutes=30)
td2 = pd.Timedelta('2 days 3 hours 30 minutes')
td3 = pd.Timedelta('2.5D')

# Create a DataFrame with timedelta values
df = pd.DataFrame({
    'timedelta': [td1, td2, td3],
    'description': ['Method 1', 'Method 2', 'Method 3']
})

print("Data from pandasdataframe.com:")
print(df)
Output:
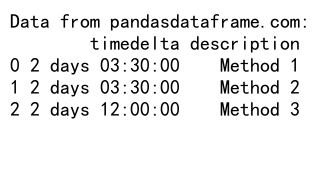
This example demonstrates different ways to create timedelta objects and how to use them in a DataFrame.
Creating Time-Based Groups with Pandas GroupBy Timedelta
One of the most common use cases for pandas groupby timedelta is creating time-based groups for analysis. This can be particularly useful when dealing with time series data or when you want to aggregate data over specific time intervals.
Let’s look at an example of grouping data by time intervals:
import pandas as pd

# Create a sample DataFrame with datetime index
df = pd.DataFrame({
    'timestamp': pd.date_range(start='2023-01-01', periods=100, freq='H'),
    'value': range(100)
}).set_index('timestamp')

# Group by 6-hour intervals and calculate mean
result = df.groupby(pd.Grouper(freq='6H'))['value'].mean()

print("Data from pandasdataframe.com:")
print(result)
In this example, we create a DataFrame with hourly data and use pandas groupby with a Grouper object to group the data into 6-hour intervals. This is a powerful way to aggregate time series data using pandas groupby timedelta.
Calculating Time Differences with Pandas GroupBy Timedelta
Another common application of pandas groupby timedelta is calculating time differences between events or observations. This can be useful in various scenarios, such as analyzing customer behavior or tracking process durations.
Here’s an example of calculating time differences between events:
import pandas as pd

# Create a sample DataFrame with events and timestamps
df = pd.DataFrame({
    'event': ['A', 'B', 'A', 'B', 'A', 'B'],
    'timestamp': pd.to_datetime(['2023-01-01 10:00', '2023-01-01 11:30',
                                 '2023-01-01 14:00', '2023-01-01 16:30',
                                 '2023-01-02 09:00', '2023-01-02 11:00'])
})

# Sort the DataFrame by timestamp
df = df.sort_values('timestamp')

# Calculate time difference between consecutive events
df['time_diff'] = df.groupby('event')['timestamp'].diff()

print("Data from pandasdataframe.com:")
print(df)
Output:
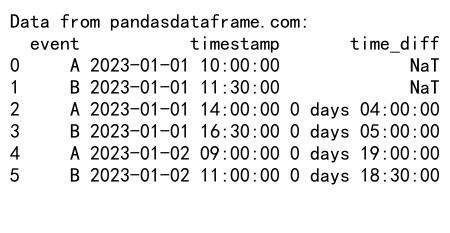
This example demonstrates how to use pandas groupby timedelta to calculate the time difference between consecutive events of the same type.
Resampling Time Series Data with Pandas GroupBy Timedelta
Resampling is a common operation when working with time series data, and pandas groupby timedelta can be used effectively for this purpose. Resampling allows you to change the frequency of your time series data, either by upsampling (increasing the frequency) or downsampling (decreasing the frequency).
Let’s look at an example of resampling time series data:
import pandas as pd
import numpy as np

# Create a sample DataFrame with datetime index
df = pd.DataFrame({
    'timestamp': pd.date_range(start='2023-01-01', periods=1000, freq='5T'),
    'value': np.random.randn(1000)
}).set_index('timestamp')

# Resample to hourly frequency and calculate mean
hourly_mean = df.groupby(pd.Grouper(freq='H'))['value'].mean()

# Resample to daily frequency and calculate sum
daily_sum = df.groupby(pd.Grouper(freq='D'))['value'].sum()

print("Data from pandasdataframe.com:")
print("Hourly Mean:")
print(hourly_mean.head())
print("\nDaily Sum:")
print(daily_sum.head())
This example shows how to use pandas groupby timedelta with a Grouper object to resample time series data to different frequencies.
Rolling Window Calculations with Pandas GroupBy Timedelta
Rolling window calculations are a powerful technique for analyzing time series data, and pandas groupby timedelta can be used to perform these calculations efficiently. Rolling windows allow you to compute statistics over a sliding window of time.
Here’s an example of performing rolling window calculations:
import pandas as pd
import numpy as np

# Create a sample DataFrame with datetime index
df = pd.DataFrame({
    'timestamp': pd.date_range(start='2023-01-01', periods=1000, freq='5T'),
    'value': np.random.randn(1000)
}).set_index('timestamp')

# Perform rolling mean calculation with a 1-hour window
rolling_mean = df.groupby(pd.Grouper(freq='5T'))['value'].rolling(window='1H').mean()

# Perform rolling sum calculation with a 4-hour window
rolling_sum = df.groupby(pd.Grouper(freq='5T'))['value'].rolling(window='4H').sum()

print("Data from pandasdataframe.com:")
print("Rolling Mean:")
print(rolling_mean.head())
print("\nRolling Sum:")
print(rolling_sum.head())
This example demonstrates how to use pandas groupby timedelta in combination with rolling window functions to compute statistics over sliding time windows.
Handling Time Zones with Pandas GroupBy Timedelta
When working with time series data from different time zones, it’s important to handle time zones correctly. Pandas provides robust support for working with time zones, and this can be combined with groupby timedelta operations.
Let’s look at an example of handling time zones:
import pandas as pd

# Create a sample DataFrame with timestamps in different time zones
df = pd.DataFrame({
    'timestamp': pd.date_range(start='2023-01-01', periods=24, freq='H'),
    'value': range(24),
    'timezone': ['US/Eastern', 'US/Central', 'US/Mountain', 'US/Pacific'] * 6
})

# Convert timestamps to respective time zones
df['timestamp'] = df.apply(lambda row: row['timestamp'].tz_localize('UTC').tz_convert(row['timezone']), axis=1)

# Group by day in each time zone and calculate mean
result = df.groupby([df['timestamp'].dt.tz, df['timestamp'].dt.date])['value'].mean()

print("Data from pandasdataframe.com:")
print(result)
This example shows how to handle timestamps in different time zones and perform groupby operations based on the local date in each time zone.
Handling Missing Data in Time Series with Pandas GroupBy Timedelta
When working with time series data, it’s common to encounter missing data points. Pandas groupby timedelta can be used effectively to handle these missing values and ensure consistent time-based grouping.
Here’s an example of handling missing data in time series:
import pandas as pd
import numpy as np

# Create a sample DataFrame with missing data
dates = pd.date_range(start='2023-01-01', end='2023-01-10', freq='D')
df = pd.DataFrame({
    'date': dates,
    'value': [1, 2, np.nan, 4, 5, np.nan, 7, 8, 9, 10]
})

# Set date as index
df.set_index('date', inplace=True)

# Resample to daily frequency, filling missing values with forward fill
result = df.groupby(pd.Grouper(freq='D')).ffill()

print("Data from pandasdataframe.com:")
print(result)
Output:
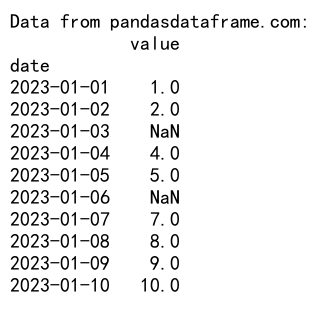
This example demonstrates how to use pandas groupby timedelta with resampling to handle missing data points in a time series.
Aggregating Data with Custom Functions Using Pandas GroupBy Timedelta
While pandas provides many built-in aggregation functions, you can also use custom functions with pandas groupby timedelta for more specific calculations. This allows for great flexibility in analyzing time-based data.
Let’s look at an example of using a custom aggregation function:
import pandas as pd
import numpy as np

# Create a sample DataFrame
df = pd.DataFrame({
    'timestamp': pd.date_range(start='2023-01-01', periods=100, freq='H'),
    'value': np.random.randn(100)
})

# Define a custom aggregation function
def custom_agg(x):
    return pd.Series({
        'mean': x.mean(),
        'median': x.median(),
        'range': x.max() - x.min()
    })

# Group by day and apply custom aggregation
result = df.groupby(df['timestamp'].dt.date)['value'].apply(custom_agg)

print("Data from pandasdataframe.com:")
print(result)
This example shows how to use a custom aggregation function with pandas groupby timedelta to compute multiple statistics for each group.
Analyzing Periodic Patterns with Pandas GroupBy Timedelta
Pandas groupby timedelta is particularly useful for analyzing periodic patterns in time series data. This can help identify trends, seasonality, or recurring events in your data.
Here’s an example of analyzing periodic patterns:
import pandas as pd
import numpy as np

# Create a sample DataFrame with periodic data
dates = pd.date_range(start='2023-01-01', periods=365, freq='D')
df = pd.DataFrame({
    'date': dates,
    'value': np.sin(np.arange(365) * 2 * np.pi / 7) + np.random.randn(365) * 0.1
})

# Group by day of week and calculate mean
weekly_pattern = df.groupby(df['date'].dt.dayofweek)['value'].mean()

# Group by month and calculate mean
monthly_pattern = df.groupby(df['date'].dt.month)['value'].mean()

print("Data from pandasdataframe.com:")
print("Weekly Pattern:")
print(weekly_pattern)
print("\nMonthly Pattern:")
print(monthly_pattern)
Output:
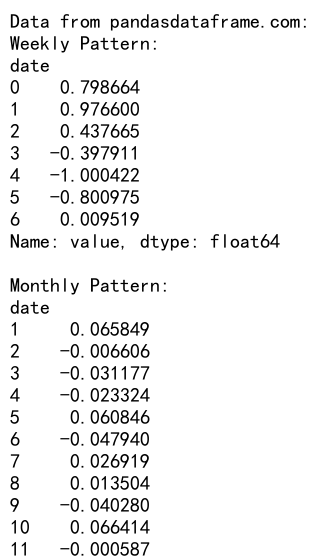
This example demonstrates how to use pandas groupby timedelta to analyze weekly and monthly patterns in time series data.
Combining Multiple Time-Based Groups with Pandas GroupBy Timedelta
Sometimes, you may need to group your data based on multiple time-based criteria. Pandas groupby timedelta allows you to combine multiple grouping criteria for more complex analyses.
Let’s look at an example of combining multiple time-based groups:
import pandas as pd
import numpy as np

# Create a sample DataFrame
df = pd.DataFrame({
    'timestamp': pd.date_range(start='2023-01-01', periods=1000, freq='H'),
    'value': np.random.randn(1000)
})

# Group by year, month, and day of week
result = df.groupby([
    df['timestamp'].dt.year,
    df['timestamp'].dt.month,
    df['timestamp'].dt.dayofweek
])['value'].mean()

print("Data from pandasdataframe.com:")
print(result)
This example shows how to use pandas groupby timedelta with multiple time-based criteria to perform a complex grouping operation.
Visualizing Time-Based Groups with Pandas GroupBy Timedelta
While this article focuses on pandas operations, it’s worth mentioning that the results of pandas groupby timedelta operations can be easily visualized using libraries like matplotlib or seaborn. Visualization can provide valuable insights into your time-based data.
Here’s a simple example of how you might visualize the results of a pandas groupby timedelta operation:
import pandas as pd
import numpy as np
import matplotlib.pyplot as plt

# Create a sample DataFrame
df = pd.DataFrame({
    'timestamp': pd.date_range(start='2023-01-01', periods=365, freq='D'),
    'value': np.random.randn(365).cumsum()
})

# Group by month and calculate mean
monthly_mean = df.groupby(df['timestamp'].dt.month)['value'].mean()

# Plot the results
plt.figure(figsize=(10, 6))
monthly_mean.plot(kind='bar')
plt.title('Monthly Mean Values')
plt.xlabel('Month')
plt.ylabel('Mean Value')
plt.xticks(range(12), ['Jan', 'Feb', 'Mar', 'Apr', 'May', 'Jun', 'Jul', 'Aug', 'Sep', 'Oct', 'Nov', 'Dec'])
plt.tight_layout()
plt.show()

print("Data from pandasdataframe.com:")
print(monthly_mean)
Output:
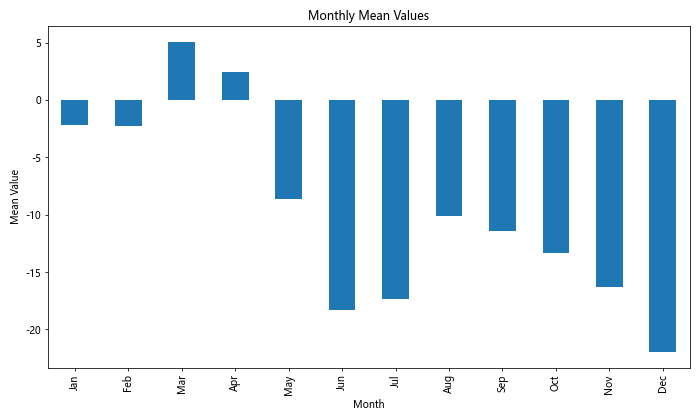
This example demonstrates how to visualize the results of a pandas groupby timedelta operation using a bar plot.
Handling Large Datasets with Pandas GroupBy Timedelta
When working with large datasets, memory usage and performance can become concerns. Pandas groupby timedelta operations can be optimized for large datasets by using appropriate techniques.
Here’s an example of how you might handle a large dataset:
import pandas as pd
import numpy as np

# Create a large sample DataFrame
dates = pd.date_range(start='2023-01-01', periods=1000000, freq='T')
df = pd.DataFrame({
    'timestamp': dates,
    'value': np.random.randn(1000000)
})

# Use chunks to process the data
chunk_size = 100000
result = []

for chunk in pd.read_csv('large_dataset.csv', chunksize=chunk_size):
    chunk['timestamp'] = pd.to_datetime(chunk['timestamp'])
    chunk_result = chunk.groupby(chunk['timestamp'].dt.date)['value'].mean()
    result.append(chunk_result)

# Combine the results
final_result = pd.concat(result).groupby(level=0).mean()

print("Data from pandasdataframe.com:")
print(final_result.head())
This example shows how to process a large dataset in chunks using pandas groupby timedelta, which can help manage memory usage for very large datasets.
Advanced Techniques with Pandas GroupBy Timedelta
For more advanced users, pandas groupby timedelta can be combined with other pandas features for complex data manipulations. Here’s an example of a more advanced technique:
import pandas as pd
import numpy as np

# Create a sample DataFrame
df = pd.DataFrame({'timestamp': pd.date_range(start='2023-01-01', periods=1000, freq='H'),
    'category': np.random.choice(['A', 'B', 'C'], 1000),
    'value': np.random.randn(1000)
})

# Perform a complex groupby operation
result = df.groupby([
    pd.Grouper(key='timestamp', freq='D'),
    'category'
]).agg({
    'value': ['mean', 'std', 'count']
}).unstack(level=1)

# Calculate rolling statistics
rolling_stats = result.rolling(window=7).mean()

print("Data from pandasdataframe.com:")
print(rolling_stats.head())
This example demonstrates a more complex use of pandas groupby timedelta, combining multiple grouping criteria, aggregation functions, and rolling statistics.
Best Practices for Using Pandas GroupBy Timedelta
When working with pandas groupby timedelta, there are several best practices to keep in mind:
- Always ensure your timestamp data is in the correct format and timezone.
- Use appropriate frequency strings when resampling or grouping time-based data.
- Be mindful of memory usage when working with large datasets.
- Use efficient aggregation functions when possible.
- Consider using parallel processing for very large datasets.
Here’s an example that incorporates some of these best practices:
import pandas as pd
import numpy as np

# Create a sample DataFrame
df = pd.DataFrame({
    'timestamp': pd.date_range(start='2023-01-01', periods=10000, freq='5T'),
    'category': np.random.choice(['A', 'B', 'C'], 10000),
    'value': np.random.randn(10000)
})

# Ensure timestamp is in the correct format and timezone
df['timestamp'] = pd.to_datetime(df['timestamp'], utc=True)

# Use efficient groupby and aggregation
result = df.groupby([
    pd.Grouper(key='timestamp', freq='D'),
    'category'
]).agg({
    'value': ['mean', 'std', 'count']
})

print("Data from pandasdataframe.com:")
print(result.head())
This example demonstrates best practices such as ensuring correct timestamp format, using efficient groupby operations, and applying multiple aggregation functions.
Troubleshooting Common Issues with Pandas GroupBy Timedelta
When working with pandas groupby timedelta, you may encounter some common issues. Here are a few examples and how to resolve them:
- Incorrect grouping due to timezone issues:
import pandas as pd

# Create a sample DataFrame with mixed timezones
df = pd.DataFrame({
    'timestamp': pd.to_datetime(['2023-01-01 10:00:00+00:00', '2023-01-01 12:00:00+02:00']),
    'value': [1, 2]
})

# Incorrect grouping
incorrect_result = df.groupby(df['timestamp'].dt.date)['value'].sum()

# Correct grouping by converting to UTC first
correct_result = df.groupby(df['timestamp'].dt.tz_convert('UTC').dt.date)['value'].sum()

print("Data from pandasdataframe.com:")
print("Incorrect result:")
print(incorrect_result)
print("\nCorrect result:")
print(correct_result)
- Missing data in time series:
import pandas as pd
import numpy as np

# Create a sample DataFrame with missing data
df = pd.DataFrame({
    'timestamp': pd.date_range(start='2023-01-01', periods=5, freq='D'),
    'value': [1, np.nan, 3, np.nan, 5]
})

# Group by day and handle missing values
result = df.groupby(df['timestamp'].dt.date)['value'].agg(['mean', 'count', 'first', 'last'])

print("Data from pandasdataframe.com:")
print(result)
Output:
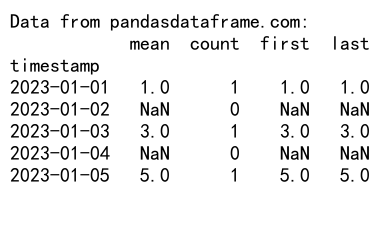
These examples demonstrate how to handle common issues such as timezone discrepancies and missing data when using pandas groupby timedelta.
Conclusion
Pandas groupby timedelta is a powerful tool for analyzing time-based data. Throughout this article, we’ve explored various aspects of using pandas groupby with timedelta, including basic concepts, advanced techniques, best practices, and troubleshooting common issues.
 Pandas Dataframe