Mastering Pandas GroupBy: A Comprehensive Guide to Data Aggregation and Analysis
Pandas groupby is a powerful feature in the pandas library that allows you to group data based on specific criteria and perform various operations on these groups. This article will provide an in-depth exploration of pandas groupby, covering its functionality, use cases, and best practices. We’ll dive into the intricacies of groupby operations, demonstrating how to leverage this tool for efficient data analysis and manipulation.
Pandas GroupBy Recommended Articles
- pandas groupby add sum column
- pandas groupby agg count all
- pandas groupby agg
- pandas groupby aggregate multiple columns
- pandas groupby apply
- pandas groupby as_index=false
- pandas groupby average all columns
- pandas groupby average
- pandas groupby bins
- pandas groupby combine two columns
- pandas groupby count distinct
- pandas groupby count unique
- pandas groupby count
- pandas groupby create new column
- pandas groupby filter
- pandas groupby first
- pandas groupby get groups
- pandas groupby get indices
- pandas groupby include nan
- pandas groupby index
- pandas groupby join
- pandas groupby list
- pandas groupby max
- pandas groupby mean
- pandas groupby mode
- pandas groupby month
- pandas groupby multiple columns
- pandas groupby quantile
- pandas groupby rank
- pandas groupby rename
- pandas groupby shift
- pandas groupby size
- pandas groupby sort
- pandas groupby sum
- pandas groupby then mean
- pandas groupby timedelta
- pandas groupby transform
- pandas groupby two columns
- pandas groupby unique count
- pandas groupby vs pivot
- pandas groupby weighted average
Understanding the Basics of Pandas GroupBy
Pandas groupby is fundamentally a split-apply-combine operation. It splits the data into groups, applies a function to each group, and then combines the results. This process is incredibly useful for analyzing data across different categories or time periods.
Let’s start with a simple example to illustrate the basic usage of pandas groupby:
import pandas as pd

# Create a sample DataFrame
df = pd.DataFrame({
    'Name': ['John', 'Emma', 'John', 'Emma', 'Sarah'],
    'Age': [25, 30, 25, 30, 35],
    'City': ['New York', 'London', 'New York', 'Paris', 'Tokyo'],
    'Salary': [50000, 60000, 55000, 65000, 70000]
})

# Group by 'Name' and calculate mean salary
grouped = df.groupby('Name')['Salary'].mean()

print("Average salary by name:")
print(grouped)
Output:
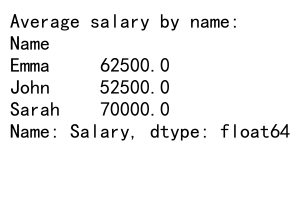
In this example, we group the DataFrame by the ‘Name’ column and calculate the mean salary for each person. The groupby function creates a GroupBy object, which we can then apply aggregation functions to.
Exploring GroupBy Objects
When you use pandas groupby, you create a GroupBy object. This object doesn’t actually compute anything until you apply an operation to it. Let’s explore some properties of GroupBy objects:
import pandas as pd

# Create a sample DataFrame
df = pd.DataFrame({
    'Category': ['A', 'B', 'A', 'B', 'A', 'C'],
    'Value': [10, 20, 15, 25, 30, 35]
})

# Create a GroupBy object
grouped = df.groupby('Category')

# Get the groups
print("Groups:")
for name, group in grouped:
    print(f"Group: {name}")
    print(group)
    print()

# Get the group keys
print("Group keys:", grouped.groups.keys())

# Get the number of groups
print("Number of groups:", len(grouped))
Output:
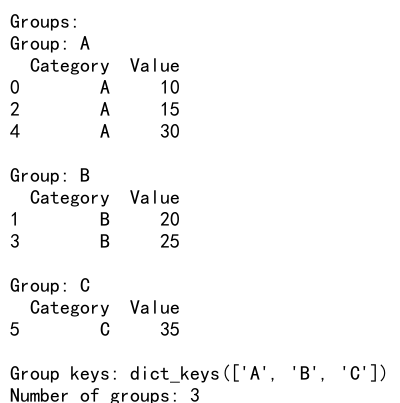
This example demonstrates how to inspect the groups within a GroupBy object, access the group keys, and determine the number of groups.
Applying Aggregation Functions with Pandas GroupBy
One of the most common uses of pandas groupby is to apply aggregation functions to grouped data. Pandas provides a wide range of built-in aggregation functions, and you can also define custom aggregation functions.
Here’s an example showcasing various aggregation functions:
import pandas as pd

# Create a sample DataFrame
df = pd.DataFrame({
    'Product': ['A', 'B', 'A', 'B', 'A', 'C'],
    'Sales': [100, 200, 150, 250, 300, 350],
    'Quantity': [10, 15, 12, 18, 20, 25]
})

# Group by 'Product' and apply multiple aggregation functions
result = df.groupby('Product').agg({
    'Sales': ['sum', 'mean', 'max'],
    'Quantity': ['sum', 'mean', 'min']
})

print("Aggregation results:")
print(result)
Output:
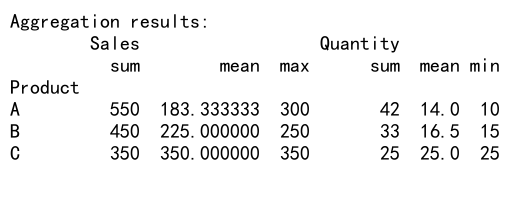
In this example, we group the data by ‘Product’ and apply different aggregation functions to the ‘Sales’ and ‘Quantity’ columns. The agg method allows us to specify multiple functions for each column.
Custom Aggregation Functions with Pandas GroupBy
While pandas provides many built-in aggregation functions, you can also define custom functions for more specific calculations. Here’s an example:
import pandas as pd

# Create a sample DataFrame
df = pd.DataFrame({
    'Category': ['A', 'B', 'A', 'B', 'A', 'C'],
    'Value': [10, 20, 15, 25, 30, 35]
})

# Define a custom aggregation function
def custom_agg(x):
    return x.max() - x.min()

# Apply the custom function
result = df.groupby('Category')['Value'].agg(custom_agg)

print("Custom aggregation result:")
print(result)
Output:
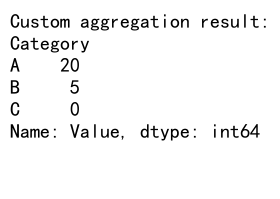
This example demonstrates how to define and apply a custom aggregation function that calculates the range (maximum minus minimum) of values within each group.
Grouping by Multiple Columns
Pandas groupby allows you to group data by multiple columns, enabling more complex analyses. Here’s an example:
import pandas as pd

# Create a sample DataFrame
df = pd.DataFrame({
    'Date': pd.date_range(start='2023-01-01', periods=6),
    'Category': ['A', 'B', 'A', 'B', 'A', 'C'],
    'Sales': [100, 200, 150, 250, 300, 350]
})

# Group by multiple columns
result = df.groupby(['Category', df['Date'].dt.month])['Sales'].sum()

print("Sales by category and month:")
print(result)
Output:
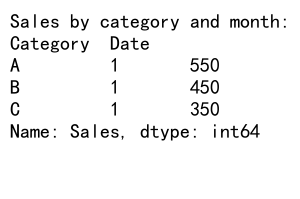
In this example, we group the data by both the ‘Category’ column and the month extracted from the ‘Date’ column. This allows us to analyze sales trends across categories and months simultaneously.
Handling Missing Data in Pandas GroupBy
When working with real-world data, you often encounter missing values. Pandas groupby provides options for handling these situations. Let’s explore an example:
import pandas as pd
import numpy as np

# Create a sample DataFrame with missing values
df = pd.DataFrame({
    'Category': ['A', 'B', 'A', 'B', 'A', 'C'],
    'Value': [10, np.nan, 15, 25, np.nan, 35]
})

# Group by 'Category' and calculate mean, handling missing values
result_dropna = df.groupby('Category')['Value'].mean()
result_skipna = df.groupby('Category')['Value'].mean(skipna=False)

print("Result with dropna (default):")
print(result_dropna)
print("\nResult with skipna=False:")
print(result_skipna)
This example demonstrates the difference between the default behavior (which drops NaN values) and using skipna=False, which includes NaN values in the calculation.
Transforming Data with Pandas GroupBy
The transform method in pandas groupby allows you to apply a function to each group and align the result with the original DataFrame. This is particularly useful for operations like normalization within groups. Here’s an example:
import pandas as pd

# Create a sample DataFrame
df = pd.DataFrame({
    'Category': ['A', 'B', 'A', 'B', 'A', 'C'],
    'Value': [10, 20, 15, 25, 30, 35]
})

# Normalize values within each category
df['Normalized'] = df.groupby('Category')['Value'].transform(lambda x: (x - x.mean()) / x.std())

print("DataFrame with normalized values:")
print(df)
Output:
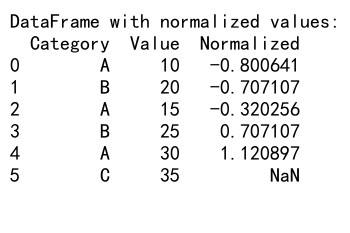
In this example, we normalize the ‘Value’ column within each category by subtracting the mean and dividing by the standard deviation of the group.
Filtering Groups with Pandas GroupBy
Pandas groupby allows you to filter groups based on certain conditions. This is useful for selecting subsets of your data that meet specific criteria. Here’s an example:
import pandas as pd

# Create a sample DataFrame
df = pd.DataFrame({
    'Category': ['A', 'B', 'A', 'B', 'A', 'C'],
    'Value': [10, 20, 15, 25, 30, 35]
})

# Filter groups where the mean value is greater than 20
filtered = df.groupby('Category').filter(lambda x: x['Value'].mean() > 20)

print("Filtered DataFrame:")
print(filtered)
Output:
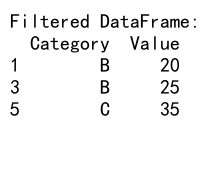
This example filters out groups where the mean ‘Value’ is not greater than 20, keeping only the groups that satisfy this condition.
Applying Multiple Functions with Pandas GroupBy
Sometimes you need to apply multiple functions to your grouped data. Pandas provides a convenient way to do this using the agg method with a dictionary of functions. Here’s an example:
import pandas as pd

# Create a sample DataFrame
df = pd.DataFrame({
    'Category': ['A', 'B', 'A', 'B', 'A', 'C'],
    'Value1': [10, 20, 15, 25, 30, 35],
    'Value2': [5, 10, 7, 12, 15, 17]
})

# Apply multiple functions to different columns
result = df.groupby('Category').agg({
    'Value1': ['mean', 'max'],
    'Value2': ['sum', 'min']
})

print("Result of multiple aggregations:")
print(result)
Output:
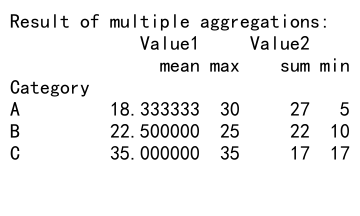
This example demonstrates how to apply different aggregation functions to different columns within the same groupby operation.
Time-based Grouping with Pandas GroupBy
Pandas groupby is particularly useful for time series analysis. You can group data by various time periods such as year, month, or day. Here’s an example:
import pandas as pd

# Create a sample DataFrame with date index
df = pd.DataFrame({
    'Date': pd.date_range(start='2023-01-01', periods=365),
    'Sales': np.random.randint(100, 1000, 365)
}).set_index('Date')

# Group by month and calculate monthly sales
monthly_sales = df.groupby(pd.Grouper(freq='M'))['Sales'].sum()

print("Monthly sales:")
print(monthly_sales)
This example groups sales data by month and calculates the total sales for each month.
Handling Categorical Data with Pandas GroupBy
When working with categorical data, pandas groupby can be particularly useful. Let’s explore an example:
import pandas as pd

# Create a sample DataFrame with categorical data
df = pd.DataFrame({
    'Category': pd.Categorical(['A', 'B', 'A', 'B', 'A', 'C']),
    'Value': [10, 20, 15, 25, 30, 35]
})

# Group by category and calculate statistics
result = df.groupby('Category').agg(['count', 'mean', 'std'])

print("Statistics by category:")
print(result)
This example demonstrates how to group categorical data and calculate various statistics for each category.
Grouping with Functions in Pandas GroupBy
Pandas groupby allows you to use functions to determine the groups. This can be particularly useful when you need to group based on complex criteria. Here’s an example:
import pandas as pd

# Create a sample DataFrame
df = pd.DataFrame({
    'Value': [10, 20, 30, 40, 50, 60],
    'Category': ['A', 'B', 'C', 'A', 'B', 'C']
})

# Define a grouping function
def group_function(x):
    return 'High' if x > 30 else 'Low'

# Group by the result of the function applied to 'Value'
result = df.groupby(df['Value'].apply(group_function))['Category'].value_counts()

print("Grouping result:")
print(result)
Output:
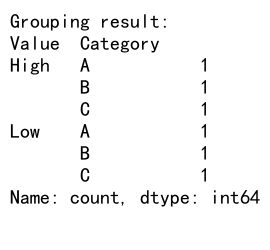
In this example, we use a custom function to group values into ‘High’ and ‘Low’ categories based on whether they’re above or below 30.
Combining GroupBy with Other Pandas Operations
Pandas groupby can be combined with other pandas operations for more complex data manipulations. Here’s an example that combines groupby with pivot tables:
import pandas as pd

# Create a sample DataFrame
df = pd.DataFrame({
    'Date': pd.date_range(start='2023-01-01', periods=6),
    'Category': ['A', 'B', 'A', 'B', 'A', 'C'],
    'Sales': [100, 200, 150, 250, 300, 350]
})

# Group by month and category, then pivot
result = df.groupby([df['Date'].dt.month, 'Category'])['Sales'].sum().unstack()

print("Pivoted sales data:")
print(result)
Output:
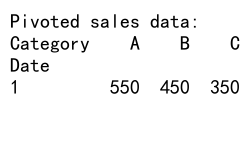
This example groups the data by month and category, sums the sales, and then creates a pivot table with months as rows and categories as columns.
Handling Large Datasets with Pandas GroupBy
When working with large datasets, memory usage can become a concern. Pandas groupby provides options for handling large datasets more efficiently. Here’s an example:
import pandas as pd

# Create a large sample DataFrame
df = pd.DataFrame({
    'ID': range(1000000),
    'Category': ['A', 'B', 'C'] * 333334,
    'Value': np.random.randn(1000000)
})

# Use groupby with chunksize for memory efficiency
for chunk in df.groupby('Category', sort=False, as_index=False, group_keys=False):
    result = chunk[1]['Value'].mean()
    print(f"Mean for category {chunk[0]}: {result}")
This example demonstrates how to use the groupby method with chunksize to process large datasets in smaller chunks, reducing memory usage.
Advanced GroupBy Techniques
Pandas groupby offers several advanced techniques for more complex data analysis. Let’s explore a few of these:
Rolling Window Calculations
You can combine groupby with rolling window calculations for time series analysis:
import pandas as pd
import numpy as np

# Create a sample DataFrame with time series data
df = pd.DataFrame({
    'Date': pd.date_range(start='2023-01-01', periods=100),
    'Category': ['A', 'B'] * 50,
    'Value': np.random.randn(100)
}).set_index('Date')

# Perform a rolling mean calculation within each group
result = df.groupby('Category')['Value'].rolling(window=7).mean()

print("Rolling mean by category:")
print(result)
Output:
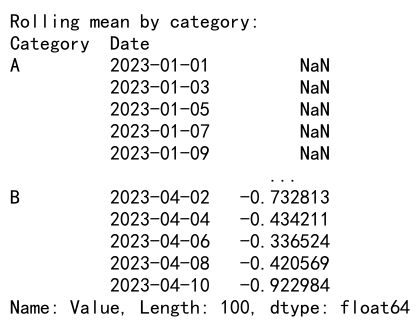
This example calculates a 7-day rolling mean for each category in the dataset.
Grouping with Expressions
You can use complex expressions for grouping:
import pandas as pd

# Create a sample DataFrame
df = pd.DataFrame({
    'A': [1, 1, 2, 2],
    'B': [1, 2, 3, 4],
    'C': [10, 20, 30, 40]
})

# Group by an expression
result = df.groupby(df['A'] + df['B'])['C'].sum()

print("Grouping by expression result:")
print(result)
Output:
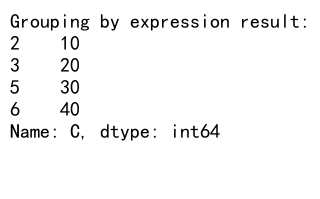
In this example, we group by the sum of columns ‘A’ and ‘B’.
Best Practices for Using Pandas GroupBy
When working with pandas groupby, there are several best practices to keep in mind:
- Choose appropriate aggregation functions: Select aggregation functions that make sense for your data and analysis goals.
-
Handle missing data carefully: Be aware of how missing data is treated in your groupby operations and choose the appropriate method (e.g.,
dropna,fillna) based on your needs. -
Use efficient data types: Convert columns to appropriate data types (e.g., categories for categorical data) to improve performance.
-
Leverage multi-level indexing: When grouping by multiple columns, consider using multi-level indexing for more flexible data manipulation.
-
Combine groupby with other pandas functions: Integrate groupby operations with other pandas functions like
merge,pivot, orresamplefor more powerful analyses. -
Profile and optimize performance: For large datasets, profile your code and consider using techniques like chunking or dask for improved performance.
Common Pitfalls and How to Avoid Them
While pandas groupby is a powerful tool, there are some common pitfalls to be aware of:
- Forgetting to reset the index: After a groupby operation, you may need toreset the index to avoid unexpected behavior in subsequent operations.
-
Ignoring data types: Grouping by columns with inappropriate data types can lead to unexpected results or poor performance.
-
Not handling missing data properly: Failing to account for missing data can skew your results or cause errors.
-
Overcomplicating groupby operations: Sometimes, simpler approaches using basic pandas functions can be more efficient than complex groupby operations.
-
Misunderstanding the difference between transform and apply:
transformreturns a result with the same shape as the input, whileapplycan return a result with a different shape.
Here’s an example demonstrating how to avoid some of these pitfalls:
import pandas as pd
import numpy as np

# Create a sample DataFrame
df = pd.DataFrame({
    'Category': ['A', 'B', 'A', 'B', 'A', 'C'],
    'Value': [10, np.nan, 15, 25, 30, 35]
})

# Correct way to handle missing data and reset index
result = df.groupby('Category')['Value'].mean().reset_index()

print("Correct groupby result:")
print(result)

# Demonstrating the difference between transform and apply
df['Value_normalized'] = df.groupby('Category')['Value'].transform(lambda x: (x - x.mean()) / x.std())
df['Value_rank'] = df.groupby('Category')['Value'].apply(lambda x: x.rank())

print("\nDataFrame with transform and apply results:")
print(df)
This example shows how to properly handle missing data, reset the index after a groupby operation, and demonstrates the difference between transform and apply.
Real-world Applications of Pandas GroupBy
Pandas groupby has numerous real-world applications across various industries. Here are a few examples:
- Financial Analysis: Grouping financial transactions by date, account, or category to calculate totals, averages, or identify trends.
-
Customer Segmentation: Grouping customer data by demographic information or purchasing behavior for targeted marketing strategies.
-
Sales Analysis: Aggregating sales data by product, region, or time period to identify top-performing areas and seasonal trends.
-
Scientific Research: Grouping experimental data by various factors to calculate summary statistics and perform statistical tests.
-
Web Analytics: Analyzing web traffic data grouped by user characteristics, pages visited, or time periods.
Let’s look at a more detailed example of a real-world application:
import pandas as pd
import numpy as np

# Create a sample e-commerce dataset
np.random.seed(0)
dates = pd.date_range(start='2023-01-01', end='2023-12-31', freq='D')
products = ['Product A', 'Product B', 'Product C']
regions = ['North', 'South', 'East', 'West']

df = pd.DataFrame({
    'Date': np.random.choice(dates, 1000),
    'Product': np.random.choice(products, 1000),
    'Region': np.random.choice(regions, 1000),
    'Sales': np.random.randint(50, 500, 1000),
    'Quantity': np.random.randint(1, 10, 1000)
})

# Analyze sales data
monthly_sales = df.groupby([df['Date'].dt.to_period('M'), 'Product'])['Sales'].sum().unstack()
product_performance = df.groupby('Product').agg({
    'Sales': ['sum', 'mean'],
    'Quantity': 'sum'
})
regional_analysis = df.groupby(['Region', 'Product'])['Sales'].sum().unstack()

print("Monthly Sales by Product:")
print(monthly_sales)
print("\nProduct Performance:")
print(product_performance)
print("\nRegional Sales Analysis:")
print(regional_analysis)
Output:
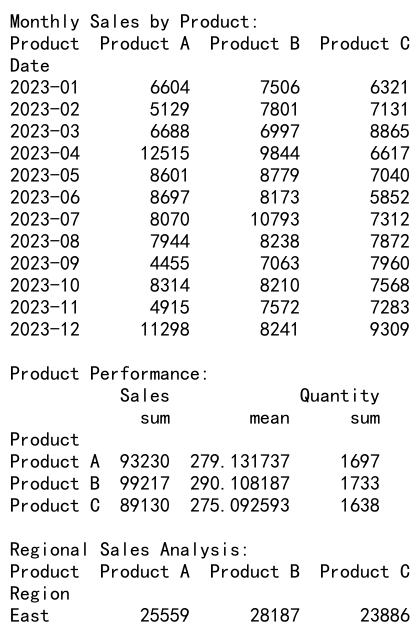
This example demonstrates how pandas groupby can be used to analyze e-commerce data, providing insights into monthly sales trends, product performance, and regional sales patterns.
Conclusion
Pandas groupby is a versatile and powerful tool for data analysis and manipulation. It allows you to efficiently aggregate, transform, and analyze data across various dimensions. By mastering pandas groupby, you can unlock deeper insights from your data and streamline your data analysis workflows.
 Pandas Dataframe