Mastering Pandas GroupBy Unique Count
Pandas groupby unique count is a powerful technique for data analysis and manipulation in Python. This article will dive deep into the intricacies of using pandas groupby with unique count operations, providing a comprehensive understanding of this essential functionality. We’ll explore various aspects of pandas groupby unique count, including its syntax, use cases, and best practices.
Understanding Pandas GroupBy Unique Count
Pandas groupby unique count is a combination of two important operations in the pandas library: groupby and unique count. The groupby operation allows you to split your data into groups based on one or more columns, while the unique count operation helps you count the number of unique values within each group. This combination is particularly useful when you need to analyze and summarize data based on specific categories or attributes.
Let’s start with a simple example to illustrate the concept of pandas groupby unique count:
import pandas as pd

# Create a sample DataFrame
df = pd.DataFrame({
    'Category': ['A', 'B', 'A', 'B', 'A', 'C'],
    'Product': ['X', 'Y', 'X', 'Z', 'Y', 'X'],
    'Sales': [100, 200, 150, 300, 250, 175]
})

# Perform groupby unique count
result = df.groupby('Category')['Product'].nunique()

print(result)
Output:
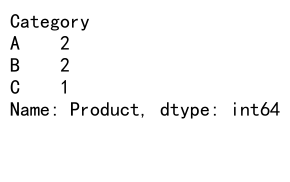
In this example, we create a DataFrame with three columns: Category, Product, and Sales. We then use pandas groupby unique count to count the number of unique products in each category. The nunique() function is used to count the unique values within each group.
The Power of Pandas GroupBy Unique Count
Pandas groupby unique count is a versatile tool that can be applied to various data analysis scenarios. It allows you to gain insights into your data by identifying patterns, trends, and distributions across different groups. Some common use cases for pandas groupby unique count include:
- Customer segmentation analysis
- Product diversity evaluation
- Geographic distribution analysis
- Time-based trend analysis
Let’s explore a more complex example to demonstrate the power of pandas groupby unique count:
import pandas as pd

# Create a sample DataFrame
df = pd.DataFrame({
    'Date': pd.date_range(start='2023-01-01', periods=100),
    'Customer': ['A', 'B', 'C', 'D', 'E'] * 20,
    'Product': ['X', 'Y', 'Z', 'W'] * 25,
    'Region': ['North', 'South', 'East', 'West'] * 25,
    'Sales': [100, 200, 150, 300, 250] * 20
})

# Perform groupby unique count
result = df.groupby(['Region', pd.Grouper(key='Date', freq='M')])['Customer'].nunique()

print(result)
In this example, we create a more complex DataFrame with date, customer, product, region, and sales information. We then use pandas groupby unique count to analyze the number of unique customers per region and month. The pd.Grouper function is used to group the data by month.
Advanced Techniques for Pandas GroupBy Unique Count
As you become more comfortable with pandas groupby unique count, you can explore advanced techniques to extract even more insights from your data. Let’s look at some advanced applications:
Multiple Column Grouping
Pandas groupby unique count allows you to group by multiple columns simultaneously. This is particularly useful when you want to analyze data across multiple dimensions:
import pandas as pd

# Create a sample DataFrame
df = pd.DataFrame({
    'Category': ['A', 'B', 'A', 'B', 'A', 'C'] * 5,
    'Subcategory': ['X', 'Y', 'Z'] * 10,
    'Product': ['P1', 'P2', 'P3', 'P4', 'P5'] * 6,
    'Sales': [100, 200, 150, 300, 250, 175] * 5
})

# Perform groupby unique count on multiple columns
result = df.groupby(['Category', 'Subcategory'])['Product'].nunique()

print(result)
Output:
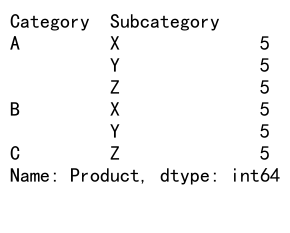
In this example, we group the data by both Category and Subcategory, then count the unique products within each group.
Combining Unique Count with Other Aggregations
You can combine unique count operations with other aggregation functions to get a more comprehensive view of your data:
import pandas as pd

# Create a sample DataFrame
df = pd.DataFrame({
    'Category': ['A', 'B', 'A', 'B', 'A', 'C'] * 5,
    'Product': ['X', 'Y', 'Z'] * 10,
    'Sales': [100, 200, 150, 300, 250, 175] * 5
})

# Combine unique count with other aggregations
result = df.groupby('Category').agg({
    'Product': 'nunique',
    'Sales': ['sum', 'mean']
})

print(result)
Output:
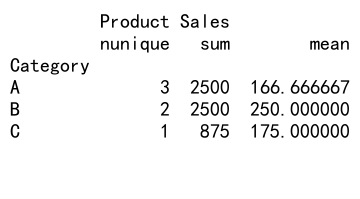
This example demonstrates how to combine the unique count of products with the sum and mean of sales for each category.
Handling Missing Values in Pandas GroupBy Unique Count
When working with real-world data, you’ll often encounter missing values. Pandas groupby unique count provides options for handling these scenarios:
import pandas as pd
import numpy as np

# Create a sample DataFrame with missing values
df = pd.DataFrame({
    'Category': ['A', 'B', 'A', 'B', 'A', 'C', 'C', np.nan],
    'Product': ['X', 'Y', 'X', 'Z', 'Y', 'X', np.nan, 'Z'],
    'Sales': [100, 200, 150, 300, 250, 175, 180, 220]
})

# Perform groupby unique count with dropna=False
result_with_na = df.groupby('Category', dropna=False)['Product'].nunique()

# Perform groupby unique count with dropna=True
result_without_na = df.groupby('Category', dropna=True)['Product'].nunique()

print("With NaN values:")
print(result_with_na)
print("\nWithout NaN values:")
print(result_without_na)
Output:
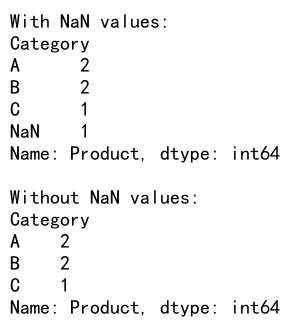
In this example, we demonstrate how to handle missing values using the dropna parameter in the groupby operation. Setting dropna=False includes NaN values as a separate group, while dropna=True excludes them.
Optimizing Performance in Pandas GroupBy Unique Count
When working with large datasets, optimizing the performance of pandas groupby unique count operations becomes crucial. Here are some techniques to improve efficiency:
Using Categorical Data Types
Converting string columns to categorical data types can significantly improve performance:
import pandas as pd

# Create a sample DataFrame
df = pd.DataFrame({
    'Category': ['A', 'B', 'A', 'B', 'A', 'C'] * 1000000,
    'Product': ['X', 'Y', 'Z'] * 2000000,
    'Sales': [100, 200, 150, 300, 250, 175] * 1000000
})

# Convert Category and Product to categorical
df['Category'] = df['Category'].astype('category')
df['Product'] = df['Product'].astype('category')

# Perform groupby unique count
result = df.groupby('Category')['Product'].nunique()

print(result)
By converting the ‘Category’ and ‘Product’ columns to categorical data types, we can significantly reduce memory usage and improve performance for large datasets.
Using Sorted Data
If your data is already sorted by the grouping column(s), you can use the sort=False parameter to avoid unnecessary sorting:
import pandas as pd

# Create a sample DataFrame (already sorted by Category)
df = pd.DataFrame({
    'Category': ['A', 'A', 'A', 'B', 'B', 'C'] * 1000000,
    'Product': ['X', 'Y', 'Z', 'X', 'Y', 'Z'] * 1000000,
    'Sales': [100, 200, 150, 300, 250, 175] * 1000000
})

# Perform groupby unique count with sort=False
result = df.groupby('Category', sort=False)['Product'].nunique()

print(result)
Output:
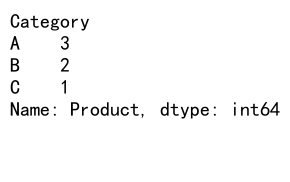
By setting sort=False, we avoid the overhead of sorting the data, which can be significant for large datasets.
Visualizing Pandas GroupBy Unique Count Results
Visualizing the results of pandas groupby unique count operations can help in better understanding and communicating insights. Let’s explore some visualization techniques:
Bar Plot
import pandas as pd
import matplotlib.pyplot as plt

# Create a sample DataFrame
df = pd.DataFrame({
    'Category': ['A', 'B', 'A', 'B', 'A', 'C'] * 5,
    'Product': ['X', 'Y', 'Z'] * 10,
    'Sales': [100, 200, 150, 300, 250, 175] * 5
})

# Perform groupby unique count
result = df.groupby('Category')['Product'].nunique()

# Create a bar plot
result.plot(kind='bar')
plt.title('Unique Products per Category')
plt.xlabel('Category')
plt.ylabel('Number of Unique Products')
plt.show()
Output:
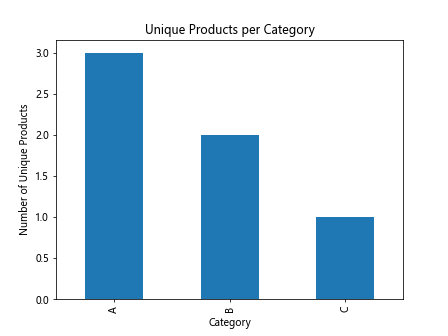
This example creates a bar plot to visualize the number of unique products in each category.
Heatmap
For multi-dimensional groupby unique count results, a heatmap can be an effective visualization:
import pandas as pd
import seaborn as sns
import matplotlib.pyplot as plt

# Create a sample DataFrame
df = pd.DataFrame({
    'Category': ['A', 'B', 'A', 'B', 'A', 'C'] * 5,
    'Subcategory': ['X', 'Y', 'Z'] * 10,
    'Product': ['P1', 'P2', 'P3', 'P4', 'P5'] * 6,
    'Sales': [100, 200, 150, 300, 250, 175] * 5
})

# Perform groupby unique count
result = df.groupby(['Category', 'Subcategory'])['Product'].nunique().unstack()

# Create a heatmap
sns.heatmap(result, annot=True, cmap='YlGnBu')
plt.title('Unique Products per Category and Subcategory')
plt.show()
Output:
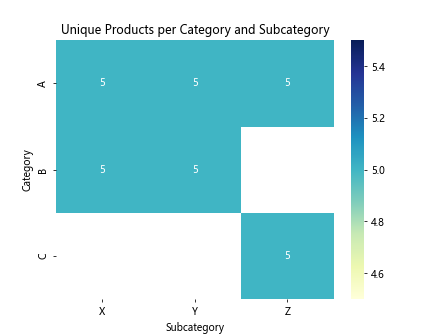
This example creates a heatmap to visualize the number of unique products across categories and subcategories.
Common Pitfalls and Best Practices in Pandas GroupBy Unique Count
While pandas groupby unique count is a powerful tool, there are some common pitfalls to avoid and best practices to follow:
Handling Large Datasets
When working with large datasets, memory management becomes crucial. Consider using chunking or iterative processing:
import pandas as pd

# Function to process chunks
def process_chunk(chunk):
    return chunk.groupby('Category')['Product'].nunique()

# Read and process data in chunks
chunk_size = 1000000
result = pd.DataFrame()

for chunk in pd.read_csv('large_dataset.csv', chunksize=chunk_size):
    chunk_result = process_chunk(chunk)
    result = result.add(chunk_result, fill_value=0)

print(result)
This example demonstrates how to process a large CSV file in chunks, performing groupby unique count on each chunk and aggregating the results.
Dealing with Duplicate Index Values
When using multiple columns for grouping, you may encounter duplicate index values. Use reset_index() to avoid confusion:
import pandas as pd

# Create a sample DataFrame
df = pd.DataFrame({
    'Category': ['A', 'B', 'A', 'B', 'A', 'C'] * 2,
    'Subcategory': ['X', 'Y', 'Z'] * 4,
    'Product': ['P1', 'P2', 'P3', 'P4', 'P5', 'P6'] * 2,
    'Sales': [100, 200, 150, 300, 250, 175] * 2
})

# Perform groupby unique count and reset index
result = df.groupby(['Category', 'Subcategory'])['Product'].nunique().reset_index()

print(result)
Output:
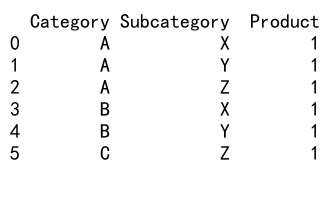
By using reset_index(), we convert the multi-index result into a flat DataFrame, which is often easier to work with.
Advanced Applications of Pandas GroupBy Unique Count
Let’s explore some advanced applications of pandas groupby unique count to solve real-world problems:
Time Series Analysis
Pandas groupby unique count can be particularly useful for time series analysis:
import pandas as pd

# Create a sample DataFrame with time series data
df = pd.DataFrame({
    'Date': pd.date_range(start='2023-01-01', periods=365),
    'Customer': ['A', 'B', 'C', 'D', 'E'] * 73,
    'Product': ['X', 'Y', 'Z', 'W'] * 91 + ['X'],
    'Sales': [100, 200, 150, 300, 250] * 73
})

# Perform groupby unique count by week
result = df.groupby(pd.Grouper(key='Date', freq='W'))['Customer'].nunique()

print(result)
Output:
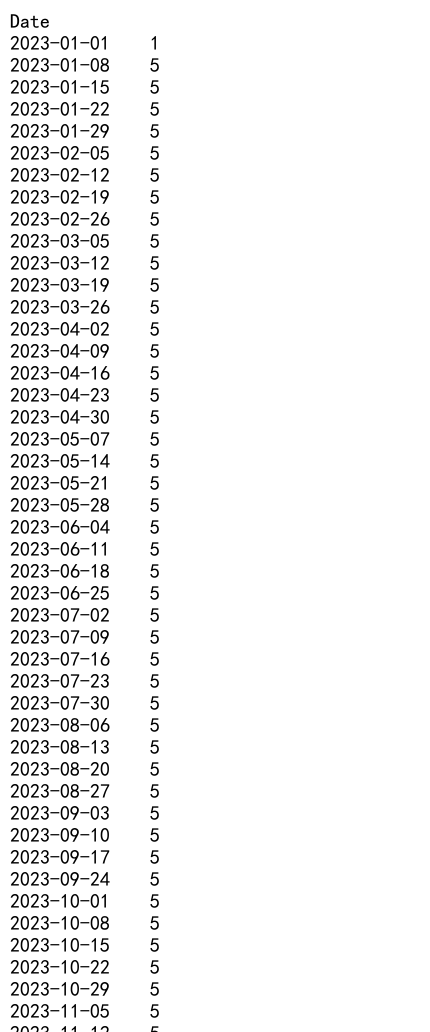
This example demonstrates how to use pandas groupby unique count to analyze the number of unique customers per week over a year.
Hierarchical Data Analysis
For hierarchical data structures, pandas groupby unique count can be combined with multi-level indexing:
import pandas as pd

# Create a sample DataFrame with hierarchical data
df = pd.DataFrame({
    'Region': ['North', 'North', 'South', 'South', 'East', 'East', 'West', 'West'] * 5,
    'State': ['NY', 'NJ', 'FL', 'GA', 'MA', 'CT', 'CA', 'OR'] * 5,
    'City': ['A', 'B', 'C', 'D', 'E', 'F', 'G', 'H'] * 5,
    'Product': ['X', 'Y', 'Z', 'W'] * 10,
    'Sales': [100, 200, 150, 300, 250, 175, 225, 275] * 5
})

# Perform hierarchical groupby unique count
result = df.groupby(['Region', 'State'])['Product'].nunique().unstack(level=0)

print(result)
Output:
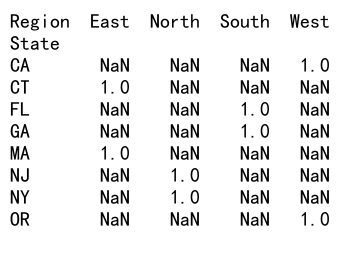
This example shows how to use pandas groupby unique count to analyze the number of unique products across regions and states in a hierarchical structure.
Combining Pandas GroupBy Unique Count with Other Pandas Functions
Pandas groupby unique count can be combined with other pandas functions to perform more complex analyses:
Filtering Groups
You can filter groups based on the unique count results:
import pandas as pd

# Create a sample DataFrame
df = pd.DataFrame({
    'Category': ['A', 'B', 'A', 'B', 'A', 'C'] * 5,
    'Product': ['X', 'Y', 'Z', 'W', 'V'] * 6,
    'Sales': [100, 200, 150, 300, 250, 175] * 5
})

# Filter groups with more than 3 unique products
result = df.groupby('Category').filter(lambda x: x['Product'].nunique() > 3)

print(result)
Output:
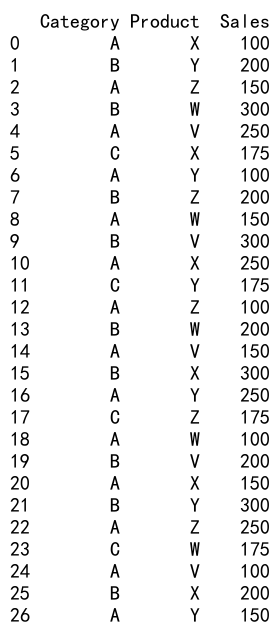
This example demonstrates how to filter groups based on the number of unique products, keeping only categories with more than 3 unique products.
Applying Custom Functions
You can apply custom functions to grouped data:
import pandas as pd

# Create a sample DataFrame
df = pd.DataFrame({
    'Category': ['A', 'B', 'A', 'B', 'A', 'C'] * 5,
    'Product': ['X', 'Y','Z', 'W', 'V'] * 6,
    'Sales': [100, 200, 150, 300, 250, 175] * 5
})

# Define a custom function
def unique_ratio(group):
    return group['Product'].nunique() / len(group)

# Apply the custom function
result = df.groupby('Category').apply(unique_ratio)

print(result)
This example shows how to apply a custom function to calculate the ratio of unique products to total products for each category.
Pandas GroupBy Unique Count in Data Science Workflows
Pandas groupby unique count is an essential tool in many data science workflows. Let’s explore some common applications:
Feature Engineering
In machine learning projects, pandas groupby unique count can be used for feature engineering:
import pandas as pd

# Create a sample DataFrame
df = pd.DataFrame({
    'Customer': ['A', 'B', 'C', 'A', 'B', 'C'] * 5,
    'Product': ['X', 'Y', 'Z', 'W', 'V', 'U'] * 5,
    'Category': ['Cat1', 'Cat2', 'Cat3'] * 10,
    'Purchase': [1, 0, 1, 1, 0, 1] * 5
})

# Create a new feature: number of unique products purchased by each customer
df['UniqueProductCount'] = df.groupby('Customer')['Product'].transform('nunique')

print(df.head(10))
Output:
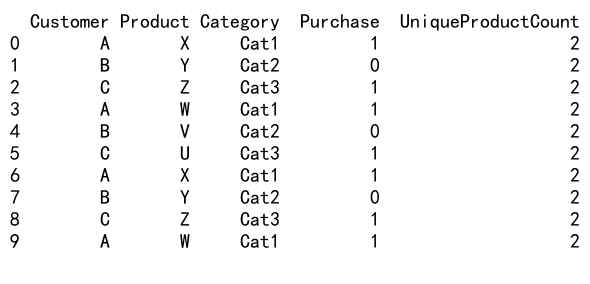
This example demonstrates how to create a new feature that represents the number of unique products purchased by each customer.
Anomaly Detection
Pandas groupby unique count can be useful in identifying anomalies in data:
import pandas as pd
import numpy as np

# Create a sample DataFrame
df = pd.DataFrame({
    'Date': pd.date_range(start='2023-01-01', periods=100),
    'User': np.random.choice(['A', 'B', 'C', 'D', 'E'], 100),
    'Action': np.random.choice(['Login', 'Logout', 'Purchase', 'View'], 100)
})

# Add some anomalies
df.loc[95:99, 'User'] = 'F'
df.loc[95:99, 'Action'] = 'Hack'

# Detect anomalies based on unique action count
daily_unique_actions = df.groupby(['Date', 'User'])['Action'].nunique()
anomalies = daily_unique_actions[daily_unique_actions > 3]

print("Potential anomalies:")
print(anomalies)
Output:

This example shows how to use pandas groupby unique count to detect potential anomalies by identifying users with an unusually high number of unique actions per day.
Optimizing Pandas GroupBy Unique Count for Big Data
When dealing with big data, optimizing pandas groupby unique count operations becomes crucial. Here are some advanced techniques:
Using Dask for Distributed Computing
For extremely large datasets that don’t fit in memory, you can use Dask, a flexible library for parallel computing:
import dask.dataframe as dd

# Read a large CSV file into a Dask DataFrame
ddf = dd.read_csv('very_large_dataset.csv')

# Perform groupby unique count
result = ddf.groupby('Category')['Product'].nunique().compute()

print(result)
This example demonstrates how to use Dask to perform a groupby unique count operation on a very large dataset that doesn’t fit in memory.
Using SQL Databases
For datasets stored in SQL databases, you can leverage the database’s capabilities:
import pandas as pd
import sqlite3

# Connect to the database
conn = sqlite3.connect('pandasdataframe.com.db')

# Execute SQL query
query = """
SELECT Category, COUNT(DISTINCT Product) as UniqueProducts
FROM sales
GROUP BY Category
"""
result = pd.read_sql_query(query, conn)

print(result)
This example shows how to perform a groupby unique count operation directly in SQL and retrieve the results as a pandas DataFrame.
Pandas GroupBy Unique Count in Real-World Scenarios
Let’s explore some real-world scenarios where pandas groupby unique count can be particularly useful:
Customer Segmentation
import pandas as pd

# Create a sample customer transaction DataFrame
df = pd.DataFrame({
    'CustomerID': ['A', 'B', 'C', 'A', 'B', 'D'] * 10,
    'Product': ['X', 'Y', 'Z', 'W', 'V', 'U'] * 10,
    'Category': ['Cat1', 'Cat2', 'Cat3', 'Cat1', 'Cat2', 'Cat3'] * 10,
    'PurchaseAmount': [100, 200, 150, 300, 250, 175] * 10
})

# Perform customer segmentation based on unique product categories
customer_segments = df.groupby('CustomerID').agg({
    'Category': 'nunique',
    'Product': 'nunique',
    'PurchaseAmount': 'sum'
}).rename(columns={
    'Category': 'UniqueCategoriesCount',
    'Product': 'UniqueProductsCount',
    'PurchaseAmount': 'TotalPurchaseAmount'
})

print(customer_segments)
Output:

This example demonstrates how to use pandas groupby unique count for customer segmentation based on the number of unique product categories and products purchased.
Geographic Analysis
import pandas as pd

# Create a sample sales DataFrame
df = pd.DataFrame({
    'Country': ['USA', 'Canada', 'UK', 'USA', 'Canada', 'UK'] * 10,
    'State': ['NY', 'ON', 'London', 'CA', 'BC', 'Manchester'] * 10,
    'Product': ['X', 'Y', 'Z', 'W', 'V', 'U'] * 10,
    'SalesAmount': [100, 200, 150, 300, 250, 175] * 10
})

# Perform geographic analysis
geographic_analysis = df.groupby(['Country', 'State']).agg({
    'Product': 'nunique',
    'SalesAmount': 'sum'
}).rename(columns={
    'Product': 'UniqueProductsCount',
    'SalesAmount': 'TotalSalesAmount'
})

print(geographic_analysis)
Output:
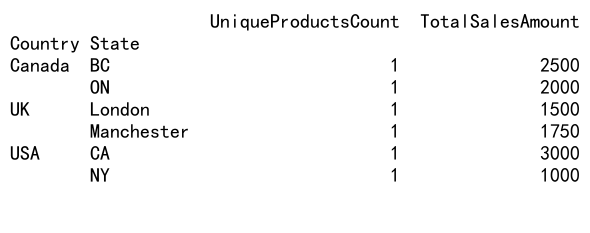
This example shows how to use pandas groupby unique count for geographic analysis of sales data, providing insights into product diversity and total sales across different regions.
Advanced Pandas GroupBy Unique Count Techniques
Let’s explore some advanced techniques that combine pandas groupby unique count with other powerful pandas features:
Rolling Window Analysis
import pandas as pd

# Create a sample time series DataFrame
df = pd.DataFrame({
    'Date': pd.date_range(start='2023-01-01', periods=100),
    'Product': ['X', 'Y', 'Z', 'W'] * 25,
    'Sales': [100, 200, 150, 300] * 25
})

# Set Date as index
df.set_index('Date', inplace=True)

# Perform rolling window analysis
rolling_unique_products = df.groupby(pd.Grouper(freq='7D'))['Product'].nunique().rolling(window=4).mean()

print(rolling_unique_products)
Output:
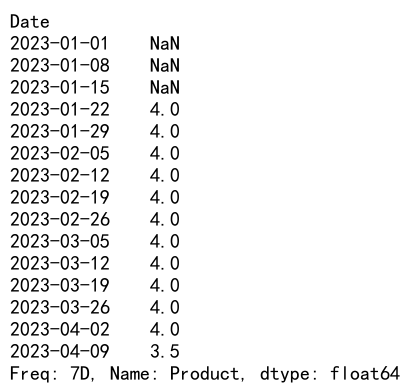
This example demonstrates how to combine pandas groupby unique count with rolling window analysis to calculate the moving average of unique products over time.
Pivot Tables with Unique Count
import pandas as pd

# Create a sample DataFrame
df = pd.DataFrame({
    'Category': ['A', 'B', 'C'] * 10,
    'Subcategory': ['X', 'Y', 'Z'] * 10,
    'Product': ['P1', 'P2', 'P3', 'P4', 'P5'] * 6,
    'Sales': [100, 200, 150, 300, 250] * 6
})

# Create a pivot table with unique count
pivot_table = pd.pivot_table(df, values='Product', index='Category', columns='Subcategory', aggfunc='nunique')

print(pivot_table)
Output:
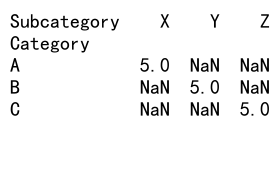
This example shows how to create a pivot table using pandas groupby unique count to analyze the number of unique products across categories and subcategories.
Conclusion
Pandas groupby unique count is a powerful and versatile tool for data analysis and manipulation. Throughout this comprehensive guide, we’ve explored various aspects of this functionality, from basic usage to advanced techniques and real-world applications. By mastering pandas groupby unique count, you can unlock valuable insights from your data, perform complex analyses, and solve a wide range of data-related problems.
 Pandas Dataframe