Pandas Correlation Between Two Data Frames
Correlation analysis is a vital statistical tool that helps to understand the relationship between two sets of data. In the context of data science and analytics, correlation is used to determine how closely related two variables are. Pandas, a powerful data manipulation library in Python, provides several methods to compute correlations between columns in data frames. This article will explore how to calculate and interpret correlations between two different pandas DataFrames.
Understanding Correlation
Correlation measures the degree to which two variables move in relation to each other. Correlation coefficients can range from -1 to 1. A correlation of 1 implies a perfect positive relationship, -1 implies a perfect negative relationship, and 0 implies no relationship at all.
Types of Correlation Coefficients
- Pearson’s Correlation: Measures linear correlation between two variables.
- Spearman’s Rank Correlation: Non-parametric measure of rank correlation.
- Kendall’s Tau: Another non-parametric measure that assesses relationships based on the ranks of data.
Setting Up Your Environment
Before diving into the examples, ensure you have pandas installed in your Python environment:
pip install pandas
Example Code Snippets
Here are several examples of how to compute and interpret correlations between two pandas DataFrames.
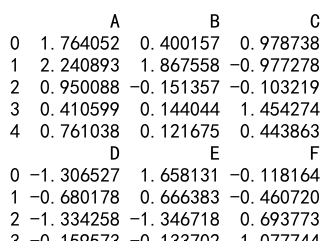
Example 1: Creating DataFrames
import pandas as pd
import numpy as np

# Create two data frames with random data
np.random.seed(0)
df1 = pd.DataFrame(np.random.randn(100, 3), columns=['A', 'B', 'C'])
df2 = pd.DataFrame(np.random.randn(100, 3), columns=['D', 'E', 'F'])

print(df1.head())
print(df2.head())
Output:
Example 2: Pearson Correlation
import pandas as pd
import numpy as np

# Create two data frames with random data
np.random.seed(0)
df1 = pd.DataFrame(np.random.randn(100, 3), columns=['A', 'B', 'C'])
df2 = pd.DataFrame(np.random.randn(100, 3), columns=['D', 'E', 'F'])

# Compute Pearson correlation between DataFrame df1 and df2
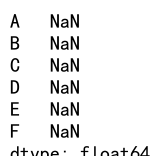
correlation_matrix = df1.corrwith(df2, axis=0, method='pearson')
print(correlation_matrix)
Output:
Example 3: Spearman Correlation
import pandas as pd
import numpy as np

# Create two data frames with random data
np.random.seed(0)
df1 = pd.DataFrame(np.random.randn(100, 3), columns=['A', 'B', 'C'])
df2 = pd.DataFrame(np.random.randn(100, 3), columns=['D', 'E', 'F'])

# Compute Spearman correlation between DataFrame df1 and df2
correlation_matrix = df1.corrwith(df2, axis=0, method='spearman')
print(correlation_matrix)
Example 4: Visualizing Correlation Matrix
import seaborn as sns
import matplotlib.pyplot as plt
import pandas as pd
import numpy as np

# Create two data frames with random data
np.random.seed(0)
df1 = pd.DataFrame(np.random.randn(100, 3), columns=['A', 'B', 'C'])
df2 = pd.DataFrame(np.random.randn(100, 3), columns=['D', 'E', 'F'])

# Combine the data frames
combined_df = pd.concat([df1, df2], axis=1)

# Compute the correlation matrix
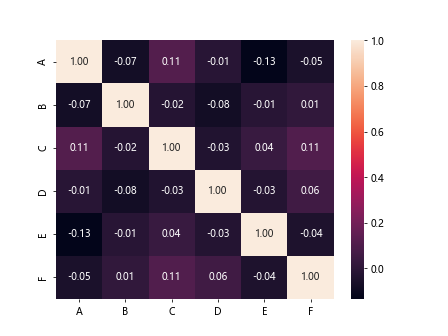
corr = combined_df.corr()

# Generate a heatmap
sns.heatmap(corr, annot=True, fmt=".2f")
plt.show()
Output:
Example 5: Handling Missing Data
import pandas as pd
import numpy as np

# Create two data frames with random data
np.random.seed(0)
df1 = pd.DataFrame(np.random.randn(100, 3), columns=['A', 'B', 'C'])
df2 = pd.DataFrame(np.random.randn(100, 3), columns=['D', 'E', 'F'])

# Introduce some missing values
df1.loc[0:10, 'A'] = np.nan

# Compute Pearson correlation, omitting missing values
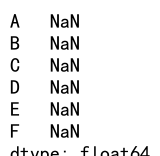
correlation_matrix = df1.corrwith(df2, axis=0, method='pearson')
print(correlation_matrix)
Output:
Example 6: Correlation of Selected Columns
import pandas as pd
import numpy as np

# Create two data frames with random data
np.random.seed(0)
df1 = pd.DataFrame(np.random.randn(100, 3), columns=['A', 'B', 'C'])
df2 = pd.DataFrame(np.random.randn(100, 3), columns=['D', 'E', 'F'])

# Compute correlation between selected columns from df1 and df2
correlation_value = df1['A'].corr(df2['D'], method='pearson')
print(correlation_value)
Output:

Example 7: Correlation with a Lag
import pandas as pd
import numpy as np

# Create two data frames with random data
np.random.seed(0)
df1 = pd.DataFrame(np.random.randn(100, 3), columns=['A', 'B', 'C'])
df2 = pd.DataFrame(np.random.randn(100, 3), columns=['D', 'E', 'F'])

# Compute correlation with a lag
df1['A_lag'] = df1['A'].shift(1)
correlation_value = df1['A_lag'].corr(df2['D'])
print(correlation_value)
Output:

Example 8: Correlation in a Rolling Window
import pandas as pd
import numpy as np

# Create two data frames with random data
np.random.seed(0)
df1 = pd.DataFrame(np.random.randn(100, 3), columns=['A', 'B', 'C'])
df2 = pd.DataFrame(np.random.randn(100, 3), columns=['D', 'E', 'F'])

# Compute rolling correlation
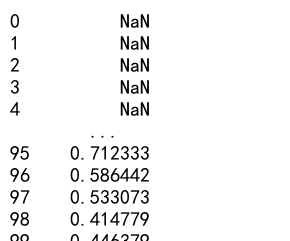
rolling_corr = df1['A'].rolling(window=10).corr(df2['D'])
print(rolling_corr)
Output:
Pandas Correlation Between Two Data Frames Conclusion
This article has provided a comprehensive guide on how to compute and interpret correlations between two pandas DataFrames. By understanding and utilizing the correlation methods provided by pandas, data scientists and analysts can uncover valuable insights into the relationships between different datasets.
 Pandas Dataframe