Pandas Unique Values
Pandas is an essential library for data manipulation and analysis in Python. One of its most powerful features is the ability to handle and analyze unique values in datasets. Unique values are crucial in many data analysis tasks, including data cleaning, summarization, and feature engineering. This article will explore how to work with unique values in Pandas, providing detailed explanations and numerous examples to illustrate the concepts.
1. Introduction to Pandas
Pandas is a fast, powerful, flexible, and easy-to-use open-source data analysis and data manipulation library built on top of the Python programming language. It provides data structures and functions needed to work on structured data seamlessly.
Pandas introduce two main data structures: Series and DataFrame.
- Series: A one-dimensional labeled array capable of holding any data type.
- DataFrame: A two-dimensional labeled data structure with columns that can be of different data types.
Pandas is well-integrated with other libraries in the Python ecosystem, such as NumPy, SciPy, Matplotlib, and more.
2. What are Unique Values?
Unique values refer to the distinct elements within a dataset. For instance, in a dataset of names, the unique values would be the distinct names present in the list. Understanding and identifying unique values are essential for several reasons:
- Data Cleaning: Identifying and handling duplicates.
- Data Summarization: Understanding the diversity of data.
- Feature Engineering: Creating new features based on unique values.
3. Using unique() Function
The unique() function in Pandas returns the unique values present in a Series or a DataFrame. This function is handy for quickly finding the distinct elements.
Example Code 1
import pandas as pd

# Create a sample DataFrame
data = {
    'A': [1, 2, 2, 4, 5, 5, 6],
    'B': ['apple', 'banana', 'apple', 'banana', 'cherry', 'cherry', 'cherry']
}
df = pd.DataFrame(data)

# Find unique values in column 'A'
unique_values_A = df['A'].unique()
print("Unique values in column 'A':", unique_values_A)

# Find unique values in column 'B'
unique_values_B = df['B'].unique()
print("Unique values in column 'B':", unique_values_B)
Output:

In this example, the unique() function is used to find the unique values in columns ‘A’ and ‘B’ of the DataFrame. The output shows the distinct values present in each column.
4. Using nunique() Function
The nunique() function returns the number of unique values in a Series or DataFrame. This function is useful when you need to know the count of distinct elements rather than the elements themselves.
Example Code 2
import pandas as pd

# Create a sample DataFrame
data = {
    'A': [1, 2, 2, 4, 5, 5, 6],
    'B': ['apple', 'banana', 'apple', 'banana', 'cherry', 'cherry', 'cherry']
}
df = pd.DataFrame(data)

# Find the number of unique values in column 'A'
nunique_A = df['A'].nunique()
print("Number of unique values in column 'A':", nunique_A)

# Find the number of unique values in column 'B'
nunique_B = df['B'].nunique()
print("Number of unique values in column 'B':", nunique_B)
Output:

This example demonstrates how to use the nunique() function to count the number of unique values in columns ‘A’ and ‘B’. The output provides the count of distinct values.
5. Using drop_duplicates() Function
The drop_duplicates() function removes duplicate rows from a DataFrame. This function is useful for data cleaning tasks where you need to ensure that each row in the DataFrame is unique.
Example Code 3
import pandas as pd

# Create a sample DataFrame
data = {
    'A': [1, 2, 2, 4, 5, 5, 6],
    'B': ['apple', 'banana', 'apple', 'banana', 'cherry', 'cherry', 'cherry']
}
df = pd.DataFrame(data)

# Drop duplicate rows
df_unique = df.drop_duplicates()
print("DataFrame after dropping duplicates:")
print(df_unique)
Output:

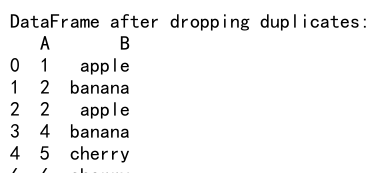
In this example, the drop_duplicates() function removes duplicate rows from the DataFrame. The resulting DataFrame contains only unique rows.
6. Finding Unique Values in a DataFrame
Finding unique values across an entire DataFrame can be achieved using a combination of functions. This is particularly useful when dealing with datasets with multiple columns.
Example Code 4
import pandas as pd

# Create a sample DataFrame
data = {
    'A': [1, 2, 2, 4, 5, 5, 6],
    'B': ['apple', 'banana', 'apple', 'banana', 'cherry', 'cherry', 'cherry']
}
df = pd.DataFrame(data)

# Find unique values in the entire DataFrame
unique_values = {col: df[col].unique() for col in df.columns}
print("Unique values in the DataFrame:")
print(unique_values)
Output:

This example demonstrates how to find unique values in each column of a DataFrame using a dictionary comprehension. The output provides a dictionary where keys are column names and values are arrays of unique values.
7. Working with Unique Values in Series
Pandas Series, being one-dimensional, have unique value operations similar to those for DataFrame columns. The unique() and nunique() functions can be used directly on Series objects.
Example Code 5
import pandas as pd

# Create a sample Series
series = pd.Series([1, 2, 2, 4, 5, 5, 6, 6])

# Find unique values in the Series
unique_values_series = series.unique()
print("Unique values in the Series:", unique_values_series)

# Find the number of unique values in the Series
nunique_series = series.nunique()
print("Number of unique values in the Series:", nunique_series)
Output:

In this example, the unique() and nunique() functions are used to find the unique values and their count in a Pandas Series.
8. Unique Values with Conditions
Sometimes, you may need to find unique values that meet specific conditions. This can be achieved using conditional filtering.
Example Code 6
import pandas as pd

# Create a sample DataFrame
data = {
    'A': [1, 2, 2, 4, 5, 5, 6],
    'B': ['apple', 'banana', 'apple', 'banana', 'cherry', 'cherry', 'cherry']
}
df = pd.DataFrame(data)

# Find unique values in column 'A' where 'B' is 'cherry'
unique_values_condition = df[df['B'] == 'cherry']['A'].unique()
print("Unique values in column 'A' where 'B' is 'cherry':", unique_values_condition)
Output:

This example demonstrates how to use conditional filtering to find unique values in column ‘A’ where the values in column ‘B’ are ‘cherry’. The output provides the distinct values in column ‘A’ that meet the condition.
9. Combining Unique Value Functions
Combining different unique value functions can provide more complex and informative results. For instance, you can use unique(), nunique(), and drop_duplicates() together to gain deeper insights.
Example Code 7
import pandas as pd

# Create a sample DataFrame
data = {
    'A': [1, 2, 2, 4, 5, 5, 6],
    'B': ['apple', 'banana', 'apple', 'banana', 'cherry', 'cherry', 'cherry']
}
df = pd.DataFrame(data)

# Find unique values in column 'A'
unique_values_A = df['A'].unique()
print("Unique values in column 'A':", unique_values_A)

# Count unique values in column 'B'
nunique_B = df['B'].nunique()
print("Number of unique values in column 'B':", nunique_B)

# Drop duplicate rows
df_unique = df.drop_duplicates()
print("DataFrame after dropping duplicates:")
print(df_unique)
Output:

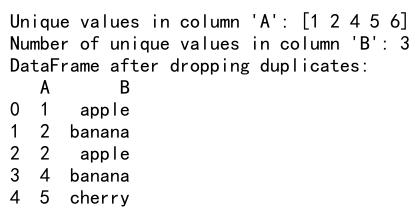
This example shows how to combine different unique value functions to extract and manipulate unique data from a DataFrame. The output includes unique values, their count, and a DataFrame without duplicate rows.
10. Advanced Techniques with Unique Values
Advanced techniques involve using unique value functions in more complex scenarios, such as with groupby operations, pivot tables, or merging DataFrames.
Example Code 8
import pandas as pd

# Create sample DataFrames
data1 = {
    'key': ['A', 'B', 'C', 'D'],
    'value': [1, 2, 3, 4]
}
data2 = {
    'key': ['A', 'B', 'C', 'D'],
    'value': [4, 3, 2, 1]
}
df1 = pd.DataFrame(data1)
df2 = pd.DataFrame(data2)

# Merge DataFrames on 'key' and find unique values in 'value' column
merged_df = pd.merge(df1, df2, on='key', suffixes=('_left', '_right'))
unique_values_merged = merged_df[['value_left', 'value_right']].stack().unique()
print("Unique values in merged DataFrame:")
print(unique_values_merged)
Output:

In this example, two DataFrames are merged on the ‘key’ column. The unique values in the ‘value’ columns of the merged DataFrame are then found using the unique() function.
Example Code 9
import pandas as pd

# Create a sample DataFrame
data = {
    'A': [1, 2, 2, 4, 5, 5, 6],
    'B': ['apple', 'banana', 'apple', 'banana', 'cherry', 'cherry', 'cherry']
}
df = pd.DataFrame(data)

# Find unique values in column 'A' and create a new DataFrame
unique_values_df = pd.DataFrame(df['A'].unique(), columns=['Unique_Values'])
print("New DataFrame with unique values from column 'A':")
print(unique_values_df)
Output:

This example creates a new DataFrame from the unique values found in column ‘A’. This technique is useful for further analysis or visualization of unique values.
 Pandas Dataframe