Pandas Aggregation and Counting Rows
Pandas is a powerful library in Python used for data manipulation and analysis. In this article, we will explore how to use the agg function and various ways to count rows in a DataFrame. This will include detailed examples of operations that can be performed using Pandas, focusing on aggregation and counting techniques.
Introduction to Pandas DataFrame
A DataFrame is a two-dimensional, size-mutable, potentially heterogeneous tabular data structure with labeled axes (rows and columns). Before diving into the specifics of aggregation and counting, let’s first understand how to create a DataFrame.
Example 1: Creating a DataFrame
import pandas as pd

data = {
    'Website': ['pandasdataframe.com', 'pandasdataframe.com', 'pandasdataframe.com'],
    'Visitors': [1200, 1300, 1250],
    'Bounce_Rate': [20, 25, 22]
}

df = pd.DataFrame(data)
print(df)
Output:

Aggregation with agg
The agg function in Pandas allows you to perform a variety of aggregate operations on your DataFrame. It can be used to apply one or more operations over the specified axis.
Example 2: Using agg to Compute Sum and Mean
import pandas as pd

data = {
    'Website': ['pandasdataframe.com', 'pandasdataframe.com', 'pandasdataframe.com'],
    'Visitors': [1200, 1300, 1250],
    'Bounce_Rate': [20, 25, 22]
}

df = pd.DataFrame(data)
result = df.agg({'Visitors': ['sum', 'mean'], 'Bounce_Rate': ['mean']})
print(result)
Output:

Example 3: Custom Aggregation Function
import pandas as pd

data = {
    'Website': ['pandasdataframe.com', 'pandasdataframe.com', 'pandasdataframe.com'],
    'Visitors': [1200, 1300, 1250],
    'Bounce_Rate': [20, 25, 22]
}

df = pd.DataFrame(data)

def custom_agg(x):
    return x.max() - x.min()

result = df.agg({'Visitors': custom_agg, 'Bounce_Rate': custom_agg})
print(result)
Output:

Counting Rows in DataFrame
Counting rows in a DataFrame is a common task, which can be achieved using several methods depending on the requirement.
Example 4: Counting All Rows
import pandas as pd

data = {
    'Website': ['pandasdataframe.com', 'pandasdataframe.com', 'pandasdataframe.com'],
    'Visitors': [1200, 1300, 1250],
    'Bounce_Rate': [20, 25, 22]
}

df = pd.DataFrame(data)
total_rows = len(df)
print(total_rows)
Output:

Example 5: Counting Rows with Condition
import pandas as pd

data = {
    'Website': ['pandasdataframe.com', 'pandasdataframe.com', 'pandasdataframe.com'],
    'Visitors': [1200, 1300, 1250],
    'Bounce_Rate': [20, 25, 22]
}

df = pd.DataFrame(data)
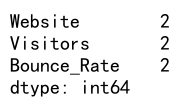
count_condition = df[df['Visitors'] > 1200].count()
print(count_condition)
Output:

Example 6: Counting Non-NA Cells
import pandas as pd

data = {
    'Website': ['pandasdataframe.com', 'pandasdataframe.com', 'pandasdataframe.com'],
    'Visitors': [1200, 1300, None],
    'Bounce_Rate': [20, 25, 22]
}

df = pd.DataFrame(data)
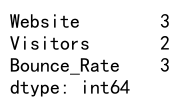
non_na_count = df.count()
print(non_na_count)
Output:

Advanced Aggregation Techniques
Advanced aggregation techniques involve using multiple functions on multiple columns, custom-defined functions, and more.
Example 7: Multiple Aggregations on Multiple Columns
import pandas as pd

data = {
    'Website': ['pandasdataframe.com', 'pandasdataframe.com', 'pandasdataframe.com'],
    'Visitors': [1200, 1300, 1250],
    'Bounce_Rate': [20, 25, 22]
}

df = pd.DataFrame(data)
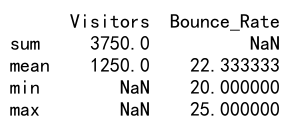
result = df.agg({'Visitors': ['sum', 'mean'], 'Bounce_Rate': ['min', 'max', 'mean']})
print(result)
Output:

Example 8: Using groupby with agg
import pandas as pd

data = {
    'Website': ['pandasdataframe.com', 'pandasdataframe.com', 'pandasdataframe.com'],
    'Month': ['January', 'February', 'January'],
    'Visitors': [1200, 1300, 1250],
    'Bounce_Rate': [20, 25, 22]
}

df = pd.DataFrame(data)
grouped = df.groupby('Month')
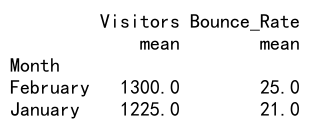
result = grouped.agg({'Visitors': ['mean'], 'Bounce_Rate': ['mean']})
print(result)
Output:

Example 9: Reset Index after Grouping
import pandas as pd

data = {
    'Website': ['pandasdataframe.com', 'pandasdataframe.com', 'pandasdataframe.com'],
    'Month': ['January', 'February', 'January'],
    'Visitors': [1200, 1300, 1250],
    'Bounce_Rate': [20, 25, 22]
}

df = pd.DataFrame(data)
grouped = df.groupby('Month').agg({'Visitors': ['mean'], 'Bounce_Rate': ['mean']}).reset_index()
print(grouped)
Output:

Pandas agg count rows conclusion
In this article, we explored various ways to aggregate and count rows in a Pandas DataFrame. We covered the use of the agg function for simple and complex aggregation tasks, and different methods to count rows, including conditions and handling missing values. These techniques are essential for data analysis and can be applied to a wide range of data processing tasks.
 Pandas Dataframe