Pandas Correlation Coefficient
Introduction
The correlation coefficient is a statistical measure that calculates the strength of the relationship between the relative movements of two variables. Pandas, a powerful data manipulation library in Python, provides various functionalities to calculate and analyze the correlation between different variables in a DataFrame. In this article, we will explore the concept of the correlation coefficient in detail, understand how to compute it using Pandas, and demonstrate its application through a variety of examples.
What is a Correlation Coefficient?
The correlation coefficient is a value between -1 and 1 that measures the degree to which two variables move in relation to each other. A correlation of 1 indicates that the variables move in perfect unison, -1 indicates that they move in exact opposite directions, and 0 indicates no relationship between the movements of the variables.
Types of Correlation Coefficients
There are several types of correlation coefficients, including:
- Pearson Correlation Coefficient: Measures linear correlation between two variables.
- Spearman Rank Correlation: Measures the monotonic relationship between two variables using ranks.
- Kendall Tau Correlation: Measures the ordinal association between two variables.
Computing Correlation in Pandas
Pandas provides a simple and efficient way to compute the correlation coefficients between variables in a DataFrame. The primary method used is DataFrame.corr(), which computes the pairwise correlation of columns.
Pearson Correlation Coefficient
The Pearson correlation coefficient measures the linear relationship between two variables. It is the most commonly used method and is calculated using the formula:
\rho_{X,Y} = \frac{\text{cov}(X,Y)}{\sigma_X \sigma_Y}
Example Code: Pearson Correlation Coefficient
import pandas as pd

# Sample DataFrame
data = {
    'A': [1, 2, 3, 4, 5],
    'B': [5, 4, 3, 2, 1],
    'C': [2, 3, 4, 5, 6]
}
df = pd.DataFrame(data)

# Calculate Pearson correlation coefficient
correlation = df.corr(method='pearson')
print(f"Pearson correlation coefficient:\n{correlation}\npandasdataframe.com")
Output:
Explanation
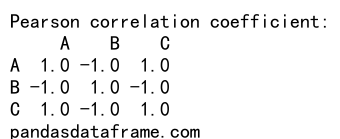
In the code above, we create a DataFrame with three columns: A, B, and C. We then use the corr() method with the method='pearson' parameter to compute the Pearson correlation coefficient for each pair of columns. The result is a DataFrame where each entry represents the Pearson correlation coefficient between two columns.
Spearman Rank Correlation
The Spearman rank correlation measures the monotonic relationship between two variables using the ranks of the data rather than their raw values. It is computed as:
\rho = 1 – \frac{6 \sum d_i^2}{n(n^2 – 1)}
Example Code: Spearman Rank Correlation
import pandas as pd

# Sample DataFrame
data = {
    'X': [10, 20, 30, 40, 50],
    'Y': [50, 40, 30, 20, 10],
    'Z': [15, 25, 35, 45, 55]
}
df = pd.DataFrame(data)

# Calculate Spearman rank correlation
correlation = df.corr(method='spearman')
print(f"Spearman rank correlation coefficient:\n{correlation}\npandasdataframe.com")
Output:
Explanation
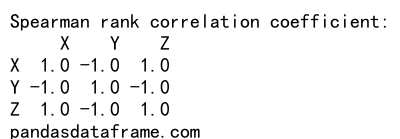
Here, we create a DataFrame with three columns: X, Y, and Z. We then calculate the Spearman rank correlation coefficient using the corr() method with method='spearman'. This method evaluates the correlation based on the ranks of the values, rather than the actual values themselves.
Kendall Tau Correlation
The Kendall Tau correlation coefficient measures the ordinal association between two variables. It is based on the number of concordant and discordant pairs.
Example Code: Kendall Tau Correlation
import pandas as pd

# Sample DataFrame
data = {
    'M': [3, 6, 9, 12, 15],
    'N': [15, 12, 9, 6, 3],
    'O': [5, 10, 15, 20, 25]
}
df = pd.DataFrame(data)

# Calculate Kendall Tau correlation
correlation = df.corr(method='kendall')
print(f"Kendall Tau correlation coefficient:\n{correlation}\npandasdataframe.com")
Output:
Explanation
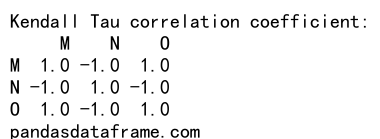
In this example, we create a DataFrame with columns M, N, and O, and compute the Kendall Tau correlation coefficient using the corr() method with method='kendall'. The Kendall Tau method is useful for understanding the ordinal association between variables.
Practical Examples and Detailed Explanations
Example 1: Correlation Between Stock Prices
import pandas as pd

# Sample DataFrame representing stock prices
data = {
    'Stock_A': [100, 101, 102, 103, 104],
    'Stock_B': [200, 198, 202, 204, 203],
    'Stock_C': [300, 299, 301, 303, 302]
}
df = pd.DataFrame(data)

# Calculate Pearson correlation coefficient for stock prices
correlation = df.corr(method='pearson')
print(f"Stock prices correlation coefficient:\n{correlation}\npandasdataframe.com")
Output:
Explanation
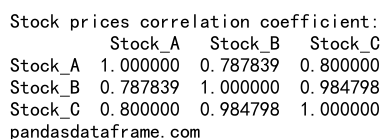
This example shows a DataFrame representing the prices of three stocks over five days. By using the Pearson correlation coefficient, we can understand how the prices of these stocks move in relation to each other.
Example 2: Correlation Between Exam Scores
import pandas as pd

# Sample DataFrame representing exam scores
data = {
    'Math': [90, 80, 85, 95, 70],
    'Physics': [85, 75, 80, 90, 65],
    'Chemistry': [88, 78, 84, 92, 68]
}
df = pd.DataFrame(data)

# Calculate Spearman rank correlation for exam scores
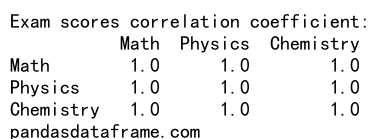
correlation = df.corr(method='spearman')
print(f"Exam scores correlation coefficient:\n{correlation}\npandasdataframe.com")
Output:
Explanation
This example illustrates a DataFrame with exam scores for three subjects. The Spearman rank correlation coefficient helps us understand the monotonic relationship between scores in different subjects.
Example 3: Correlation Between Environmental Factors
import pandas as pd

# Sample DataFrame representing environmental factors
data = {
    'Temperature': [30, 32, 35, 31, 29],
    'Humidity': [70, 65, 80, 75, 68],
    'Wind_Speed': [10, 12, 9, 11, 13]
}
df = pd.DataFrame(data)

# Calculate Kendall Tau correlation for environmental factors
correlation = df.corr(method='kendall')
print(f"Environmental factors correlation coefficient:\n{correlation}\npandasdataframe.com")
Output:

Explanation
This example demonstrates a DataFrame with data on temperature, humidity, and wind speed. By calculating the Kendall Tau correlation coefficient, we can assess the ordinal association between these environmental factors.
Example 4: Correlation Between Sales Figures
import pandas as pd

# Sample DataFrame representing sales figures
data = {
    'Product_A': [150, 160, 170, 180, 190],
    'Product_B': [200, 210, 220, 230, 240],
    'Product_C': [250, 260, 270, 280, 290]
}
df = pd.DataFrame(data)

# Calculate Pearson correlation coefficient for sales figures
correlation = df.corr(method='pearson')
print(f"Sales figures correlation coefficient:\n{correlation}\npandasdataframe.com")
Output:

Explanation
In this example, a DataFrame contains sales figures for three products over five periods. The Pearson correlation coefficient provides insights into how the sales of these products are related.
Example 5: Correlation Between Advertising Spend and Sales
import pandas as pd

# Sample DataFrame representing advertising spend and sales
data = {
    'Ad_Spend_TV': [300, 320, 330, 350, 360],
    'Ad_Spend_Online': [400, 420, 430, 450, 460],
    'Sales': [500, 520, 540, 560, 580]
}
df = pd.DataFrame(data)

# Calculate Pearson correlation coefficient for advertising spend and sales
correlation = df.corr(method='pearson')
print(f"Advertising spend and sales correlation coefficient:\n{correlation}\npandasdataframe.com")
Output:

Explanation
This example illustrates the relationship between advertising spend on TV and online with sales. The Pearson correlation coefficient helps to understand the linear relationship between advertising spend and sales.
Example 6: Correlation Between Website Metrics
import pandas as pd

# Sample DataFrame representing website metrics
data = {
    'Page_Views': [1000, 1100, 1200, 1300, 1400],
    'Unique_Visitors': [500, 550, 600, 650, 700],
    'Bounce_Rate': [30, 25, 20, 15, 10]
}
df = pd.DataFrame(data)

# Calculate Spearman rank correlation for website metrics
correlation = df.corr(method='spearman')
print(f"Website metrics correlation coefficient:\n{correlation}\npandasdataframe.com")
Output:

Explanation
This example demonstrates a DataFrame with website metrics such as page views, unique visitors, and bounce rate. The Spearman rank correlation coefficient helps to understand the monotonic relationship between these metrics.
Example 7: Correlation Between Financial Indicators
import pandas as pd

# Sample DataFrame representing financial indicators
data = {
    'GDP': [2000, 2100, 2200, 2300, 2400],
    'Unemployment_Rate': [5, 4.5, 4, 3.5, 3],
    'Inflation_Rate': [2, 2.1, 2.2, 2.3, 2.4]
}
df = pd.DataFrame(data)

# Calculate Kendall Tau correlation for financial indicators
correlation = df.corr(method='kendall')
print(f"Financial indicators correlation coefficient:\n{correlation}\npandasdataframe.com")
Output:

Explanation
This example illustrates a DataFrame with financial indicators such as GDP, unemployment rate, and inflation rate. The Kendall Tau correlation coefficient helps to understand the ordinal association between these indicators.
Example 8: Correlation Between Social Media Metrics
import pandas as pd

# Sample DataFrame representing social media metrics
data = {
    'Likes': [150, 160, 170, 180, 190],
    'Shares': [100, 120, 140, 160, 180],
    'Comments': [50, 55, 60, 65, 70]
}
df = pd.DataFrame(data)

# Calculate Pearson correlation coefficient for social media metrics
correlation = df.corr(method='pearson')
print(f"Social media metrics correlation coefficient:\n{correlation}\npandasdataframe.com")
Output:

Explanation
In this example, a DataFrame contains social media metrics such as likes, shares, and comments. The Pearson correlation coefficient provides insights into how these metrics are related.
Example 9: Correlation Between Health Indicators
import pandas as pd

# Sample DataFrame representing health indicators
data = {
    'BMI': [25, 26, 27, 28, 29],
    'Blood_Pressure': [120, 122, 124, 126, 128],
    'Cholesterol': [200, 202, 204, 206, 208]
}
df = pd.DataFrame(data)

# Calculate Spearman rank correlation for health indicators
correlation = df.corr(method='spearman')
print(f"Health indicators correlation coefficient:\n{correlation}\npandasdataframe.com")
Output:

Explanation
This example illustrates a DataFrame with health indicators such as BMI, blood pressure, and cholesterol levels. The Spearman rank correlation coefficient helps to understand the monotonic relationship between these health indicators.
Example 10: Correlation Between Economic Variables
import pandas as pd

# Sample DataFrame representing economic variables
data = {
    'Interest_Rate': [1.5, 1.6, 1.7, 1.8, 1.9],
    'House_Prices': [300000, 310000, 320000, 330000, 340000],
    'Stock_Index': [15000, 15200, 15400, 15600, 15800]
}
df = pd.DataFrame(data)

# Calculate Kendall Tau correlation for economic variables
correlation = df.corr(method='kendall')
print(f"Economic variables correlation coefficient:\n{correlation}\npandasdataframe.com")
Output:

Explanation
In this example, a DataFrame contains economic variables such as interest rates, house prices, and stock index values. The Kendall Tau correlation coefficient helps to understand the ordinal association between these economic variables.
Example 11: Correlation Between Social Media Metrics
import pandas as pd

# Sample DataFrame representing social media metrics
data = {
    'Likes': [100, 200, 300, 400, 500],
    'Shares': [50, 60, 70, 80, 90],
    'Comments': [30, 40, 50, 60, 70]
}
df = pd.DataFrame(data)

# Calculate Pearson correlation coefficient for social media metrics
correlation = df.corr(method='pearson')
print(f"Social media metrics correlation coefficient:\n{correlation}\npandasdataframe.com")
Output:

Explanation
In this example, a DataFrame contains social media metrics such as likes, shares, and comments. The Pearson correlation coefficient helps to understand the linear relationships between these metrics.
Example 12: Correlation Between E-commerce Metrics
import pandas as pd

# Sample DataFrame representing e-commerce metrics
data = {
    'Visits': [1000, 1200, 1400, 1600, 1800],
    'Conversions': [100, 120, 140, 160, 180],
    'Revenue': [10000, 12000, 14000, 16000, 18000]
}
df = pd.DataFrame(data)

# Calculate Spearman rank correlation for e-commerce metrics
correlation = df.corr(method='spearman')
print(f"E-commerce metrics correlation coefficient:\n{correlation}\npandasdataframe.com")
Output:

Explanation
This example demonstrates the relationship between e-commerce metrics such as visits, conversions, and revenue. The Spearman rank correlation coefficient helps to understand the monotonic relationships between these metrics.
Example 13: Correlation Between Fitness Data
import pandas as pd

# Sample DataFrame representing fitness data
data = {
    'Steps': [10000, 12000, 14000, 16000, 18000],
    'Calories_Burned': [300, 350, 400, 450, 500],
    'Distance': [8, 9, 10, 11, 12]
}
df = pd.DataFrame(data)

# Calculate Pearson correlation coefficient for fitness data
correlation = df.corr(method='pearson')
print(f"Fitness data correlation coefficient:\n{correlation}\npandasdataframe.com")
Output:

Explanation
This example illustrates the relationship between fitness data such as steps taken, calories burned, and distance traveled. The Pearson correlation coefficient helps to understand the linear relationships between these fitness metrics.
Example 14: Correlation Between Economic Indicators
import pandas as pd

# Sample DataFrame representing economic indicators
data = {
    'Interest_Rate': [1.5, 1.6, 1.7, 1.8, 1.9],
    'Inflation_Rate': [2.0, 2.1, 2.2, 2.3, 2.4],
    'Exchange_Rate': [1.1, 1.2, 1.3, 1.4, 1.5]
}
df = pd.DataFrame(data)

# Calculate Kendall Tau correlation for economic indicators
correlation = df.corr(method='kendall')
print(f"Economic indicators correlation coefficient:\n{correlation}\npandasdataframe.com")
Output:

Explanation
In this example, a DataFrame contains economic indicators such as interest rate, inflation rate, and exchange rate. The Kendall Tau correlation coefficient helps to understand the ordinal associations between these economic indicators.
Example 15: Correlation Between Sports Statistics
import pandas as pd

# Sample DataFrame representing sports statistics
data = {
    'Points': [20, 22, 24, 26, 28],
    'Assists': [5, 6, 7, 8, 9],
    'Rebounds': [10, 12, 14, 16, 18]
}
df = pd.DataFrame(data)

# Calculate Pearson correlation coefficient for sports statistics
correlation = df.corr(method='pearson')
print(f"Sports statistics correlation coefficient:\n{correlation}\npandasdataframe.com")
Output:

Explanation
This example demonstrates the relationship between sports statistics such as points, assists, and rebounds. The Pearson correlation coefficient helps to understand the linear relationships between these sports metrics.
Example 16: Correlation Between Academic Performance
import pandas as pd

# Sample DataFrame representing academic performance
data = {
    'GPA': [3.0, 3.2, 3.4, 3.6, 3.8],
    'Study_Hours': [10, 12, 14, 16, 18],
    'Attendance': [90, 92, 94, 96, 98]
}
df = pd.DataFrame(data)

# Calculate Spearman rank correlation for academic performance
correlation = df.corr(method='spearman')
print(f"Academic performance correlation coefficient:\n{correlation}\npandasdataframe.com")
Output:

Explanation
In this example, a DataFrame contains academic performance metrics such as GPA, study hours, and attendance. The Spearman rank correlation coefficient helps to understand the monotonic relationships between these academic performance indicators.
 Pandas Dataframe