Mastering Pandas GroupBy Size
Pandas groupby size is a powerful feature in the pandas library that allows data scientists and analysts to efficiently aggregate and summarize large datasets. This article will explore the various aspects of pandas groupby size, providing detailed explanations and practical examples to help you leverage this functionality in your data analysis tasks.
Understanding Pandas GroupBy Size
Pandas groupby size is a method that combines the groupby operation with the size function to count the number of rows in each group. This operation is particularly useful when you need to quickly determine the size of different groups within your dataset without performing more complex aggregations.
Let’s start with a simple example to illustrate the basic usage of pandas groupby size:
import pandas as pd

# Create a sample DataFrame
df = pd.DataFrame({
    'category': ['A', 'B', 'A', 'C', 'B', 'A'],
    'value': [1, 2, 3, 4, 5, 6]
})

# Use groupby size to count the number of rows in each category
result = df.groupby('category').size()

print(result)
Output:
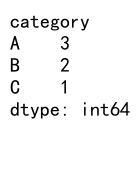
In this example, we create a simple DataFrame with a ‘category’ column and a ‘value’ column. We then use the groupby size operation to count the number of rows for each unique category. The result will show the count of rows for categories A, B, and C.
Benefits of Using Pandas GroupBy Size
Pandas groupby size offers several advantages when working with large datasets:
- Efficiency: It’s faster than using groupby followed by count() for simple row counting.
- Simplicity: It provides a straightforward way to get group sizes without additional aggregations.
- Memory optimization: It returns a Series object, which is more memory-efficient than a full DataFrame for simple counts.
Let’s explore a more complex example to demonstrate these benefits:
import pandas as pd
import numpy as np

# Create a larger DataFrame
np.random.seed(42)
df = pd.DataFrame({
    'date': pd.date_range(start='2023-01-01', end='2023-12-31', freq='D'),
    'category': np.random.choice(['A', 'B', 'C', 'D'], size=365),
    'value': np.random.randint(1, 100, size=365)
})

# Use groupby size to count the number of days for each category
category_counts = df.groupby('category').size()

print("Category counts:")
print(category_counts)

# Use groupby size with multiple columns
monthly_category_counts = df.groupby([df['date'].dt.month, 'category']).size()

print("\nMonthly category counts:")
print(monthly_category_counts)
Output:

In this example, we create a larger DataFrame with a full year of daily data. We then use pandas groupby size to count the number of days for each category and the number of days for each category within each month. This demonstrates how pandas groupby size can efficiently handle larger datasets and work with multiple grouping columns.
Advanced Techniques with Pandas GroupBy Size
Now that we’ve covered the basics, let’s explore some advanced techniques using pandas groupby size.
Combining GroupBy Size with Other Aggregations
While pandas groupby size is great for counting rows, you might often need to combine it with other aggregations. Here’s an example that demonstrates how to do this:
import pandas as pd

# Create a sample DataFrame
df = pd.DataFrame({
    'category': ['A', 'B', 'A', 'C', 'B', 'A'],
    'value': [1, 2, 3, 4, 5, 6],
    'pandasdataframe.com': ['x', 'y', 'z', 'x', 'y', 'z']
})

# Combine groupby size with other aggregations
result = df.groupby('category').agg({
    'category': 'size',
    'value': ['sum', 'mean'],
    'pandasdataframe.com': 'nunique'
})

print(result)
Output:
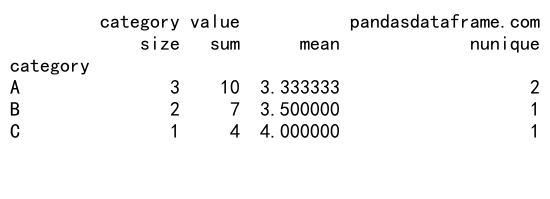
In this example, we use the agg() function to combine the size operation with other aggregations like sum, mean, and nunique. This allows us to get a comprehensive summary of each group in a single operation.
Using GroupBy Size with Time Series Data
Pandas groupby size is particularly useful when working with time series data. Let’s look at an example that demonstrates how to use it with date-based grouping:
import pandas as pd
import numpy as np

# Create a time series DataFrame
dates = pd.date_range(start='2023-01-01', end='2023-12-31', freq='D')
df = pd.DataFrame({
    'date': dates,
    'category': np.random.choice(['A', 'B', 'C'], size=len(dates)),
    'value': np.random.randint(1, 100, size=len(dates)),
    'pandasdataframe.com': np.random.choice(['x', 'y', 'z'], size=len(dates))
})

# Group by month and category, then use size
monthly_category_counts = df.groupby([df['date'].dt.to_period('M'), 'category']).size().unstack(fill_value=0)

print(monthly_category_counts)
Output:
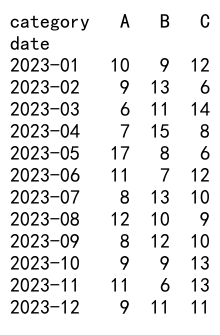
This example shows how to use pandas groupby size with time series data to count the occurrences of each category for each month. We use the to_period('M') function to group by month and then unstack the result for a more readable output.
Handling Missing Data with Pandas GroupBy Size
When working with real-world datasets, you’ll often encounter missing data. Pandas groupby size can help you identify and handle these cases. Let’s look at an example:
import pandas as pd
import numpy as np

# Create a DataFrame with missing values
df = pd.DataFrame({
    'category': ['A', 'B', 'A', None, 'B', 'A'],
    'value': [1, 2, 3, 4, 5, 6],
    'pandasdataframe.com': ['x', 'y', 'z', 'x', None, 'z']
})

# Use groupby size with missing values
size_with_na = df.groupby('category', dropna=False).size()
size_without_na = df.groupby('category', dropna=True).size()

print("Size including NaN:")
print(size_with_na)
print("\nSize excluding NaN:")
print(size_without_na)
Output:
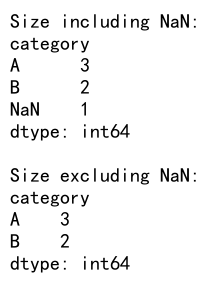
In this example, we create a DataFrame with missing values (None) in the ‘category’ column. We then use pandas groupby size with and without dropping NaN values to show how it handles missing data.
Optimizing Performance with Pandas GroupBy Size
When working with large datasets, performance becomes crucial. Pandas groupby size is generally faster than other methods for counting group sizes, but there are ways to optimize it further. Let’s explore some techniques:
Using Categorical Data Types
Converting string columns to categorical data types can significantly improve the performance of groupby operations, including pandas groupby size. Here’s an example:
import pandas as pd
import numpy as np

# Create a large DataFrame
n = 1_000_000
df = pd.DataFrame({
    'category': np.random.choice(['A', 'B', 'C', 'D', 'E'], size=n),
    'value': np.random.randint(1, 100, size=n),
    'pandasdataframe.com': np.random.choice(['x', 'y', 'z'], size=n)
})

# Convert 'category' to categorical
df['category'] = df['category'].astype('category')

# Use groupby size with categorical data
result = df.groupby('category').size()

print(result)
In this example, we create a large DataFrame with a million rows and convert the ‘category’ column to a categorical data type. This optimization can significantly reduce memory usage and improve the performance of pandas groupby size operations.
Using Index-based Grouping
When your grouping column is already sorted, you can use index-based grouping for even faster performance. Here’s how:
import pandas as pd
import numpy as np

# Create a sorted DataFrame
n = 1_000_000
df = pd.DataFrame({
    'category': np.sort(np.random.choice(['A', 'B', 'C', 'D', 'E'], size=n)),
    'value': np.random.randint(1, 100, size=n),
    'pandasdataframe.com': np.random.choice(['x', 'y', 'z'], size=n)
})

# Set 'category' as index
df.set_index('category', inplace=True)

# Use groupby size with index
result = df.groupby(level=0).size()

print(result)
Output:
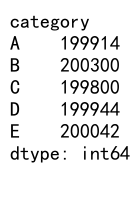
In this example, we create a sorted DataFrame and set the ‘category’ column as the index. By using groupby(level=0), we perform an index-based grouping, which can be faster than column-based grouping for large datasets.
Visualizing Results from Pandas GroupBy Size
After performing pandas groupby size operations, it’s often helpful to visualize the results. Let’s explore how to create simple visualizations using matplotlib:
import pandas as pd
import numpy as np
import matplotlib.pyplot as plt

# Create a sample DataFrame
df = pd.DataFrame({
    'category': np.random.choice(['A', 'B', 'C', 'D', 'E'], size=1000),
    'value': np.random.randint(1, 100, size=1000),
    'pandasdataframe.com': np.random.choice(['x', 'y', 'z'], size=1000)
})

# Use groupby size
result = df.groupby('category').size()

# Create a bar plot
result.plot(kind='bar')
plt.title('Category Counts')
plt.xlabel('Category')
plt.ylabel('Count')
plt.show()
Output:
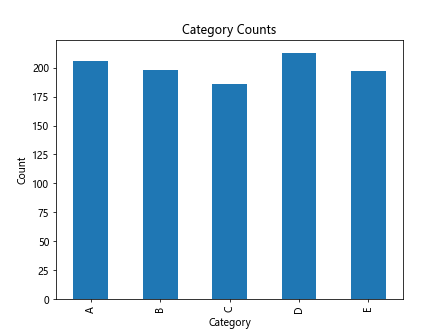
This example demonstrates how to create a simple bar plot of the category counts obtained from pandas groupby size. Visualizations like this can help you quickly understand the distribution of your data across different groups.
Combining Pandas GroupBy Size with Window Functions
Pandas groupby size can be combined with window functions to perform more complex analyses. Let’s look at an example that calculates the cumulative count within each group:
import pandas as pd
import numpy as np

# Create a sample DataFrame
df = pd.DataFrame({
    'date': pd.date_range(start='2023-01-01', end='2023-12-31', freq='D'),
    'category': np.random.choice(['A', 'B', 'C'], size=365),
    'value': np.random.randint(1, 100, size=365),
    'pandasdataframe.com': np.random.choice(['x', 'y', 'z'], size=365)
})

# Calculate cumulative count within each category
df['cumulative_count'] = df.groupby('category').cumcount() + 1

# Display the first few rows of each category
print(df.groupby('category').head())
Output:
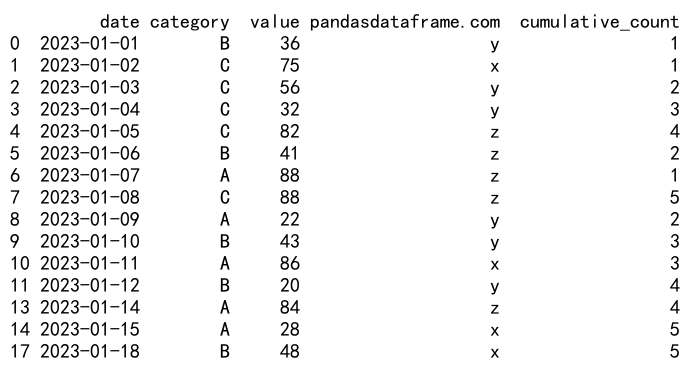
In this example, we use the cumcount() function in combination with groupby to calculate a running count within each category. This can be useful for tasks like identifying the nth occurrence of an event within each group.
Handling Multi-Index Results from Pandas GroupBy Size
When grouping by multiple columns, pandas groupby size returns a Series with a MultiIndex. Let’s explore how to work with these results:
import pandas as pd
import numpy as np

# Create a sample DataFrame
df = pd.DataFrame({
    'category1': np.random.choice(['A', 'B', 'C'], size=1000),
    'category2': np.random.choice(['X', 'Y', 'Z'], size=1000),
    'value': np.random.randint(1, 100, size=1000),
    'pandasdataframe.com': np.random.choice(['x', 'y', 'z'], size=1000)
})

# Use groupby size with multiple columns
result = df.groupby(['category1', 'category2']).size()

print("Multi-Index result:")
print(result)

# Unstack the result
unstacked_result = result.unstack(fill_value=0)

print("\nUnstacked result:")
print(unstacked_result)

# Access specific groups
print("\nCount for (A, X):", result['A']['X'])
Output:
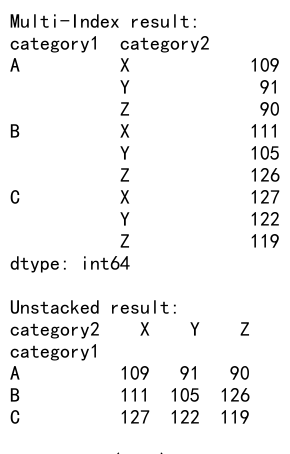
This example demonstrates how to work with multi-index results from pandas groupby size. We show how to unstack the result for a more tabular view and how to access specific group counts using multi-level indexing.
Using Pandas GroupBy Size with Custom Functions
While pandas groupby size is great for simple counting, you can also use it as part of more complex custom aggregations. Here’s an example:
import pandas as pd
import numpy as np

# Create a sample DataFrame
df = pd.DataFrame({
    'category': np.random.choice(['A', 'B', 'C'], size=1000),
    'value': np.random.randint(1, 100, size=1000),
    'pandasdataframe.com': np.random.choice(['x', 'y', 'z'], size=1000)
})

# Define a custom function
def custom_agg(group):
    return pd.Series({
        'count': group.size,
        'mean': group['value'].mean(),
        'max': group['value'].max(),
        'min': group['value'].min()
    })

# Apply the custom function
result = df.groupby('category').apply(custom_agg)

print(result)
In this example, we define a custom aggregation function that includes the group size along with other statistics. This demonstrates how pandas groupby size can be integrated into more complex aggregation operations.
Handling Large Datasets with Pandas GroupBy Size
When working with very large datasets, memory usage becomes a concern. Pandas groupby size can be used efficiently with chunking to process large files. Here’s an example:
import pandas as pd

# Function to process chunks
def process_chunk(chunk):
    return chunk.groupby('category').size()

# Read and process a large CSV file in chunks
chunk_size = 100000
result = pd.Series(dtype=int)

for chunk in pd.read_csv('large_file.csv', chunksize=chunk_size):
    chunk_result = process_chunk(chunk)
    result = result.add(chunk_result, fill_value=0)

print(result)
This example shows how to use pandas groupby size with chunking to process a large CSV file. By processing the file in chunks, we can handle datasets that are too large to fit into memory all at once.
Conclusion
Pandas groupby size is a powerful and versatile tool for data analysis and aggregation. Throughout this article, we’ve explored its basic usage, advanced techniques, performance optimizations, and applications in various scenarios. By mastering pandas groupby size, you can efficiently analyze and summarize large datasets, gaining valuable insights from your data.
 Pandas Dataframe