Mastering Pandas GroupBy Month: A Comprehensive Guide to Time-Based Data Analysis
Pandas groupby month is a powerful technique for analyzing time-series data in Python. This article will explore the various aspects of using pandas groupby month to aggregate, transform, and analyze data based on monthly intervals. We’ll cover everything from basic grouping operations to advanced time-based analysis techniques, providing practical examples and code snippets along the way.
Understanding Pandas GroupBy Month
Pandas groupby month is a specific application of the more general groupby functionality in pandas. It allows you to group data by month, which is particularly useful when working with time-series data. By using pandas groupby month, you can easily aggregate data on a monthly basis, calculate monthly statistics, and perform time-based analysis.
Let’s start with a simple example to illustrate the basic concept of pandas groupby month:
import pandas as pd

# Create a sample DataFrame
df = pd.DataFrame({
    'date': pd.date_range(start='2023-01-01', end='2023-12-31', freq='D'),
    'sales': [100 + i for i in range(365)]
})

# Group by month and calculate the mean sales
monthly_sales = df.groupby(df['date'].dt.to_period('M'))['sales'].mean()

print("Monthly sales averages:")
print(monthly_sales)
Output:
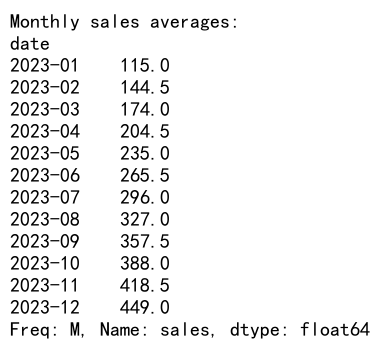
In this example, we create a DataFrame with daily sales data for the year 2023. We then use pandas groupby month to group the data by month and calculate the average sales for each month. The to_period('M') function is used to convert the date column to monthly periods, which allows us to group by month.
Preparing Data for Pandas GroupBy Month
Before we can effectively use pandas groupby month, it’s important to ensure that our data is properly formatted. This often involves converting date strings to datetime objects and setting the appropriate index.
Here’s an example of how to prepare data for pandas groupby month:
import pandas as pd

# Create a sample DataFrame with string dates
df = pd.DataFrame({
    'date': ['2023-01-15', '2023-02-20', '2023-03-10', '2023-04-05'],
    'value': [10, 15, 20, 25]
})

# Convert the 'date' column to datetime
df['date'] = pd.to_datetime(df['date'])

# Set the 'date' column as the index
df.set_index('date', inplace=True)

# Now we can easily group by month
monthly_values = df.groupby(df.index.to_period('M'))['value'].mean()

print("Monthly averages:")
print(monthly_values)
Output:
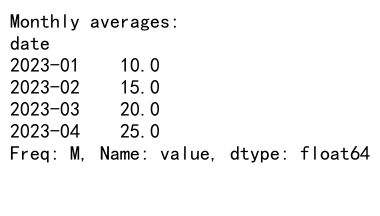
In this example, we start with a DataFrame that has date strings. We convert these to datetime objects using pd.to_datetime(), then set the ‘date’ column as the index. This preparation makes it easy to use pandas groupby month operations.
Basic Pandas GroupBy Month Operations
Now that we understand the basics of pandas groupby month and how to prepare our data, let’s explore some common operations you can perform using this technique.
Summing Values by Month
One of the most common operations with pandas groupby month is summing values for each month. Here’s an example:
import pandas as pd

# Create a sample DataFrame
df = pd.DataFrame({
    'date': pd.date_range(start='2023-01-01', end='2023-12-31', freq='D'),
    'sales': [100 + i for i in range(365)]
})

# Group by month and sum the sales
monthly_sales_sum = df.groupby(df['date'].dt.to_period('M'))['sales'].sum()

print("Monthly sales totals:")
print(monthly_sales_sum)
Output:
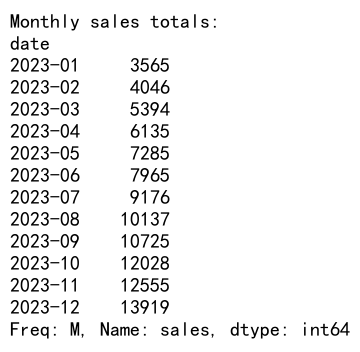
This code groups the sales data by month and calculates the total sales for each month.
Calculating Monthly Averages
Another common operation is calculating monthly averages. Here’s how you can do this with pandas groupby month:
import pandas as pd

# Create a sample DataFrame
df = pd.DataFrame({
    'date': pd.date_range(start='2023-01-01', end='2023-12-31', freq='D'),
    'temperature': [20 + i % 10 for i in range(365)]
})

# Group by month and calculate average temperature
monthly_avg_temp = df.groupby(df['date'].dt.to_period('M'))['temperature'].mean()

print("Monthly average temperatures:")
print(monthly_avg_temp)
Output:
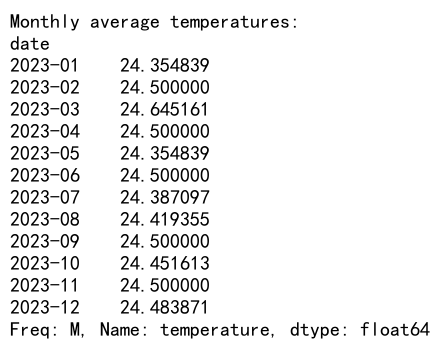
This example calculates the average temperature for each month using pandas groupby month.
Advanced Pandas GroupBy Month Techniques
While basic operations are useful, pandas groupby month really shines when we start using more advanced techniques. Let’s explore some of these.
Multiple Aggregations
You can perform multiple aggregations in a single pandas groupby month operation. Here’s an example:
import pandas as pd

# Create a sample DataFrame
df = pd.DataFrame({
    'date': pd.date_range(start='2023-01-01', end='2023-12-31', freq='D'),
    'sales': [100 + i for i in range(365)],
    'units': [10 + i % 5 for i in range(365)]
})

# Group by month and perform multiple aggregations
monthly_stats = df.groupby(df['date'].dt.to_period('M')).agg({
    'sales': ['sum', 'mean'],
    'units': ['sum', 'max']
})

print("Monthly statistics:")
print(monthly_stats)
Output:
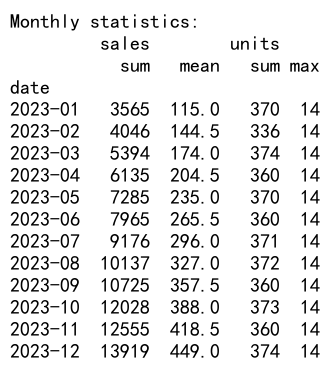
This code uses pandas groupby month to calculate the sum and mean of sales, and the sum and maximum of units sold for each month.
Custom Aggregation Functions
You can also use custom functions with pandas groupby month. Here’s an example that calculates the median absolute deviation:
import pandas as pd
import numpy as np

# Create a sample DataFrame
df = pd.DataFrame({
    'date': pd.date_range(start='2023-01-01', end='2023-12-31', freq='D'),
    'value': np.random.randn(365)
})

# Define a custom function
def median_absolute_deviation(x):
    return np.median(np.abs(x - np.median(x)))

# Group by month and apply the custom function
monthly_mad = df.groupby(df['date'].dt.to_period('M'))['value'].agg(median_absolute_deviation)

print("Monthly median absolute deviation:")
print(monthly_mad)
Output:
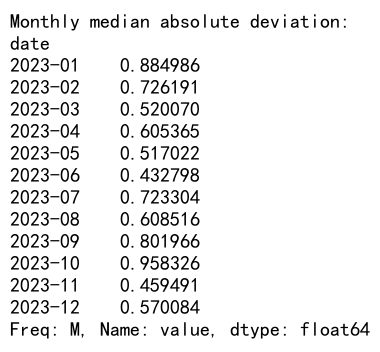
This example demonstrates how to use a custom function with pandas groupby month to calculate a more complex statistic.
Time-Based Analysis with Pandas GroupBy Month
Pandas groupby month is particularly useful for time-based analysis. Let’s explore some techniques for analyzing trends and patterns over time.
Calculating Month-over-Month Growth
You can use pandas groupby month to calculate month-over-month growth rates. Here’s an example:
import pandas as pd

# Create a sample DataFrame
df = pd.DataFrame({
    'date': pd.date_range(start='2023-01-01', end='2023-12-31', freq='D'),
    'sales': [100 + i * 2 for i in range(365)]
})

# Group by month and sum the sales
monthly_sales = df.groupby(df['date'].dt.to_period('M'))['sales'].sum()

# Calculate month-over-month growth
mom_growth = monthly_sales.pct_change() * 100

print("Month-over-month sales growth (%):")
print(mom_growth)
Output:
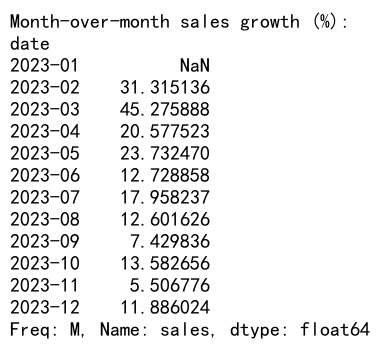
This code calculates the total sales for each month using pandas groupby month, then computes the percentage change from the previous month.
Identifying Seasonal Patterns
Pandas groupby month can help identify seasonal patterns in your data. Here’s an example:
import pandas as pd
import numpy as np

# Create a sample DataFrame with seasonal pattern
df = pd.DataFrame({
    'date': pd.date_range(start='2020-01-01', end='2023-12-31', freq='D'),
    'sales': [100 + 50 * np.sin(2 * np.pi * i / 365) + i / 10 for i in range(4 * 365)]
})

# Group by month and calculate average sales
monthly_sales = df.groupby(df['date'].dt.to_period('M'))['sales'].mean()

# Calculate average sales for each month across years
seasonal_pattern = monthly_sales.groupby(monthly_sales.index.month).mean()

print("Average sales by month (seasonal pattern):")
print(seasonal_pattern)
This example uses pandas groupby month to calculate average monthly sales over multiple years, revealing the underlying seasonal pattern.
Handling Missing Data in Pandas GroupBy Month
When working with real-world data, you’ll often encounter missing values. Let’s look at how to handle these when using pandas groupby month.
Filling Missing Values
Here’s an example of how to fill missing values when using pandas groupby month:
import pandas as pd
import numpy as np

# Create a sample DataFrame with missing values
df = pd.DataFrame({
    'date': pd.date_range(start='2023-01-01', end='2023-12-31', freq='D'),
    'sales': [100 + i if i % 10 != 0 else np.nan for i in range(365)]
})

# Group by month and fill missing values with the mean
monthly_sales = df.groupby(df['date'].dt.to_period('M'))['sales'].transform(lambda x: x.fillna(x.mean()))

print("Monthly sales with missing values filled:")
print(monthly_sales.head(20))
Output:
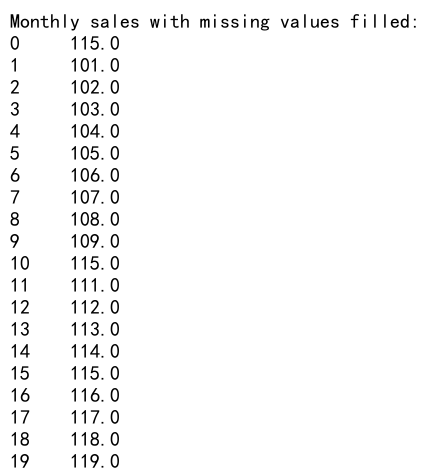
This example uses pandas groupby month to fill missing values with the mean value for each month.
Excluding Missing Values
Alternatively, you might want to exclude missing values from your analysis:
import pandas as pd
import numpy as np

# Create a sample DataFrame with missing values
df = pd.DataFrame({
    'date': pd.date_range(start='2023-01-01', end='2023-12-31', freq='D'),
    'sales': [100 + i if i % 10 != 0 else np.nan for i in range(365)]
})

# Group by month and calculate mean, excluding missing values
monthly_sales = df.groupby(df['date'].dt.to_period('M'))['sales'].mean()

print("Monthly average sales (excluding missing values):")
print(monthly_sales)
Output:
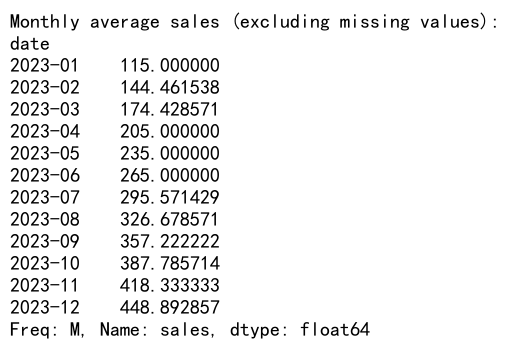
This code uses pandas groupby month to calculate monthly averages, automatically excluding any missing values.
Combining Pandas GroupBy Month with Other Pandas Features
Pandas groupby month becomes even more powerful when combined with other pandas features. Let’s explore some of these combinations.
Using Pandas GroupBy Month with MultiIndex
You can use pandas groupby month with a MultiIndex to perform more complex grouping operations:
import pandas as pd

# Create a sample DataFrame with MultiIndex
df = pd.DataFrame({
    'date': pd.date_range(start='2023-01-01', end='2023-12-31', freq='D').repeat(2),
    'product': ['A', 'B'] * 365,
    'sales': [100 + i for i in range(730)]
})

# Set MultiIndex
df.set_index(['date', 'product'], inplace=True)

# Group by month and product, then sum sales
monthly_product_sales = df.groupby([df.index.get_level_values('date').to_period('M'), 'product'])['sales'].sum()

print("Monthly sales by product:")
print(monthly_product_sales.head(10))
Output:
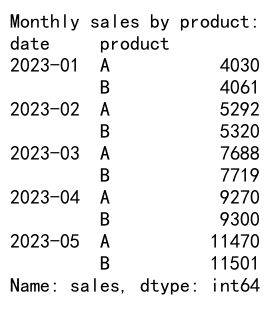
This example uses pandas groupby month along with a product category to calculate monthly sales for each product.
Combining Pandas GroupBy Month with Resampling
You can combine pandas groupby month with resampling for more flexible time-based analysis:
import pandas as pd
import numpy as np

# Create a sample DataFrame
df = pd.DataFrame({
    'date': pd.date_range(start='2023-01-01', end='2023-12-31', freq='H'),
    'value': np.random.randn(8760)
})

# Set date as index
df.set_index('date', inplace=True)

# Resample to daily frequency and then group by month
monthly_stats = df.resample('D').mean().groupby(pd.Grouper(freq='M')).agg(['mean', 'std'])

print("Monthly statistics:")
print(monthly_stats.head())
This example first resamples the hourly data to daily frequency, then uses pandas groupby month to calculate monthly statistics.
Visualizing Results from Pandas GroupBy Month
Visualizing the results of your pandas groupby month operations can provide valuable insights. Let’s look at how to create some common visualizations.
Line Plot of Monthly Trends
Here’s how to create a line plot of monthly trends using pandas groupby month:
import pandas as pd
import matplotlib.pyplot as plt

# Create a sample DataFrame
df = pd.DataFrame({
    'date': pd.date_range(start='2023-01-01', end='2023-12-31', freq='D'),
    'sales': [100 + i + 50 * (i % 30) for i in range(365)]
})

# Group by month and calculate mean sales
monthly_sales = df.groupby(df['date'].dt.to_period('M'))['sales'].mean()

# Plot the results
plt.figure(figsize=(12, 6))
monthly_sales.plot(kind='line', marker='o')
plt.title('Monthly Sales Trend')
plt.xlabel('Month')
plt.ylabel('Average Sales')
plt.grid(True)
plt.savefig('monthly_sales_trend_pandasdataframe.com.png')
plt.close()

print("Line plot saved as 'monthly_sales_trend_pandasdataframe.com.png'")
This code uses pandas groupby month to calculate average monthly sales, then creates a line plot to visualize the trend.
Bar Plot of Monthly Comparisons
Here’s how to create a bar plot for monthly comparisons:
import pandas as pd
import matplotlib.pyplot as plt

# Create a sample DataFrame
df = pd.DataFrame({
    'date': pd.date_range(start='2023-01-01', end='2023-12-31', freq='D'),
    'sales': [100 + i + 50 * (i % 30) for i in range(365)]
})

# Group by month and calculate total sales
monthly_sales = df.groupby(df['date'].dt.to_period('M'))['sales'].sum()

# Plot the results
plt.figure(figsize=(12, 6))
monthly_sales.plot(kind='bar')
plt.title('Monthly Sales Comparison')
plt.xlabel('Month')
plt.ylabel('Total Sales')
plt.xticks(rotation=45)
plt.tight_layout()
plt.savefig('monthly_sales_comparison_pandasdataframe.com.png')
plt.close()

print("Bar plot saved as 'monthly_sales_comparison_pandasdataframe.com.png'")
This example uses pandas groupby month to calculate total monthly sales, then creates a bar plot for easy comparison between months.
Performance Considerations for Pandas GroupBy Month
When working with large datasets, performance can become a concern. Here are some tips to optimize your pandas groupby month operations.
Using Efficient Date Representations
Using efficient date representations can significantly improve the performance of pandas groupby month operations:
import pandas as pd
import numpy as np

# Create a large sample DataFrame
df = pd.DataFrame({
    'date': pd.date_range(start='2020-01-01', end='2023-12-31', freq='H'),
    'value': np.random.randn(4 * 365 * 24)
})

# Convert to PeriodIndex for efficient grouping
df['month'] = df['date'].dt.to_period('M')

# Group by month using the efficient representation
monthly_stats = df.groupby('month')['value'].agg(['mean', 'std'])

print("Monthly statistics:")
print(monthly_stats.head())
This example converts dates to a PeriodIndex, which can be more efficient for pandas groupby month operations on large datasets.
Using Categorical Data for Grouping
For very large datasets, using categorical data for grouping can improve performance:
import```python
import pandas as pd
import numpy as np

# Create a large sample DataFrame
df = pd.DataFrame({
    'date': pd.date_range(start='2020-01-01', end='2023-12-31', freq='H'),
    'value': np.random.randn(4 * 365 * 24)
})

# Convert month to categorical for efficient grouping
df['month'] = pd.Categorical(df['date'].dt.to_period('M'))

# Group by month using the categorical representation
monthly_stats = df.groupby('month')['value'].agg(['mean', 'std'])

print("Monthly statistics:")
print(monthly_stats.head())
This example converts the month to a categorical variable, which can significantly improve the performance of pandas groupby month operations on large datasets.
Common Pitfalls and How to Avoid Them
When using pandas groupby month, there are some common pitfalls that you should be aware of. Let’s discuss these and how to avoid them.
Incorrect Date Parsing
One common issue is incorrect date parsing, which can lead to unexpected results when using pandas groupby month:
import pandas as pd

# Create a sample DataFrame with ambiguous dates
df = pd.DataFrame({
    'date': ['01-02-2023', '02-01-2023', '03-04-2023'],
    'value': [10, 20, 30]
})

# Incorrect parsing
df['date'] = pd.to_datetime(df['date'])

# Correct parsing with specified format
df['date_correct'] = pd.to_datetime(df['date'], format='%d-%m-%Y')

# Group by month (incorrect and correct)
monthly_values_incorrect = df.groupby(df['date'].dt.to_period('M'))['value'].sum()
monthly_values_correct = df.groupby(df['date_correct'].dt.to_period('M'))['value'].sum()

print("Incorrect grouping:")
print(monthly_values_incorrect)
print("\nCorrect grouping:")
print(monthly_values_correct)
Output:
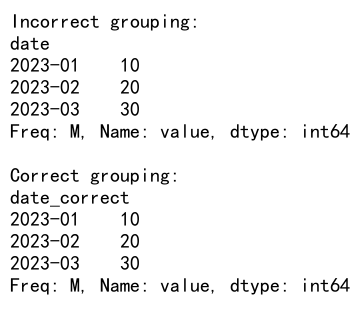
This example demonstrates how ambiguous date formats can lead to incorrect grouping. Always specify the date format when parsing dates to avoid this issue.
Forgetting to Handle Timezones
When working with data from different timezones, forgetting to handle timezones can lead to incorrect grouping:
import pandas as pd

# Create a sample DataFrame with timezone-aware timestamps
df = pd.DataFrame({
    'date': pd.date_range(start='2023-01-01', end='2023-12-31', freq='D', tz='UTC'),
    'value': range(365)
})

# Convert to a different timezone
df['date_est'] = df['date'].dt.tz_convert('US/Eastern')

# Group by month in UTC and EST
monthly_values_utc = df.groupby(df['date'].dt.to_period('M'))['value'].sum()
monthly_values_est = df.groupby(df['date_est'].dt.to_period('M'))['value'].sum()

print("Grouping in UTC:")
print(monthly_values_utc)
print("\nGrouping in EST:")
print(monthly_values_est)
This example shows how grouping can differ when timezones are taken into account. Always be aware of the timezones in your data when using pandas groupby month.
Real-World Applications of Pandas GroupBy Month
Pandas groupby month has numerous real-world applications across various industries. Let’s explore some of these applications.
Financial Analysis
In financial analysis, pandas groupby month is often used to analyze monthly revenue, expenses, or stock prices:
import pandas as pd
import numpy as np

# Create a sample DataFrame of daily stock prices
df = pd.DataFrame({
    'date': pd.date_range(start='2023-01-01', end='2023-12-31', freq='D'),
    'price': [100 + np.random.randn() * 10 for _ in range(365)]
})

# Calculate monthly average, high, and low prices
monthly_stats = df.groupby(df['date'].dt.to_period('M'))['price'].agg(['mean', 'max', 'min'])

print("Monthly stock price statistics:")
print(monthly_stats)
Output:
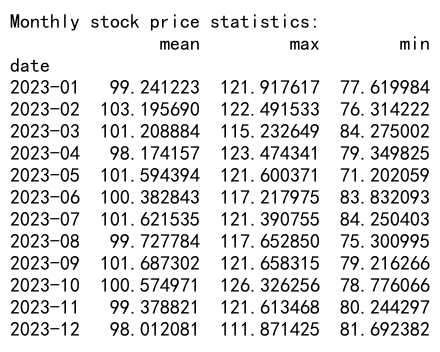
This example uses pandas groupby month to calculate monthly statistics for stock prices, which could be used for financial reporting or analysis.
Weather Data Analysis
Meteorologists often use pandas groupby month to analyze weather patterns:
import pandas as pd
import numpy as np

# Create a sample DataFrame of daily weather data
df = pd.DataFrame({
    'date': pd.date_range(start='2023-01-01', end='2023-12-31', freq='D'),
    'temperature': [20 + 10 * np.sin(2 * np.pi * i / 365) + np.random.randn() * 5 for i in range(365)],
    'rainfall': [np.random.exponential(5) for _ in range(365)]
})

# Calculate monthly average temperature and total rainfall
monthly_weather = df.groupby(df['date'].dt.to_period('M')).agg({
    'temperature': 'mean',
    'rainfall': 'sum'
})

print("Monthly weather statistics:")
print(monthly_weather)
Output:
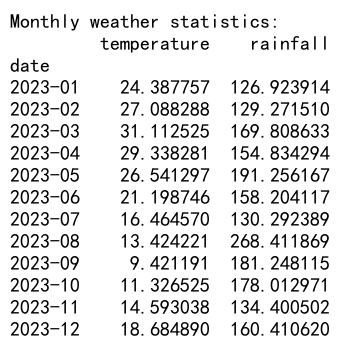
This example demonstrates how pandas groupby month can be used to analyze temperature and rainfall patterns over the course of a year.
Sales Analysis
Retail businesses often use pandas groupby month to analyze sales trends:
import pandas as pd
import numpy as np

# Create a sample DataFrame of daily sales data
df = pd.DataFrame({
    'date': pd.date_range(start='2023-01-01', end='2023-12-31', freq='D'),
    'sales': [1000 + 500 * np.sin(2 * np.pi * i / 365) + np.random.randn() * 100 for i in range(365)],
    'units': [100 + 50 * np.sin(2 * np.pi * i / 365) + np.random.randint(0, 20) for i in range(365)]
})

# Calculate monthly total sales and average units sold
monthly_sales = df.groupby(df['date'].dt.to_period('M')).agg({
    'sales': 'sum',
    'units': 'mean'
})

print("Monthly sales statistics:")
print(monthly_sales)
Output:
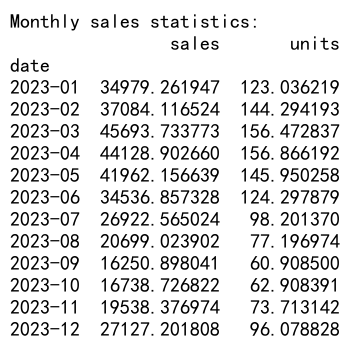
This example shows how pandas groupby month can be used to analyze monthly sales totals and average units sold, which could be used for inventory planning or sales forecasting.
Advanced Topics in Pandas GroupBy Month
As you become more comfortable with pandas groupby month, you may want to explore some more advanced topics. Let’s look at a few of these.
Rolling Window Calculations
You can combine pandas groupby month with rolling window calculations for more sophisticated analysis:
import pandas as pd
import numpy as np

# Create a sample DataFrame
df = pd.DataFrame({
    'date': pd.date_range(start='2023-01-01', end='2023-12-31', freq='D'),
    'sales': [100 + i + np.random.randn() * 20 for i in range(365)]
})

# Set date as index
df.set_index('date', inplace=True)

# Calculate 3-month rolling average
df['rolling_avg'] = df['sales'].rolling(window='90D').mean()

# Group by month and calculate average sales and rolling average
monthly_stats = df.groupby(pd.Grouper(freq='M')).agg({
    'sales': 'mean',
    'rolling_avg': 'last'
})

print("Monthly sales statistics with 3-month rolling average:")
print(monthly_stats)
This example calculates a 3-month rolling average of sales, then uses pandas groupby month to summarize the results.
Handling Fiscal Years
Sometimes you may need to group by fiscal years instead of calendar years:
import pandas as pd

# Create a sample DataFrame
df = pd.DataFrame({
    'date': pd.date_range(start='2023-01-01', end='2024-12-31', freq='D'),
    'sales': [100 + i for i in range(731)]
})

# Define a function to get fiscal year
def get_fiscal_year(date):
    if date.month >= 7:
        return date.year + 1
    else:
        return date.year

# Add fiscal year column
df['fiscal_year'] = df['date'].apply(get_fiscal_year)

# Group by fiscal year and month
fiscal_monthly_sales = df.groupby([df['fiscal_year'], df['date'].dt.to_period('M')])['sales'].sum()

print("Monthly sales by fiscal year:")
print(fiscal_monthly_sales)
Output:
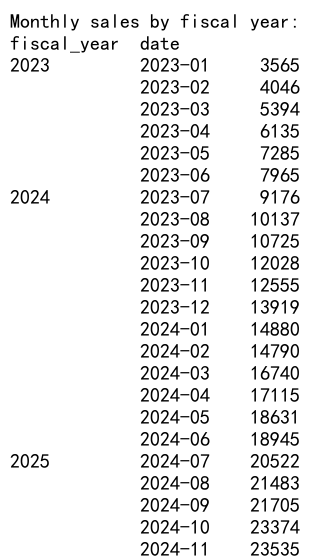
This example demonstrates how to group data by fiscal year and month using pandas groupby month, which can be useful for businesses that operate on a fiscal year different from the calendar year.
Conclusion
Pandas groupby month is a powerful tool for time-based data analysis in Python. Throughout this article, we’ve explored various aspects of using pandas groupby month, from basic operations to advanced techniques and real-world applications.
 Pandas Dataframe