Mastering Pandas GroupBy and Sort
Pandas groupby sort operations are essential tools for data analysis and manipulation in Python. This comprehensive guide will explore the intricacies of using pandas groupby and sort functions together to efficiently organize and analyze your data. We’ll cover various aspects of these powerful features, providing detailed explanations and practical examples to help you master these techniques.
Understanding Pandas GroupBy and Sort Basics
Pandas groupby and sort operations are fundamental to data manipulation and analysis. The groupby function allows you to split your data into groups based on specific criteria, while the sort function helps you arrange your data in a particular order. When combined, these operations provide a powerful way to organize and analyze your data effectively.
Let’s start with a simple example to illustrate the basic usage of pandas groupby and sort:
import pandas as pd

# Create a sample DataFrame
df = pd.DataFrame({
    'Name': ['John', 'Alice', 'Bob', 'John', 'Alice'],
    'Age': [25, 30, 35, 25, 30],
    'Score': [80, 85, 90, 75, 88],
    'Website': ['pandasdataframe.com'] * 5
})

# Group by 'Name' and sort by 'Score' within each group
result = df.groupby('Name').apply(lambda x: x.sort_values('Score', ascending=False))

print(result)
Output:
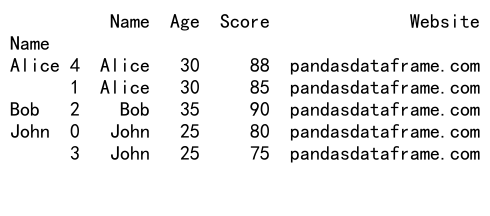
In this example, we create a sample DataFrame with information about individuals, including their names, ages, scores, and a website (pandasdataframe.com). We then use the groupby function to group the data by the ‘Name’ column and apply a lambda function to sort each group by the ‘Score’ column in descending order.
Exploring Advanced GroupBy and Sort Techniques
Pandas groupby and sort operations offer a wide range of advanced techniques to handle complex data manipulation tasks. Let’s explore some of these techniques in more detail.
Multiple Column Grouping and Sorting
You can group and sort data based on multiple columns to create more specific and meaningful groupings. Here’s an example:
import pandas as pd

# Create a sample DataFrame
df = pd.DataFrame({
    'Category': ['A', 'B', 'A', 'B', 'A'],
    'Subcategory': ['X', 'Y', 'Y', 'X', 'X'],
    'Value': [10, 15, 20, 25, 30],
    'Website': ['pandasdataframe.com'] * 5
})

# Group by 'Category' and 'Subcategory', then sort by 'Value' within each group
result = df.groupby(['Category', 'Subcategory']).apply(lambda x: x.sort_values('Value', ascending=False))

print(result)
Output:

In this example, we group the data by both ‘Category’ and ‘Subcategory’ columns, then sort the ‘Value’ column within each group in descending order. This approach allows for more granular organization of the data.
Aggregating Data with GroupBy and Sort
Pandas groupby and sort operations can be combined with aggregation functions to summarize data within groups. Here’s an example:
import pandas as pd

# Create a sample DataFrame
df = pd.DataFrame({
    'Department': ['Sales', 'HR', 'Sales', 'IT', 'HR'],
    'Employee': ['John', 'Alice', 'Bob', 'Charlie', 'David'],
    'Salary': [50000, 60000, 55000, 70000, 65000],
    'Website': ['pandasdataframe.com'] * 5
})

# Group by 'Department', calculate mean salary, and sort by mean salary
result = df.groupby('Department')['Salary'].mean().sort_values(ascending=False)

print(result)
Output:
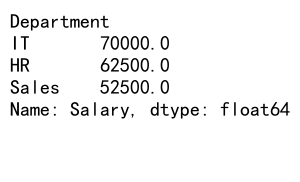
In this example, we group the data by the ‘Department’ column, calculate the mean salary for each department, and then sort the results by mean salary in descending order. This approach allows us to quickly identify the highest-paying departments.
Using Custom Sorting Functions
Pandas groupby and sort operations allow you to use custom sorting functions for more complex sorting requirements. Here’s an example:
import pandas as pd

# Create a sample DataFrame
df = pd.DataFrame({
    'Name': ['John', 'Alice', 'Bob', 'Charlie'],
    'Score': [85, 92, 78, 95],
    'Bonus': [5, 3, 7, 2],
    'Website': ['pandasdataframe.com'] * 4
})

# Define a custom sorting function
def custom_sort(group):
    return group.sort_values(by=['Score', 'Bonus'], ascending=[False, True])

# Apply the custom sorting function to the grouped data
result = df.groupby('Website').apply(custom_sort)

print(result)
Output:

In this example, we define a custom sorting function that sorts the data first by ‘Score’ in descending order, and then by ‘Bonus’ in ascending order. We then apply this custom sorting function to the grouped data.
Handling Missing Values in GroupBy and Sort Operations
When working with real-world data, you often encounter missing values. Pandas groupby and sort operations provide various ways to handle these missing values effectively.
Filling Missing Values Before Grouping and Sorting
One approach is to fill missing values before performing groupby and sort operations. Here’s an example:
import pandas as pd
import numpy as np

# Create a sample DataFrame with missing values
df = pd.DataFrame({
    'Category': ['A', 'B', 'A', 'B', 'A'],
    'Value': [10, np.nan, 20, 25, np.nan],
    'Website': ['pandasdataframe.com'] * 5
})

# Fill missing values with the mean of each category
df['Value'] = df.groupby('Category')['Value'].transform(lambda x: x.fillna(x.mean()))

# Group by 'Category' and sort by 'Value'
result = df.groupby('Category').apply(lambda x: x.sort_values('Value', ascending=False))

print(result)
Output:
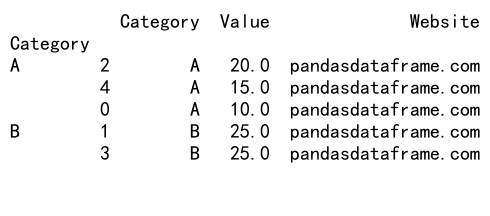
In this example, we first fill the missing values in the ‘Value’ column with the mean value of each category. Then, we perform the groupby and sort operations on the filled data.
Excluding Missing Values During Grouping and Sorting
Another approach is to exclude missing values during the groupby and sort operations. Here’s an example:
import pandas as pd
import numpy as np

# Create a sample DataFrame with missing values
df = pd.DataFrame({
    'Category': ['A', 'B', 'A', 'B', 'A'],
    'Value': [10, np.nan, 20, 25, np.nan],
    'Website': ['pandasdataframe.com'] * 5
})

# Group by 'Category', drop missing values, and sort by 'Value'
result = df.groupby('Category').apply(lambda x: x.dropna().sort_values('Value', ascending=False))

print(result)
Output:
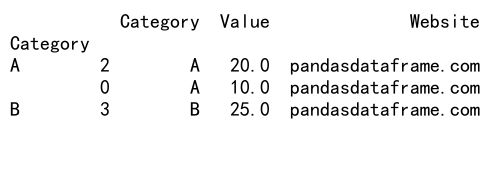
In this example, we use the dropna() function within the lambda function to exclude missing values before sorting each group.
Optimizing Performance in Pandas GroupBy and Sort Operations
When working with large datasets, optimizing the performance of pandas groupby and sort operations becomes crucial. Here are some techniques to improve efficiency:
Using Sorted Data
If your data is already sorted, you can take advantage of this to improve performance. Here’s an example:
import pandas as pd

# Create a sample DataFrame (assume it's already sorted by 'Category')
df = pd.DataFrame({
    'Category': ['A', 'A', 'B', 'B', 'C'],
    'Value': [10, 20, 15, 25, 30],
    'Website': ['pandasdataframe.com'] * 5
})

# Use sort=False when the data is already sorted
result = df.groupby('Category', sort=False).apply(lambda x: x.sort_values('Value', ascending=False))

print(result)
Output:
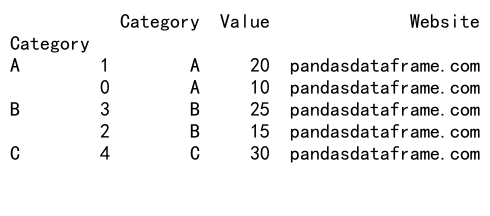
In this example, we use the sort=False parameter in the groupby function because we assume the data is already sorted by the ‘Category’ column. This can significantly improve performance for large datasets.
Using Categorical Data Types
Converting string columns to categorical data types can improve memory usage and performance, especially for groupby operations. Here’s an example:
import pandas as pd

# Create a sample DataFrame
df = pd.DataFrame({
    'Category': ['A', 'B', 'A', 'B', 'A'] * 1000,
    'Value': range(5000),
    'Website': ['pandasdataframe.com'] * 5000
})

# Convert 'Category' to categorical type
df['Category'] = pd.Categorical(df['Category'])

# Group by 'Category' and sort by 'Value'
result = df.groupby('Category').apply(lambda x: x.sort_values('Value', ascending=False))

print(result.head())
Output:
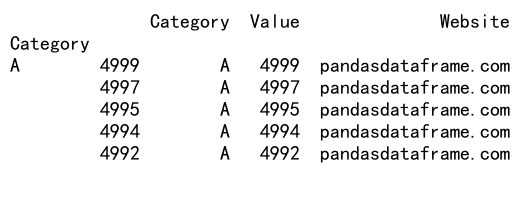
In this example, we convert the ‘Category’ column to a categorical data type before performing the groupby and sort operations. This can lead to significant performance improvements for large datasets with many repeated values.
Advanced GroupBy and Sort Techniques for Time Series Data
Pandas groupby and sort operations are particularly useful when working with time series data. Let’s explore some advanced techniques for handling time-based data.
Resampling and Sorting Time Series Data
Resampling allows you to change the frequency of your time series data. Here’s an example that combines resampling with groupby and sort operations:
import pandas as pd
import numpy as np

# Create a sample time series DataFrame
dates = pd.date_range('2023-01-01', periods=100, freq='D')
df = pd.DataFrame({
    'Date': dates,
    'Category': np.random.choice(['A', 'B', 'C'], 100),
    'Value': np.random.randn(100),
    'Website': ['pandasdataframe.com'] * 100
})

# Set 'Date' as the index
df.set_index('Date', inplace=True)

# Resample to monthly frequency, group by 'Category', and sort by mean 'Value'
result = df.resample('M').mean().groupby('Category').apply(lambda x: x.sort_values('Value', ascending=False))

print(result)
In this example, we create a time series DataFrame, resample it to monthly frequency, group by ‘Category’, and then sort each group by the mean ‘Value’ in descending order.
Rolling Window Calculations with GroupBy and Sort
Rolling window calculations are useful for analyzing trends over time. Here’s an example that combines rolling windows with groupby and sort operations:
import pandas as pd
import numpy as np

# Create a sample time series DataFrame
dates = pd.date_range('2023-01-01', periods=100, freq='D')
df = pd.DataFrame({
    'Date': dates,
    'Category': np.random.choice(['A', 'B', 'C'], 100),
    'Value': np.random.randn(100),
    'Website': ['pandasdataframe.com'] * 100
})

# Set 'Date' as the index
df.set_index('Date', inplace=True)

# Calculate 7-day rolling mean, group by 'Category', and sort by the last value
result = df.groupby('Category').apply(lambda x: x['Value'].rolling(window=7).mean().sort_values(ascending=False).tail(1))

print(result)
Output:
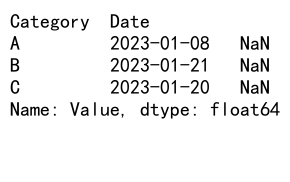
In this example, we calculate a 7-day rolling mean for each category, then sort the results by the last value in descending order. This approach allows us to identify which categories have the highest recent average values.
Visualizing GroupBy and Sort Results
Visualizing the results of pandas groupby and sort operations can provide valuable insights into your data. Let’s explore some techniques for creating informative visualizations.
Bar Plots for Grouped and Sorted Data
Bar plots are an effective way to visualize grouped and sorted data. Here’s an example:
import pandas as pd
import matplotlib.pyplot as plt

# Create a sample DataFrame
df = pd.DataFrame({
    'Category': ['A', 'B', 'C', 'A', 'B', 'C'],
    'Value': [10, 15, 20, 25, 30, 35],
    'Website': ['pandasdataframe.com'] * 6
})

# Group by 'Category', calculate mean 'Value', and sort
result = df.groupby('Category')['Value'].mean().sort_values(ascending=False)

# Create a bar plot
result.plot(kind='bar')
plt.title('Mean Value by Category')
plt.xlabel('Category')
plt.ylabel('Mean Value')
plt.show()
Output:
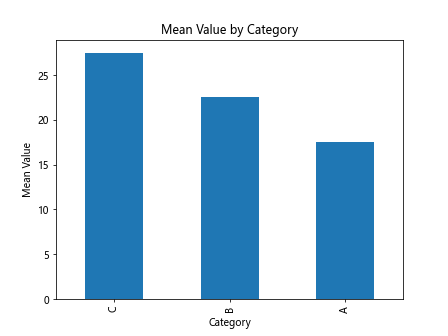
In this example, we group the data by ‘Category’, calculate the mean ‘Value’ for each category, sort the results, and then create a bar plot to visualize the mean values across categories.
Heatmaps for Multi-dimensional Grouped and Sorted Data
Heatmaps are useful for visualizing multi-dimensional grouped and sorted data. Here’s an example:
import pandas as pd
import seaborn as sns
import matplotlib.pyplot as plt

# Create a sample DataFrame
df = pd.DataFrame({
    'Category': ['A', 'B', 'C'] * 3,
    'Subcategory': ['X', 'Y', 'Z'] * 3,
    'Value': [10, 15, 20, 25, 30, 35, 40, 45, 50],
    'Website': ['pandasdataframe.com'] * 9
})

# Group by 'Category' and 'Subcategory', calculate mean 'Value'
result = df.groupby(['Category', 'Subcategory'])['Value'].mean().unstack()

# Create a heatmap
sns.heatmap(result, annot=True, cmap='YlOrRd')
plt.title('Mean Value by Category and Subcategory')
plt.show()
Output:
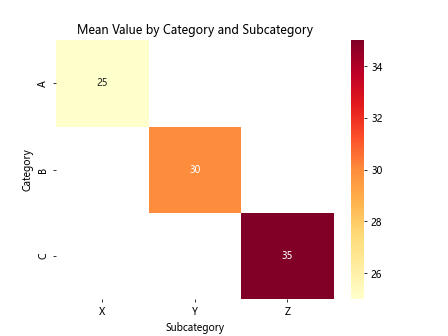
In this example, we group the data by both ‘Category’ and ‘Subcategory’, calculate the mean ‘Value’ for each group, and then create a heatmap to visualize the results. This approach allows us to easily identify patterns and trends across multiple dimensions.
Handling Large Datasets with Pandas GroupBy and Sort
When working with large datasets, memory management and efficient processing become crucial. Let’s explore some techniques for handling large datasets with pandas groupby and sort operations.
Chunking Large Datasets
For datasets that are too large to fit in memory, you can process them in chunks. Here’s an example:
import pandas as pd

# Function to process a chunk of data
def process_chunk(chunk):
    return chunk.groupby('Category')['Value'].mean().sort_values(ascending=False)

# Create a sample large CSV file (for demonstration purposes)
df = pd.DataFrame({
    'Category': ['A', 'B', 'C'] * 1000000,
    'Value': range(3000000),
    'Website': ['pandasdataframe.com'] * 3000000
})
df.to_csv('large_dataset.csv', index=False)

# Process the large CSV file in chunks
chunk_size = 100000
result = pd.DataFrame()

for chunk in pd.read_csv('large_dataset.csv', chunksize=chunk_size):
    chunk_result = process_chunk(chunk)
    result = pd.concat([result, chunk_result])

# Aggregate the results from all chunks
final_result = result.groupby(result.index).mean().sort_values(ascending=False)

print(final_result)
In this example, we define a function to process each chunk of data, then read the large CSV file in chunks, process each chunk, and concatenate the results. Finally, we aggregate the results from all chunks to get the final output.
Using Dask for Distributed Computing
For extremely large datasets that require distributed computing, you can use libraries like Dask. Here’s an example:
import dask.dataframe as dd

# Create a sample large CSV file (for demonstration purposes)
import pandas as pd
df = pd.DataFrame({
    'Category': ['A', 'B', 'C'] * 1000000,
    'Value': range(3000000),
    'Website': ['pandasdataframe.com'] * 3000000
})
df.to_csv('large_dataset.csv', index=False)

# Read the large CSV file as a Dask DataFrame
ddf = dd.read_csv('large_dataset.csv')

# Perform groupby and sort operations
result = ddf.groupby('Category')['Value'].mean().compute().sort_values(ascending=False)

print(result)
In this example, we use Dask to read a large CSV file as a Dask DataFrame, perform groupby and sort operations, and compute the final result. Dask allows for parallel processing of large datasets that don’t fit in memory.
Combining GroupBy and Sort with Other Pandas Operations
Pandas groupby and sort operations can be combined with other powerful pandas functions to perform complex data manipulations. Let’s explore some of these combinations.
Merging and Joining After GroupBy and Sort
You can use the results of groupby and sort operations to merge or join with other DataFrames. Here’s an example:
import pandas as pd

# Create two sample DataFrames
df1 = pd.DataFrame({
    'Category': ['A', 'B', 'C', 'A', 'B'],
    'Value': [10, 15, 20, 25, 30],
    'Website': ['pandasdataframe.com'] * 5
})

df2 = pd.DataFrame({
    'Category': ['A', 'B', 'C'],
    'Multiplier': [2, 3, 4],
    'Website': ['pandasdataframe.com'] * 3
})

# Group by 'Category', calculate mean 'Value', and sort
result1 = df1.groupby('Category')['Value'].mean().sort_values(ascending=False)

# Merge the result with df2
final_result = pd.merge(result1.reset_index(), df2, on='Category')

print(final_result)
Output:

In this example, we first perform a groupby and sort operation on df1, then merge the result with df2 based on the ‘Category’ column.
Applying Window Functions After GroupBy and Sort
Window functions can be applied after groupby and sort operations to perform calculations within each group. Here’s an example:
import pandas as pd

# Create a sample DataFrame
df = pd.DataFrame({
    'Category': ['A', 'B', 'A', 'B', 'A', 'B'],
    'Value': [10, 15, 20, 25, 30, 35],
    'Website': ['pandasdataframe.com'] * 6
})

# Group by 'Category', sort by 'Value', and apply a cumulative sum
result = df.groupby('Category').apply(lambda x: x.sort_values('Value').assign(CumSum=x['Value'].cumsum()))

print(result)
Output:
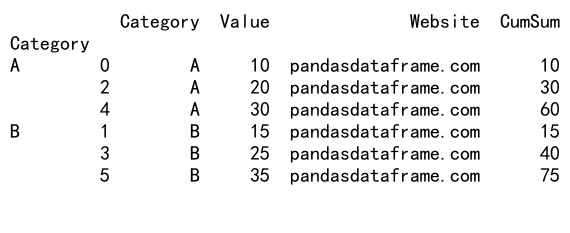
In this example, we group the data by ‘Category’, sort each group by ‘Value’, and then apply a cumulative sum within each group.
Best Practices for Pandas GroupBy and Sort Operations
To make the most of pandas groupby and sort operations, it’s important to follow some best practices. Here are some tips to improve your code efficiency and readability:
Use Method Chaining
Method chaining can make your code more concise and readable. Here’s an example:
import pandas as pd

# Create a sample DataFrame
df = pd.DataFrame({
    'Category': ['A', 'B', 'C', 'A', 'B', 'C'],
    'Value': [10, 15, 20, 25, 30, 35],
    'Website': ['pandasdataframe.com'] * 6
})

# Use method chaining for groupby and sort operations
result = (df
    .groupby('Category')
    .agg({'Value': ['mean', 'sum']})
    .sort_values(('Value', 'mean'), ascending=False)
)

print(result)
Output:
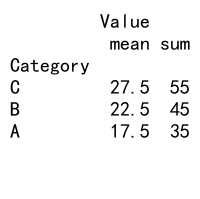
In this example, we use method chaining to group the data, calculate multiple aggregations, and sort the results in a single, readable statement.
Use Named Aggregations
Named aggregations can make your code more explicit and easier to understand. Here’s an example:
import pandas as pd

# Create a sample DataFrame
df = pd.DataFrame({
    'Category': ['A', 'B', 'C', 'A', 'B', 'C'],
    'Value': [10, 15, 20, 25, 30, 35],
    'Website': ['pandasdataframe.com'] * 6
})

# Use named aggregations
result = df.groupby('Category').agg(
    Mean_Value=('Value', 'mean'),
    Sum_Value=('Value', 'sum')
).sort_values('Mean_Value', ascending=False)

print(result)
Output:
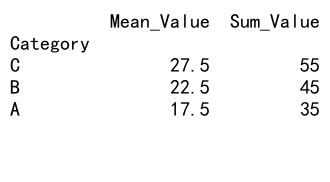
In this example, we use named aggregations to clearly specify the calculations we’re performing on each group.
Troubleshooting Common Issues in Pandas GroupBy and Sort Operations
When working with pandas groupby and sort operations, you may encounter some common issues. Let’s explore how to troubleshoot and resolve these problems.
Dealing with MultiIndex Results
GroupBy operations often result in MultiIndex DataFrames, which can be challenging to work with. Here’s how to handle them:
import pandas as pd

# Create a sample DataFrame
df = pd.DataFrame({
    'Category': ['A', 'B', 'A', 'B'],
    'Subcategory': ['X', 'Y', 'Y', 'X'],
    'Value': [10, 15, 20, 25],
    'Website': ['pandasdataframe.com'] * 4
})

# Perform groupby and sort operations
result = df.groupby(['Category', 'Subcategory']).mean().sort_values('Value', ascending=False)

# Reset the index to convert MultiIndex to columns
result_reset = result.reset_index()

print(result_reset)
In this example, we use the reset_index() method to convert the MultiIndex result into regular columns, making it easier to work with.
Handling Data Type Issues
Sometimes, groupby and sort operations can change the data types of your columns. Here’s how to handle this:
import pandas as pd

# Create a sample DataFrame
df = pd.DataFrame({
    'Category': ['A', 'B', 'A', 'B'],
    'Value': ['10', '15', '20', '25'],
    'Website': ['pandasdataframe.com'] * 4
})

# Convert 'Value' to numeric type before groupby and sort
df['Value'] = pd.to_numeric(df['Value'])

# Perform groupby and sort operations
result = df.groupby('Category')['Value'].mean().sort_values(ascending=False)

print(result)
Output:
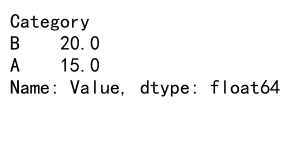
In this example, we use pd.to_numeric() to convert the ‘Value’ column to a numeric type before performing groupby and sort operations.
Advanced GroupBy and Sort Techniques for Data Analysis
Pandas groupby and sort operations can be powerful tools for advanced data analysis. Let’s explore some advanced techniques that combine these operations with other data analysis methods.
Pivot Tables with GroupBy and Sort
Pivot tables are an excellent way to summarize and analyze data. Here’s how to create a pivot table using groupby and sort operations:
import pandas as pd

# Create a sample DataFrame
df = pd.DataFrame({
    'Date': pd.date_range('2023-01-01', periods=12, freq='M'),
    'Category': ['A', 'B', 'C'] * 4,
    'Value': [10, 15, 20, 25, 30, 35, 40, 45, 50, 55, 60, 65],
    'Website': ['pandasdataframe.com'] * 12
})

# Create a pivot table
pivot_table = pd.pivot_table(df, values='Value', index='Category', columns='Date', aggfunc='sum')

# Sort the pivot table by the total value for each category
pivot_table['Total'] = pivot_table.sum(axis=1)
pivot_table_sorted = pivot_table.sort_values('Total', ascending=False).drop('Total', axis=1)

print(pivot_table_sorted)
Output:
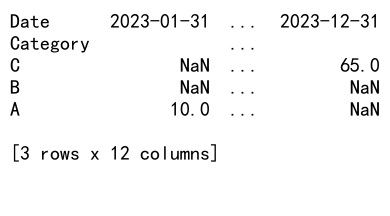
In this example, we create a pivot table from our DataFrame, then sort the categories based on their total values.
Time-based Analysis with GroupBy and Sort
For time series data, you can use groupby and sort operations to perform various time-based analyses. Here’s an example of calculating year-over-year growth:
import pandas as pd

# Create a sample DataFrame with time series data
df = pd.DataFrame({
    'Date': pd.date_range('2021-01-01', periods=24, freq='M'),
    'Category': ['A', 'B'] * 12,
    'Value': [100, 150, 110, 160, 120, 170, 130, 180, 140, 190, 150, 200,
              160, 210, 170, 220, 180, 230, 190, 240, 200, 250, 210, 260],
    'Website': ['pandasdataframe.com'] * 24
})

# Set 'Date' as the index
df.set_index('Date', inplace=True)

# Calculate year-over-year growth
df['YoY_Growth'] = df.groupby('Category')['Value'].pct_change(periods=12)

# Sort by the latest YoY growth for each category
latest_growth = df.groupby('Category')['YoY_Growth'].last().sort_values(ascending=False)

print(latest_growth)
Output:
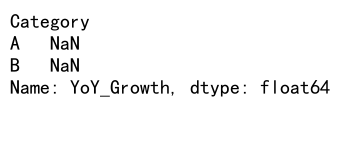
In this example, we calculate the year-over-year growth for each category and then sort the categories based on their latest growth rates.
Conclusion
Pandas groupby and sort operations are powerful tools for data manipulation and analysis. Throughout this comprehensive guide, we’ve explored various aspects of these functions, from basic usage to advanced techniques and best practices. By mastering these operations, you can efficiently organize, analyze, and gain insights from your data.
 Pandas Dataframe