Mastering Pandas GroupBy Shift: A Comprehensive Guide to Data Manipulation
Pandas groupby shift is a powerful combination of two essential DataFrame operations in the pandas library. This technique allows for sophisticated data manipulation and analysis, particularly useful when working with time series data or when you need to perform calculations based on previous or subsequent rows within groups. In this comprehensive guide, we’ll explore the ins and outs of pandas groupby shift, providing numerous examples and practical applications to help you master this invaluable tool.
Understanding the Basics of Pandas GroupBy Shift
Before diving into the more complex applications of pandas groupby shift, it’s crucial to understand the fundamental concepts behind this operation. The pandas groupby shift combines two primary functions: groupby() and shift().
The GroupBy Operation
The groupby() function in pandas allows you to split your data into groups based on one or more columns. This is particularly useful when you want to perform operations on specific subsets of your data.
Let’s start with a simple example:
import pandas as pd

# Create a sample DataFrame
df = pd.DataFrame({
    'group': ['A', 'A', 'B', 'B', 'A'],
    'value': [1, 2, 3, 4, 5]
})

# Group the DataFrame by the 'group' column
grouped = df.groupby('group')

# Calculate the mean for each group
result = grouped['value'].mean()

print("pandasdataframe.com - GroupBy Example:")
print(result)
Output:
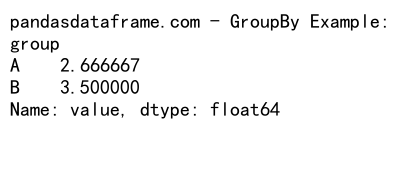
In this example, we create a DataFrame with a ‘group’ column and a ‘value’ column. We then use groupby() to group the data by the ‘group’ column and calculate the mean of the ‘value’ column for each group.
The Shift Operation
The shift() function in pandas allows you to shift the index of a DataFrame or Series by a specified number of periods. This is particularly useful when you want to access values from previous or subsequent rows.
Here’s a basic example of the shift() function:
import pandas as pd

# Create a sample DataFrame
df = pd.DataFrame({
    'date': pd.date_range(start='2023-01-01', periods=5),
    'value': [10, 20, 30, 40, 50]
})

# Shift the 'value' column by 1 period
df['previous_value'] = df['value'].shift(1)

print("pandasdataframe.com - Shift Example:")
print(df)
Output:
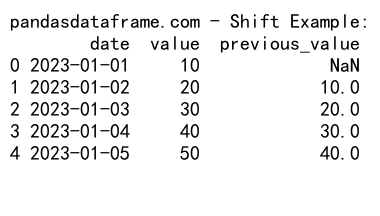
In this example, we create a DataFrame with a ‘date’ column and a ‘value’ column. We then use shift() to create a new column ‘previous_value’ that contains the values from the ‘value’ column shifted by one period.
Combining GroupBy and Shift
Now that we understand the basics of groupby() and shift(), let’s explore how we can combine these operations to perform more complex data manipulations.
Shifting Within Groups
One of the most common use cases for pandas groupby shift is to shift values within specific groups. This is particularly useful when working with time series data or when you need to compare values to previous or subsequent rows within the same group.
Let’s look at an example:
import pandas as pd

# Create a sample DataFrame
df = pd.DataFrame({
    'group': ['A', 'A', 'A', 'B', 'B', 'B'],
    'date': pd.date_range(start='2023-01-01', periods=6),
    'value': [10, 20, 30, 40, 50, 60]
})

# Shift the 'value' column within each group
df['previous_value'] = df.groupby('group')['value'].shift(1)

print("pandasdataframe.com - GroupBy Shift Example:")
print(df)
Output:
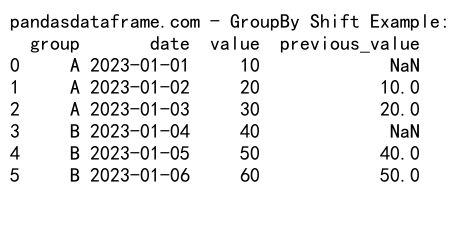
In this example, we create a DataFrame with ‘group’, ‘date’, and ‘value’ columns. We then use groupby() in combination with shift() to create a new column ‘previous_value’ that contains the values from the ‘value’ column shifted by one period within each group.
Calculating Differences Within Groups
A common application of pandas groupby shift is to calculate differences between consecutive rows within groups. This is particularly useful for analyzing changes over time or calculating growth rates.
Here’s an example:
import pandas as pd

# Create a sample DataFrame
df = pd.DataFrame({
    'group': ['A', 'A', 'A', 'B', 'B', 'B'],
    'date': pd.date_range(start='2023-01-01', periods=6),
    'value': [100, 110, 120, 200, 220, 240]
})

# Calculate the difference between consecutive rows within each group
df['value_diff'] = df.groupby('group')['value'].diff()

print("pandasdataframe.com - GroupBy Shift Difference Example:")
print(df)
Output:
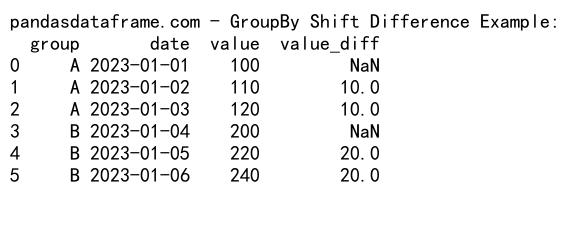
In this example, we use groupby() in combination with diff() (which internally uses shift()) to calculate the difference between consecutive ‘value’ entries within each group.
Advanced Applications of Pandas GroupBy Shift
Now that we’ve covered the basics, let’s explore some more advanced applications of pandas groupby shift.
Calculating Percentage Changes
Percentage changes are often used in financial analysis and other fields to measure relative changes over time. We can use pandas groupby shift to calculate percentage changes within groups.
import pandas as pd

# Create a sample DataFrame
df = pd.DataFrame({
    'stock': ['AAPL', 'AAPL', 'AAPL', 'GOOGL', 'GOOGL', 'GOOGL'],
    'date': pd.date_range(start='2023-01-01', periods=6),
    'price': [150, 155, 160, 2800, 2850, 2900]
})

# Calculate percentage change within each group
df['pct_change'] = df.groupby('stock')['price'].pct_change()

print("pandasdataframe.com - GroupBy Shift Percentage Change Example:")
print(df)
Output:
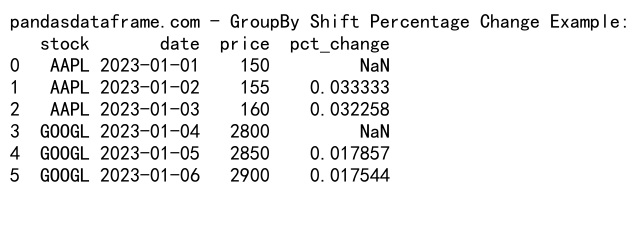
In this example, we use groupby() in combination with pct_change() (which internally uses shift()) to calculate the percentage change in stock prices within each stock group.
Rolling Calculations Within Groups
Rolling calculations, such as moving averages, are commonly used in time series analysis. We can combine pandas groupby shift with rolling calculations to perform these operations within groups.
import pandas as pd

# Create a sample DataFrame
df = pd.DataFrame({
    'group': ['A', 'A', 'A', 'A', 'B', 'B', 'B', 'B'],
    'date': pd.date_range(start='2023-01-01', periods=8),
    'value': [10, 20, 30, 40, 50, 60, 70, 80]
})

# Calculate a 3-day rolling average within each group
df['rolling_avg'] = df.groupby('group')['value'].rolling(window=3).mean().reset_index(level=0, drop=True)

print("pandasdataframe.com - GroupBy Shift Rolling Average Example:")
print(df)
Output:
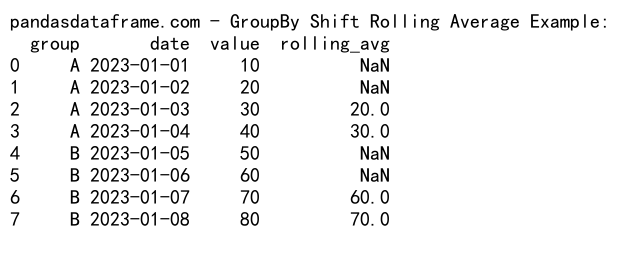
In this example, we use groupby() in combination with rolling() and mean() to calculate a 3-day rolling average of the ‘value’ column within each group.
Lag and Lead Operations
Lag and lead operations are useful when you want to compare current values with past or future values within groups. Pandas groupby shift makes these operations straightforward.
import pandas as pd

# Create a sample DataFrame
df = pd.DataFrame({
    'group': ['A', 'A', 'A', 'B', 'B', 'B'],
    'date': pd.date_range(start='2023-01-01', periods=6),
    'value': [10, 20, 30, 40, 50, 60]
})

# Create lag and lead columns within each group
df['lag_1'] = df.groupby('group')['value'].shift(1)  # Previous value
df['lead_1'] = df.groupby('group')['value'].shift(-1)  # Next value

print("pandasdataframe.com - GroupBy Shift Lag and Lead Example:")
print(df)
Output:
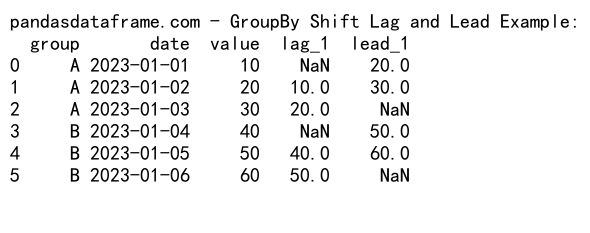
In this example, we use groupby() and shift() to create lag and lead columns within each group. The ‘lag_1’ column contains the previous value, while the ‘lead_1’ column contains the next value within each group.
Handling Missing Values in Pandas GroupBy Shift
When using pandas groupby shift, you may encounter missing values, especially at the beginning or end of groups. Let’s explore some strategies for handling these missing values.
Filling Missing Values with a Specific Value
One approach is to fill missing values with a specific value using the fillna() method.
import pandas as pd

# Create a sample DataFrame
df = pd.DataFrame({
    'group': ['A', 'A', 'A', 'B', 'B', 'B'],
    'date': pd.date_range(start='2023-01-01', periods=6),
    'value': [10, 20, 30, 40, 50, 60]
})

# Shift values and fill missing values with 0
df['shifted_value'] = df.groupby('group')['value'].shift(1).fillna(0)

print("pandasdataframe.com - GroupBy Shift Fill Missing Values Example:")
print(df)
Output:
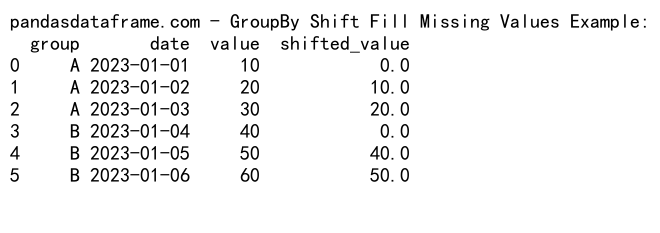
In this example, we use groupby() and shift() to create a shifted column, and then use fillna() to replace any missing values with 0.
Forward Fill Within Groups
Another approach is to use forward fill (ffill) to propagate the last valid observation forward to next valid.
import pandas as pd

# Create a sample DataFrame
df = pd.DataFrame({
    'group': ['A', 'A', 'A', 'B', 'B', 'B'],
    'date': pd.date_range(start='2023-01-01', periods=6),
    'value': [10, 20, 30, 40, 50, 60]
})

# Shift values and forward fill within groups
df['shifted_value'] = df.groupby('group')['value'].shift(1).ffill()

print("pandasdataframe.com - GroupBy Shift Forward Fill Example:")
print(df)
Output:
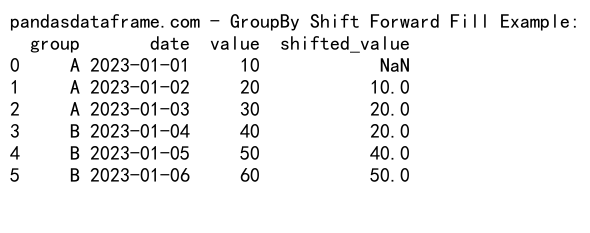
In this example, we use groupby() and shift() to create a shifted column, and then use ffill() to forward fill missing values within each group.
Applying Custom Functions with Pandas GroupBy Shift
Pandas groupby shift allows you to apply custom functions to your data, enabling more complex and specific operations.
Using Apply with Lambda Functions
You can use the apply() method with a lambda function to perform custom operations on your grouped data.
import pandas as pd

# Create a sample DataFrame
df = pd.DataFrame({
    'group': ['A', 'A', 'A', 'B', 'B', 'B'],
    'date': pd.date_range(start='2023-01-01', periods=6),
    'value': [10, 20, 30, 40, 50, 60]
})

# Apply a custom function to calculate the difference from the group mean
df['diff_from_mean'] = df.groupby('group')['value'].apply(lambda x: x - x.mean())

print("pandasdataframe.com - GroupBy Shift Apply Lambda Example:")
print(df)
In this example, we use groupby() and apply() with a lambda function to calculate the difference of each value from its group mean.
Using Named Functions for More Complex Operations
For more complex operations, you can define a named function and use it with apply().
import pandas as pd

def calculate_cumulative_sum(group):
    return group.cumsum() - group.iloc[0]

# Create a sample DataFrame
df = pd.DataFrame({
    'group': ['A', 'A', 'A', 'B', 'B', 'B'],
    'date': pd.date_range(start='2023-01-01', periods=6),
    'value': [10, 20, 30, 40, 50, 60]
})

# Apply the custom function to calculate cumulative sum within groups
df['cumulative_sum'] = df.groupby('group')['value'].apply(calculate_cumulative_sum)

print("pandasdataframe.com - GroupBy Shift Apply Named Function Example:")
print(df)
In this example, we define a custom function calculate_cumulative_sum() and use it with groupby() and apply() to calculate the cumulative sum within each group, starting from 0 for each group.
Performance Considerations in Pandas GroupBy Shift
While pandas groupby shift is a powerful tool, it’s important to consider performance, especially when working with large datasets. Here are some tips to optimize your pandas groupby shift operations:
Use Built-in Methods When Possible
Pandas has many built-in methods that are optimized for performance. Whenever possible, use these methods instead of applying custom functions.
import pandas as pd

# Create a sample DataFrame
df = pd.DataFrame({
    'group': ['A', 'A', 'A', 'B', 'B', 'B'],
    'date': pd.date_range(start='2023-01-01', periods=6),
    'value': [10, 20, 30, 40, 50, 60]
})

# Use built-in diff() method instead of a custom function
df['value_diff'] = df.groupby('group')['value'].diff()

print("pandasdataframe.com - GroupBy Shift Performance Example:")
print(df)
Output:
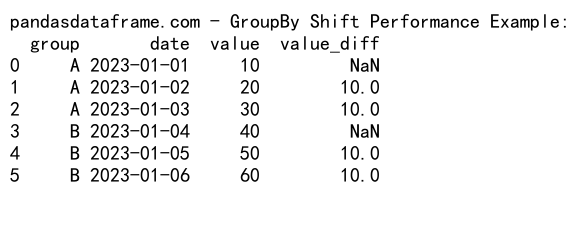
In this example, we use the built-in diff() method, which is more efficient than writing a custom function to calculate differences.
Avoid Unnecessary Grouping
If you’re performing multiple operations on the same grouped data, it’s more efficient to create a grouped object once and reuse it.
import pandas as pd

# Create a sample DataFrame
df = pd.DataFrame({
    'group': ['A', 'A', 'A', 'B', 'B', 'B'],
    'date': pd.date_range(start='2023-01-01', periods=6),
    'value': [10, 20, 30, 40, 50, 60]
})

# Create a grouped object once
grouped = df.groupby('group')

# Perform multiple operations using the same grouped object
df['value_diff'] = grouped['value'].diff()
df['value_pct_change'] = grouped['value'].pct_change()

print("pandasdataframe.com - GroupBy Shift Efficiency Example:")
print(df)
Output:
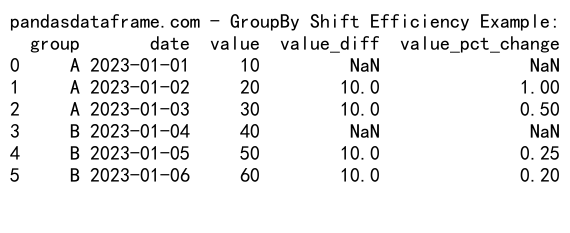
In this example, we create a grouped object once and use it for multiple operations, which is more efficient than grouping the data multiple times.
Common Pitfalls and How to Avoid Them
When working with pandas groupby shift, there are some common pitfalls that you should be aware of:
Forgetting to Reset the Index
After performing groupby operations, the index of your DataFrame may change. It’s often necessary to reset the index to avoid issues in subsequent operations.
import pandas as pd

# Create a sample DataFrame
df = pd.DataFrame({
    'group': ['A', 'A', 'B', 'B'],
    'value': [1, 2, 3, 4]
})

# Perform a groupby operation
result = df.groupby('group').sum().reset_index()

print("pandasdataframe.com - GroupBy Shift Reset Index Example:")
print(result)
Output:

In this example, we use reset_index() after the groupby operation to ensure that the resulting DataFrame has a standard integer index.
Handling Multi-Index Results
Some groupby operations result in a DataFrame with a multi-index. It’s important to handle these correctly to avoid errors.
import pandas as pd

# Create a sample DataFrame
df = pd.DataFrame({
    'group1': ['A', 'A', 'B', 'B'],
    'group2': ['X', 'Y', 'X', 'Y'],
    'value': [1, 2, 3, 4]
})

# Perform a groupby operation with multiple groups
result = df.groupby(['group1', 'group2']).sum()

# Access data using the multi-index
value_a_x = result.loc[('A', 'X'), 'value']

print("pandasdataframe.com - GroupBy Shift Multi-Index Example:")
print(result)
print(f"Value for group A, X: {value_a_x}")
Output:
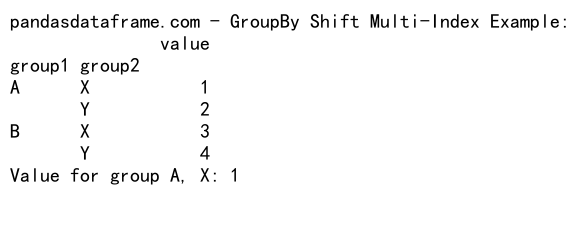
In this example, we perform a groupby operation with multiple groups, resulting in a DataFrame with a multi-index. We then demonstrate how to access data using this multi-index.
Real-World Applications of Pandas GroupBy Shift
Pandas groupby shift has numerous real-world applications across various industries. Let’s explore some practical examples:
Financial Analysis: Calculating Returns
In financial analysis, calculating returns is a common task. Pandas groupby shift can be used to efficiently calculate returns for multiple stocks.
import pandas as pd
import numpy as np

# Create a sample DataFrame with stock prices
df = pd.DataFrame({
    'date': pd.date_range(start='2023-01-01', periods=10),
    'stock': ['AAPL', 'GOOGL'] * 5,
    'price': np.random.randint(100, 200, 10)
})

# Calculate daily returns
df['daily_return'] = df.groupby('stock')['price'].pct_change()

print("pandasdataframe.com - GroupBy Shift Financial Analysis Example:")
print(df)
Output:
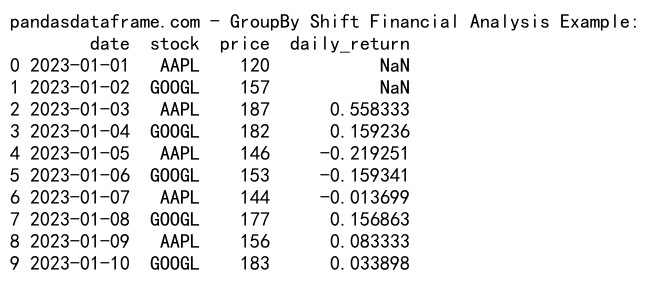
In this example, we use groupby() and pct_change() to calculate daily returns for each stock.
Time Series Analysis: Seasonal Decomposition
In time series analysis, it’s often useful to decompose a series into trend, seasonal, and residual components. Pandas groupby shift can help with this process.
import pandas as pd
import numpy as np

# Create a sample time series DataFrame
df = pd.DataFrame({
    'date': pd.date_range(start='2023-01-01', periods=365),
    'value': np.random.randn(365) + np.sin(np.arange(365) * 2 * np.pi / 365) * 10 + np.arange(365) * 0.1
})

# Calculate 7-day moving average (trend)
df['trend'] = df['value'].rolling(window=7).mean()

# Calculate seasonal component
df['seasonal'] = df.groupby(df['date'].dt.dayofyear)['value'].transform(lambda x: x.mean())

# Calculate residual
df['residual'] = df['value'] - df['trend'] - df['seasonal']

print("pandasdataframe.com - GroupBy Shift Time Series Analysis Example:")
print(df.head(10))
Output:
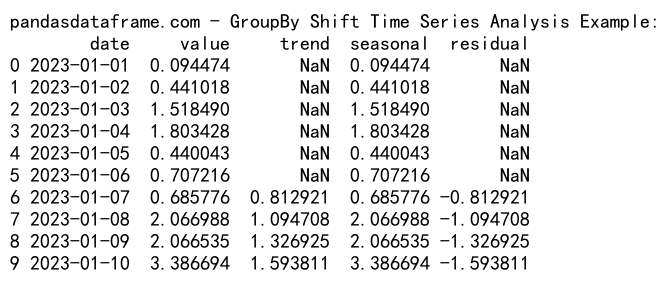
In this example, we use a combination of rolling() for trend calculation and groupby() with transform() for seasonal component calculation.
Sales Analysis: Year-over-Year Growth
In sales analysis, comparing current performance to previous years is crucial. Pandas groupby shift can be used to calculate year-over-year growth.
import pandas as pd
import numpy as np

# Create a sample sales DataFrame
df = pd.DataFrame({
    'date': pd.date_range(start='2021-01-01', end='2023-12-31', freq='D'),
    'sales': np.random.randint(1000, 2000, 1096)
})

# Calculate year-over-year growth
df['yoy_growth'] = df.groupby(df['date'].dt.dayofyear)['sales'].pct_change(periods=365)

print("pandasdataframe.com - GroupBy Shift Sales Analysis Example:")
print(df.head(10))
In this example, we use groupby() with the day of the year and pct_change() with a period of 365 to calculate year-over-year growth.
Advanced Techniques with Pandas GroupBy Shift
As you become more comfortable with pandas groupby shift, you can explore more advanced techniques to handle complex data manipulation tasks.
Multiple Shifts Within Groups
Sometimes you might need to shift data by multiple periods within groups. This can be achieved by applying shift() multiple times or using a custom function.
import pandas as pd

# Create a sample DataFrame
df = pd.DataFrame({
    'group': ['A', 'A', 'A', 'B', 'B', 'B'],
    'date': pd.date_range(start='2023-01-01', periods=6),
    'value': [10, 20, 30, 40, 50, 60]
})

# Shift by 1 and 2 periods within groups
df['shift_1'] = df.groupby('group')['value'].shift(1)
df['shift_2'] = df.groupby('group')['value'].shift(2)

print("pandasdataframe.com - GroupBy Shift Multiple Shifts Example:")
print(df)
Output:
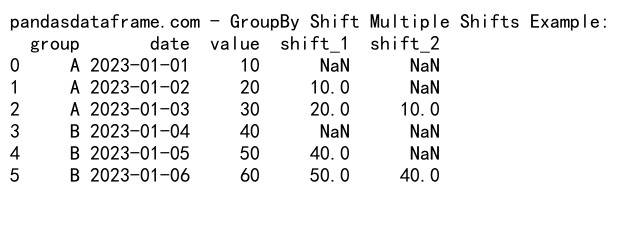
In this example, we apply shift() twice to create columns with data shifted by 1 and 2 periods within each group.
Combining Multiple Group Levels
In some cases, you might need to perform operations based on multiple group levels. Pandas groupby shift can handle this as well.
import pandas as pd

# Create a sample DataFrame
df = pd.DataFrame({
    'group1': ['A', 'A', 'A', 'B', 'B', 'B'],
    'group2': ['X', 'Y', 'X', 'Y', 'X', 'Y'],
    'date': pd.date_range(start='2023-01-01', periods=6),
    'value': [10, 20, 30, 40, 50, 60]
})

# Shift values based on multiple group levels
df['shifted_value'] = df.groupby(['group1', 'group2'])['value'].shift(1)

print("pandasdataframe.com - GroupBy Shift Multiple Group Levels Example:")
print(df)
Output:
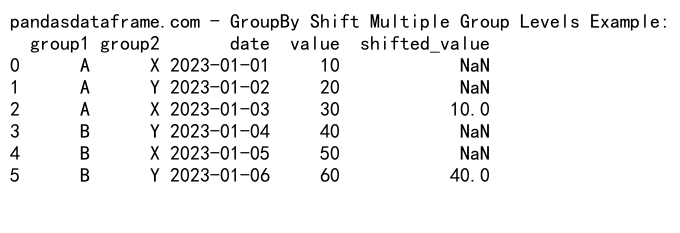
In this example, we use groupby() with multiple columns to shift values based on combinations of ‘group1’ and ‘group2’.
Conclusion
Pandas groupby shift is a powerful tool in the data scientist’s toolkit, enabling sophisticated data manipulation and analysis. From basic operations like calculating differences and percentage changes to more advanced techniques like time series analysis and multi-level grouping, this combination of pandas functions offers a wide range of possibilities.
 Pandas Dataframe