Mastering Pandas GroupBy Mean
Pandas groupby mean is a powerful technique for data analysis and aggregation in Python. This article will explore the ins and outs of using pandas groupby mean to summarize and analyze your data effectively. We’ll cover various aspects of this functionality, from basic usage to advanced techniques, providing you with a thorough understanding of how to leverage pandas groupby mean in your data science projects.
Introduction to Pandas GroupBy Mean
Pandas groupby mean is a combination of two essential operations in the pandas library: groupby and mean. The groupby operation allows you to split your data into groups based on one or more columns, while the mean function calculates the average of numerical values within each group. This powerful combination enables you to quickly summarize large datasets and gain insights into patterns and trends.
Let’s start with a simple example to illustrate the basic usage of pandas groupby mean:
import pandas as pd

# Create a sample DataFrame
df = pd.DataFrame({
    'Category': ['A', 'B', 'A', 'B', 'A', 'B'],
    'Value': [10, 15, 20, 25, 30, 35],
    'Website': ['pandasdataframe.com'] * 6
})

# Calculate the mean of 'Value' for each 'Category'
result = df.groupby('Category')['Value'].mean()

print(result)
Output:
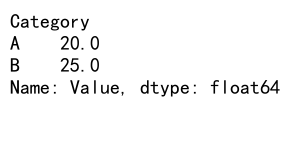
In this example, we create a simple DataFrame with ‘Category’ and ‘Value’ columns. We then use pandas groupby mean to calculate the average ‘Value’ for each ‘Category’. The result will show the mean value for categories A and B.
Understanding the Pandas GroupBy Operation
Before diving deeper into pandas groupby mean, it’s essential to understand the groupby operation itself. The groupby function in pandas allows you to split your data into groups based on one or more columns. This operation creates a GroupBy object, which you can then apply various aggregation functions to, including mean.
Here’s an example that demonstrates the groupby operation:
import pandas as pd

# Create a sample DataFrame
df = pd.DataFrame({
    'Category': ['A', 'B', 'A', 'B', 'A', 'B'],
    'Value1': [10, 15, 20, 25, 30, 35],
    'Value2': [5, 10, 15, 20, 25, 30],
    'Website': ['pandasdataframe.com'] * 6
})

# Group the DataFrame by 'Category'
grouped = df.groupby('Category')

# Print the groups
for name, group in grouped:
    print(f"Group: {name}")
    print(group)
    print()
Output:
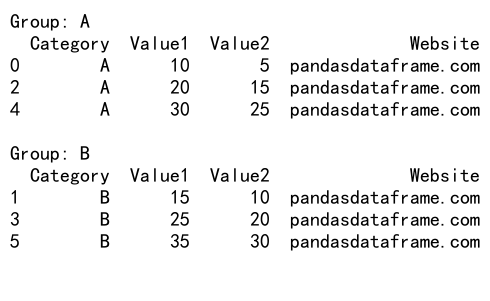
In this example, we create a DataFrame with multiple columns and use the groupby function to group it by the ‘Category’ column. We then iterate through the groups to see how the data is split.
Applying Mean to GroupBy Objects
Now that we understand the groupby operation, let’s explore how to apply the mean function to GroupBy objects. The mean function calculates the average of numerical values within each group, providing a summary statistic for your data.
Here’s an example of using pandas groupby mean with multiple columns:
import pandas as pd

# Create a sample DataFrame
df = pd.DataFrame({
    'Category': ['A', 'B', 'A', 'B', 'A', 'B'],
    'Value1': [10, 15, 20, 25, 30, 35],
    'Value2': [5, 10, 15, 20, 25, 30],
    'Website': ['pandasdataframe.com'] * 6
})

# Calculate the mean of 'Value1' and 'Value2' for each 'Category'
result = df.groupby('Category')[['Value1', 'Value2']].mean()

print(result)
Output:
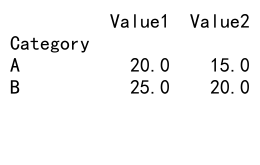
In this example, we calculate the mean of both ‘Value1’ and ‘Value2’ columns for each category. The result will show the average values for both columns, grouped by category.
Handling Missing Values in Pandas GroupBy Mean
When working with real-world data, you’ll often encounter missing values. Pandas groupby mean provides options for handling these missing values during the aggregation process. By default, pandas groupby mean excludes missing values from the calculation.
Let’s look at an example that demonstrates how pandas groupby mean handles missing values:
import pandas as pd
import numpy as np

# Create a sample DataFrame with missing values
df = pd.DataFrame({
    'Category': ['A', 'B', 'A', 'B', 'A', 'B'],
    'Value': [10, 15, np.nan, 25, 30, np.nan],
    'Website': ['pandasdataframe.com'] * 6
})

# Calculate the mean of 'Value' for each 'Category'
result = df.groupby('Category')['Value'].mean()

print(result)
Output:
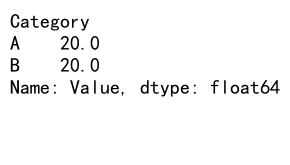
In this example, we introduce NaN (Not a Number) values to the ‘Value’ column. When we apply pandas groupby mean, it automatically excludes these missing values from the calculation, providing the average of the available values for each category.
Multiple Grouping Columns with Pandas GroupBy Mean
Pandas groupby mean allows you to group your data by multiple columns, providing more granular insights into your dataset. This is particularly useful when you want to analyze data across multiple dimensions.
Here’s an example of using pandas groupby mean with multiple grouping columns:
import pandas as pd

# Create a sample DataFrame
df = pd.DataFrame({
    'Category': ['A', 'B', 'A', 'B', 'A', 'B'],
    'Subcategory': ['X', 'Y', 'X', 'Y', 'Y', 'X'],
    'Value': [10, 15, 20, 25, 30, 35],
    'Website': ['pandasdataframe.com'] * 6
})

# Calculate the mean of 'Value' for each combination of 'Category' and 'Subcategory'
result = df.groupby(['Category', 'Subcategory'])['Value'].mean()

print(result)
Output:
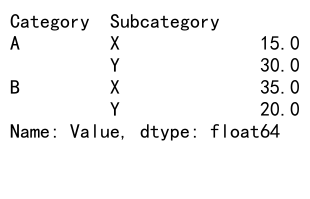
In this example, we group the data by both ‘Category’ and ‘Subcategory’ columns before calculating the mean of the ‘Value’ column. The result will show the average value for each unique combination of category and subcategory.
Customizing Pandas GroupBy Mean Output
Pandas groupby mean offers various options to customize the output of your aggregation. You can rename columns, reset the index, and format the results to suit your needs.
Let’s explore some customization options:
import pandas as pd

# Create a sample DataFrame
df = pd.DataFrame({
    'Category': ['A', 'B', 'A', 'B', 'A', 'B'],
    'Value1': [10, 15, 20, 25, 30, 35],
    'Value2': [5, 10, 15, 20, 25, 30],
    'Website': ['pandasdataframe.com'] * 6
})

# Calculate the mean and customize the output
result = df.groupby('Category').agg({
    'Value1': ('mean', 'Average Value 1'),
    'Value2': ('mean', 'Average Value 2')
}).reset_index()

print(result)
In this example, we use the agg function to apply the mean aggregation and rename the resulting columns. We also use reset_index to convert the grouping column back to a regular column in the result.
Combining Pandas GroupBy Mean with Other Aggregations
Pandas groupby mean can be combined with other aggregation functions to provide a more comprehensive summary of your data. This allows you to calculate multiple statistics for each group in a single operation.
Here’s an example that combines mean with other aggregations:
import pandas as pd

# Create a sample DataFrame
df = pd.DataFrame({
    'Category': ['A', 'B', 'A', 'B', 'A', 'B'],
    'Value': [10, 15, 20, 25, 30, 35],
    'Website': ['pandasdataframe.com'] * 6
})

# Calculate multiple aggregations for each category
result = df.groupby('Category')['Value'].agg(['mean', 'min', 'max', 'count'])

print(result)
Output:
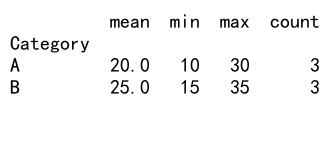
In this example, we calculate the mean, minimum, maximum, and count of the ‘Value’ column for each category. This provides a more comprehensive summary of the data within each group.
Filtering Groups in Pandas GroupBy Mean
Sometimes you may want to apply pandas groupby mean only to specific groups that meet certain criteria. Pandas provides methods to filter groups based on various conditions before applying the mean aggregation.
Here’s an example of filtering groups before applying pandas groupby mean:
import pandas as pd

# Create a sample DataFrame
df = pd.DataFrame({
    'Category': ['A', 'B', 'C', 'A', 'B', 'C'],
    'Value': [10, 15, 20, 25, 30, 35],
    'Website': ['pandasdataframe.com'] * 6
})

# Filter groups with more than one item and calculate the mean
result = df.groupby('Category').filter(lambda x: len(x) > 1)['Value'].mean()

print(result)
Output:

In this example, we use the filter function to select only groups with more than one item before calculating the mean of the ‘Value’ column. This allows you to focus on groups that meet specific criteria in your analysis.
Handling Time Series Data with Pandas GroupBy Mean
Pandas groupby mean is particularly useful when working with time series data. You can group data by various time intervals and calculate the mean to identify trends and patterns over time.
Let’s look at an example of using pandas groupby mean with time series data:
import pandas as pd

# Create a sample DataFrame with time series data
df = pd.DataFrame({
    'Date': pd.date_range(start='2023-01-01', periods=10, freq='D'),
    'Value': [10, 15, 20, 25, 30, 35, 40, 45, 50, 55],
    'Website': ['pandasdataframe.com'] * 10
})

# Group by month and calculate the mean
result = df.groupby(df['Date'].dt.to_period('M'))['Value'].mean()

print(result)
Output:
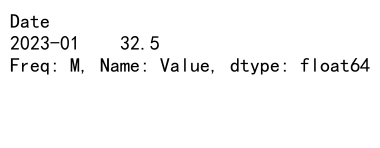
In this example, we create a DataFrame with daily data and use pandas groupby mean to calculate the average value for each month. This allows you to analyze trends on a monthly basis.
Advanced Techniques with Pandas GroupBy Mean
As you become more comfortable with pandas groupby mean, you can explore more advanced techniques to enhance your data analysis. Let’s look at some advanced applications of this functionality.
Using Transform with Pandas GroupBy Mean
The transform function allows you to apply pandas groupby mean while maintaining the original shape of your DataFrame. This is useful when you want to compare individual values to group means.
import pandas as pd

# Create a sample DataFrame
df = pd.DataFrame({
    'Category': ['A', 'B', 'A', 'B', 'A', 'B'],
    'Value': [10, 15, 20, 25, 30, 35],
    'Website': ['pandasdataframe.com'] * 6
})

# Calculate group means and add them as a new column
df['Group_Mean'] = df.groupby('Category')['Value'].transform('mean')

print(df)
Output:
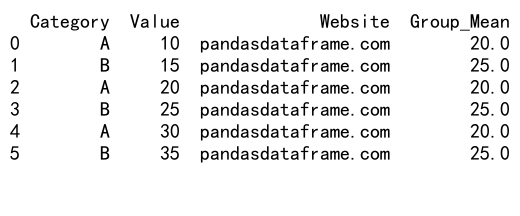
In this example, we use transform to calculate the group means and add them as a new column to the original DataFrame. This allows for easy comparison between individual values and their respective group means.
Applying Pandas GroupBy Mean to Specific Columns
When working with large datasets, you may want to apply pandas groupby mean only to specific columns while keeping others unchanged. Here’s how you can do that:
import pandas as pd

# Create a sample DataFrame
df = pd.DataFrame({
    'Category': ['A', 'B', 'A', 'B', 'A', 'B'],
    'Value1': [10, 15, 20, 25, 30, 35],
    'Value2': [5, 10, 15, 20, 25, 30],
    'Text': ['a', 'b', 'c', 'd', 'e', 'f'],
    'Website': ['pandasdataframe.com'] * 6
})

# Apply mean to numeric columns and first to non-numeric columns
result = df.groupby('Category').agg({
    'Value1': 'mean',
    'Value2': 'mean',
    'Text': 'first',
    'Website': 'first'
})

print(result)
Output:

In this example, we apply the mean function to numeric columns and the ‘first’ function to non-numeric columns. This allows you to maintain non-numeric data while still calculating means for numeric columns.
Optimizing Performance with Pandas GroupBy Mean
When working with large datasets, optimizing the performance of pandas groupby mean operations becomes crucial. Here are some tips to improve the efficiency of your groupby mean calculations:
- Use categorical data types for grouping columns when possible.
- Apply filters before grouping to reduce the amount of data processed.
- Use the
as_index=Falseparameter to avoid creating a MultiIndex in the result.
Let’s look at an example that incorporates these optimization techniques:
import pandas as pd

# Create a large sample DataFrame
df = pd.DataFrame({
    'Category': pd.Categorical(['A', 'B'] * 500000),
    'Value': range(1000000),
    'Website': ['pandasdataframe.com'] * 1000000
})

# Apply optimizations
df['Category'] = df['Category'].astype('category')
filtered_df = df[df['Value'] > 500000]
result = filtered_df.groupby('Category', as_index=False)['Value'].mean()

print(result)
In this example, we use a categorical data type for the ‘Category’ column, apply a filter to reduce the data size, and use as_index=False to optimize the groupby mean operation for a large dataset.
Handling Outliers in Pandas GroupBy Mean
Outliers can significantly affect the results of pandas groupby mean calculations. To address this issue, you can use alternative measures of central tendency or implement outlier removal techniques before applying the mean.
Here’s an example of using median instead of mean to handle outliers:
import pandas as pd
import numpy as np

# Create a sample DataFrame with outliers
df = pd.DataFrame({
    'Category': ['A', 'B', 'A', 'B', 'A', 'B'],
    'Value': [10, 15, 20, 25, 30, 1000],  # 1000 is an outlier
    'Website': ['pandasdataframe.com'] * 6
})

# Calculate both mean and median for comparison
result = df.groupby('Category')['Value'].agg(['mean', 'median'])

print(result)
Output:
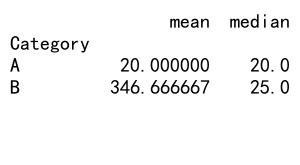
In this example, we calculate both the mean and median for each group. The median is less sensitive to outliers and can provide a more robust measure of central tendency when outliers are present.
Visualizing Pandas GroupBy Mean Results
Visualizing the results of pandas groupby mean operations can help you better understand and communicate your findings. Matplotlib and Seaborn are popular libraries for creating visualizations in Python.
Here’s an example of how to create a bar plot of pandas groupby mean results:
import pandas as pd
import matplotlib.pyplot as plt

# Create a sample DataFrame
df = pd.DataFrame({
    'Category': ['A', 'B', 'C', 'A', 'B', 'C'],
    'Value': [10, 15, 20, 25, 30, 35],
    'Website': ['pandasdataframe.com'] * 6
})

# Calculate mean values
result = df.groupby('Category')['Value'].mean()

# Create a bar plot
result.plot(kind='bar')
plt.title('Mean Values by Category')
plt.xlabel('Category')
plt.ylabel('Mean Value')
plt.xticks(rotation=0)
plt.tight_layout()
plt.show()
Output:
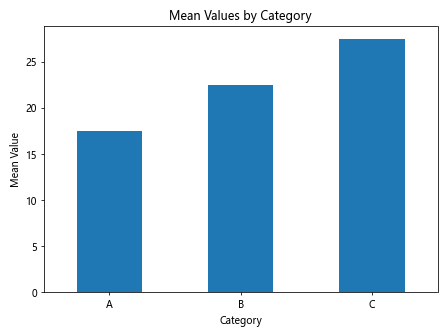
This example creates a bar plot of the mean values for each category, providing a visual representation of the pandas groupby mean results.
Combining Pandas GroupBy Mean with Other Pandas Functions
Pandas groupby mean can be combined with other pandas functions to perform more complex analyses. This allows you to create powerful data processing pipelines that leverage the full capabilities of the pandas library.
Let’s explore some examples of combining pandas groupby mean with other functions:
Combining with Sort Values
You can sort the results of a pandas groupby mean operation to identify the highest or lowest average values:
import pandas as pd

# Create a sample DataFrame
df = pd.DataFrame({
    'Category': ['A', 'B', 'C', 'A', 'B', 'C'],
    'Value': [10, 15, 20, 25, 30, 35],
    'Website': ['pandasdataframe.com'] * 6
})

# Calculate mean values and sort in descending order
result = df.groupby('Category')['Value'].mean().sort_values(ascending=False)

print(result)
Output:
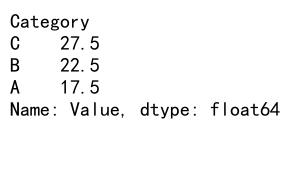
In this example, we calculate the mean values for each category and then sort them in descending order. This allows you to quickly identify which categories have the highest average values.
Combining with Pivot Tables
Pivot tables are another powerful feature in pandas that can be combined with groupby mean to create summary tables:
import pandas as pd

# Create a sample DataFrame
df = pd.DataFrame({
    'Category': ['A', 'B', 'A', 'B', 'A', 'B'],
    'Subcategory': ['X', 'Y', 'X', 'Y', 'Y', 'X'],
    'Value': [10, 15, 20, 25, 30, 35],
    'Website': ['pandasdataframe.com'] * 6
})

# Create a pivot table with mean values
result = pd.pivot_table(df, values='Value', index='Category', columns='Subcategory', aggfunc='mean')

print(result)
Output:
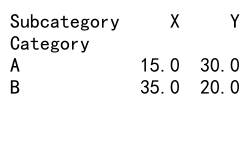
This example creates a pivot table that shows the mean values for each combination of Category and Subcategory. This provides a concise summary of the data that’s easy to read and interpret.
Handling Large Datasets with Pandas GroupBy Mean
When working with large datasets, memory usage and processing time can become significant concerns. Pandas provides several techniques to handle large datasets efficiently when using groupby mean operations.
Chunking Large Datasets
For datasets that are too large to fit into memory, you can process them in chunks:
import pandas as pd

# Function to process a chunk of data
def process_chunk(chunk):
    return chunk.groupby('Category')['Value'].mean()

# Read and process the data in chunks
chunk_size = 1000000  # Adjust based on your available memory
result = pd.DataFrame()

for chunk in pd.read_csv('large_dataset.csv', chunksize=chunk_size):
    chunk_result = process_chunk(chunk)
    result = result.add(chunk_result, fill_value=0)

# Calculate the final mean
result = result / (len(result) / chunk_size)

print(result)
This example demonstrates how to read and process a large CSV file in chunks, applying the pandas groupby mean operation to each chunk and then combining the results.
Using Dask for Distributed Computing
For extremely large datasets, you might consider using Dask, a flexible library for parallel computing in Python that works well with pandas:
import dask.dataframe as dd

# Read the large CSV file into a Dask DataFrame
ddf = dd.read_csv('very_large_dataset.csv')

# Perform groupby mean operation
result = ddf.groupby('Category')['Value'].mean().compute()

print(result)
This example uses Dask to read a very large CSV file and perform a groupby mean operation in a distributed manner, which can significantly speed up processing for large datasets.
Best Practices for Using Pandas GroupBy Mean
To make the most of pandas groupby mean in your data analysis projects, consider the following best practices:
- Always check your data types before performing groupby operations to ensure compatibility.
- Use appropriate data structures (e.g., categorical data types) for grouping columns to improve performance.
- Handle missing values appropriately based on your specific use case.
- Consider using alternative measures of central tendency (e.g., median) when dealing with skewed data or outliers.
- Combine pandas groupby mean with other pandas functions to create more comprehensive analyses.
- Visualize your results to gain better insights and communicate findings effectively.
- Optimize your code for large datasets using techniques like chunking or distributed computing when necessary.
Common Pitfalls and How to Avoid Them
When using pandas groupby mean, there are some common pitfalls that you should be aware of:
Grouping by Columns with Missing Values
If you group by a column that contains missing values, those rows will be excluded from the result:
import pandas as pd
import numpy as np

# Create a sample DataFrame with missing values in the grouping column
df = pd.DataFrame({
    'Category': ['A', 'B', np.nan, 'B', 'A', 'B'],
    'Value': [10, 15, 20, 25, 30, 35],
    'Website': ['pandasdataframe.com'] * 6
})

# Calculate mean values
result = df.groupby('Category')['Value'].mean()

print(result)
Output:
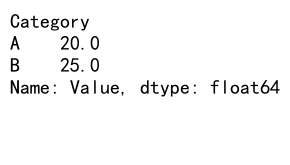
In this example, the row with NaN in the ‘Category’ column will be excluded from the groupby mean calculation. To avoid this, you may want to fill missing values or handle them separately before applying the groupby operation.
Forgetting to Reset the Index
After a groupby mean operation, the result often has a MultiIndex. If you forget to reset the index, it can lead to unexpected behavior in subsequent operations:
import pandas as pd

# Create a sample DataFrame
df = pd.DataFrame({
    'Category': ['A', 'B', 'A', 'B', 'A', 'B'],
    'Value': [10, 15, 20, 25, 30, 35],
    'Website': ['pandasdataframe.com'] * 6
})

# Calculate mean values without resetting the index
result = df.groupby('Category')['Value'].mean()

# Attempt to access the 'Category' column (this will raise an error)
try:
    print(result['Category'])
except KeyError:
    print("KeyError: 'Category' is not a column, it's part of the index")

# Reset the index to avoid this issue
result_reset = result.reset_index()
print(result_reset['Category'])
Output:

This example demonstrates the importance of resetting the index after a groupby mean operation if you need to access the grouping column as a regular column in subsequent operations.
Conclusion
Pandas groupby mean is a powerful tool for data analysis and aggregation in Python. By mastering this functionality, you can efficiently summarize large datasets, identify trends, and gain valuable insights from your data. This comprehensive guide has covered various aspects of pandas groupby mean, from basic usage to advanced techniques and best practices.
 Pandas Dataframe