Mastering Pandas GroupBy with Multiple Columns
Pandas groupby multiple columns is a powerful technique for data analysis and manipulation in Python. This article will dive deep into the intricacies of using pandas groupby with multiple columns, providing detailed explanations, numerous examples, and practical use cases. By the end of this guide, you’ll have a thorough understanding of how to leverage pandas groupby multiple columns to extract valuable insights from your data.
Understanding Pandas GroupBy with Multiple Columns
Pandas groupby multiple columns is a method that allows you to group data based on one or more columns in a DataFrame. This operation is particularly useful when you want to perform aggregate operations or analyze data across multiple dimensions. By using pandas groupby multiple columns, you can efficiently summarize, transform, and analyze complex datasets.
Let’s start with a simple example to illustrate the concept of pandas groupby multiple columns:
import pandas as pd

# Create a sample DataFrame
df = pd.DataFrame({
    'Name': ['John', 'Emma', 'John', 'Emma', 'John'],
    'City': ['New York', 'London', 'New York', 'Paris', 'London'],
    'Sales': [100, 200, 150, 300, 250]
})

# Group by multiple columns (Name and City) and calculate the sum of Sales
grouped = df.groupby(['Name', 'City'])['Sales'].sum()

print(grouped)
Output:
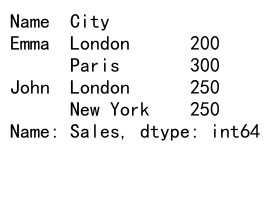
In this example, we use pandas groupby multiple columns to group the data by both ‘Name’ and ‘City’, then calculate the sum of ‘Sales’ for each group. This demonstrates the basic usage of pandas groupby multiple columns.
Benefits of Using Pandas GroupBy with Multiple Columns
Pandas groupby multiple columns offers several advantages for data analysis:
- Multidimensional analysis: By grouping data on multiple columns, you can analyze patterns and trends across various dimensions simultaneously.
-
Efficient aggregation: Pandas groupby multiple columns allows you to perform complex aggregations on large datasets quickly and efficiently.
-
Flexible data manipulation: You can easily reshape and transform your data using pandas groupby multiple columns, making it suitable for various analytical tasks.
-
Insightful summaries: Grouping by multiple columns helps in creating meaningful summaries that capture the essence of your data across different categories.
Common Aggregation Functions with Pandas GroupBy Multiple Columns
When using pandas groupby multiple columns, you can apply various aggregation functions to summarize your data. Here are some commonly used aggregation functions:
Sum
import pandas as pd

df = pd.DataFrame({
    'Category': ['A', 'B', 'A', 'B', 'A'],
    'Subcategory': ['X', 'Y', 'X', 'Y', 'Z'],
    'Value': [10, 20, 15, 25, 30]
})

# Sum values grouped by Category and Subcategory
result = df.groupby(['Category', 'Subcategory'])['Value'].sum()

print(result)
Output:
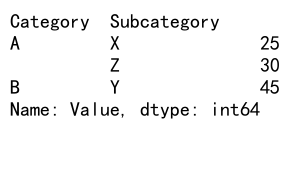
This example demonstrates how to use the sum() function with pandas groupby multiple columns to calculate the total value for each combination of Category and Subcategory.
Mean
import pandas as pd

df = pd.DataFrame({
    'Department': ['Sales', 'HR', 'Sales', 'HR', 'Sales'],
    'Team': ['Alpha', 'Beta', 'Alpha', 'Beta', 'Gamma'],
    'Score': [85, 92, 78, 88, 95]
})

# Calculate mean score grouped by Department and Team
result = df.groupby(['Department', 'Team'])['Score'].mean()

print(result)
Output:
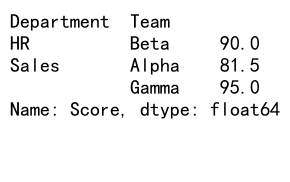
Here, we use the mean() function with pandas groupby multiple columns to compute the average score for each combination of Department and Team.
Count
import pandas as pd

df = pd.DataFrame({
    'Product': ['A', 'B', 'A', 'B', 'A'],
    'Region': ['East', 'West', 'East', 'West', 'North'],
    'Sales': [100, 200, 150, 250, 300]
})

# Count occurrences grouped by Product and Region
result = df.groupby(['Product', 'Region']).size()

print(result)
Output:
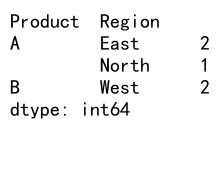
This example shows how to use the size() function with pandas groupby multiple columns to count the number of occurrences for each combination of Product and Region.
Advanced Techniques with Pandas GroupBy Multiple Columns
Now that we’ve covered the basics, let’s explore some advanced techniques using pandas groupby multiple columns.
Multiple Aggregations
You can apply multiple aggregation functions simultaneously using pandas groupby multiple columns:
import pandas as pd

df = pd.DataFrame({
    'Category': ['A', 'B', 'A', 'B', 'A'],
    'Subcategory': ['X', 'Y', 'X', 'Y', 'Z'],
    'Value': [10, 20, 15, 25, 30],
    'Quantity': [5, 8, 6, 10, 7]
})

# Apply multiple aggregations
result = df.groupby(['Category', 'Subcategory']).agg({
    'Value': ['sum', 'mean'],
    'Quantity': ['max', 'min']
})

print(result)
Output:
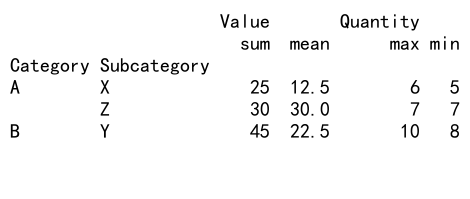
This example demonstrates how to apply multiple aggregation functions (sum, mean, max, min) to different columns using pandas groupby multiple columns.
Custom Aggregation Functions
You can define custom aggregation functions to use with pandas groupby multiple columns:
import pandas as pd
import numpy as np

df = pd.DataFrame({
    'Name': ['John', 'Emma', 'John', 'Emma', 'John'],
    'City': ['New York', 'London', 'New York', 'Paris', 'London'],
    'Sales': [100, 200, 150, 300, 250]
})

# Custom aggregation function
def range_diff(x):
    return x.max() - x.min()

# Apply custom aggregation
result = df.groupby(['Name', 'City'])['Sales'].agg([np.mean, range_diff])

print(result)
In this example, we define a custom function range_diff to calculate the difference between the maximum and minimum values, and apply it along with the mean function using pandas groupby multiple columns.
Grouping with Date Ranges
Pandas groupby multiple columns can be particularly useful when working with time series data:
import pandas as pd

df = pd.DataFrame({
    'Date': pd.date_range(start='2023-01-01', end='2023-12-31', freq='D'),
    'Category': ['A', 'B', 'A', 'B'] * 91 + ['A'],
    'Sales': np.random.randint(100, 1000, 365)
})

# Group by month and category
result = df.groupby([df['Date'].dt.to_period('M'), 'Category'])['Sales'].sum()

print(result)
This example shows how to group time series data by month and category using pandas groupby multiple columns, allowing for analysis of sales trends over time.
Handling Missing Values with Pandas GroupBy Multiple Columns
When working with real-world data, you may encounter missing values. Here’s how to handle them using pandas groupby multiple columns:
import pandas as pd
import numpy as np

df = pd.DataFrame({
    'Category': ['A', 'B', 'A', 'B', 'A'],
    'Subcategory': ['X', 'Y', 'X', np.nan, 'Z'],
    'Value': [10, 20, 15, 25, 30]
})

# Group by multiple columns, handling missing values
result = df.groupby(['Category', 'Subcategory'], dropna=False)['Value'].sum()

print(result)
Output:
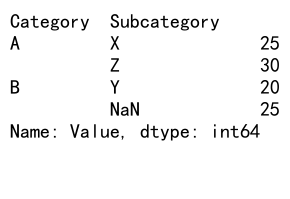
In this example, we use the dropna=False parameter to include groups with missing values in the result when using pandas groupby multiple columns.
Reshaping Data with Pandas GroupBy Multiple Columns
Pandas groupby multiple columns can be used to reshape your data for further analysis or visualization:
import pandas as pd

df = pd.DataFrame({
    'Date': pd.date_range(start='2023-01-01', end='2023-12-31', freq='D'),
    'Category': ['A', 'B', 'C'] * 122,
    'Sales': np.random.randint(100, 1000, 366)
})

# Reshape data using groupby and unstack
result = df.groupby([df['Date'].dt.to_period('M'), 'Category'])['Sales'].sum().unstack()

print(result)
This example demonstrates how to use pandas groupby multiple columns to create a pivot table-like structure, with months as rows and categories as columns.
Filtering Groups with Pandas GroupBy Multiple Columns
You can filter groups based on certain conditions using pandas groupby multiple columns:
import pandas as pd

df = pd.DataFrame({
    'Name': ['John', 'Emma', 'John', 'Emma', 'John'],
    'City': ['New York', 'London', 'New York', 'Paris', 'London'],
    'Sales': [100, 200, 150, 300, 250]
})

# Filter groups with total sales greater than 300
result = df.groupby(['Name', 'City']).filter(lambda x: x['Sales'].sum() > 300)

print(result)
Output:
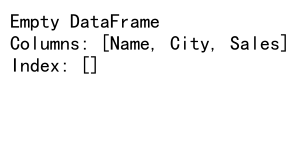
This example shows how to filter groups based on a condition (total sales greater than 300) using pandas groupby multiple columns.
Applying Functions to Groups with Pandas GroupBy Multiple Columns
You can apply custom functions to each group using pandas groupby multiple columns:
import pandas as pd

df = pd.DataFrame({
    'Category': ['A', 'B', 'A', 'B', 'A'],
    'Subcategory': ['X', 'Y', 'X', 'Y', 'Z'],
    'Value': [10, 20, 15, 25, 30]
})

# Apply a custom function to each group
def normalize(group):
    return (group - group.min()) / (group.max() - group.min())

result = df.groupby(['Category', 'Subcategory'])['Value'].transform(normalize)

print(result)
Output:
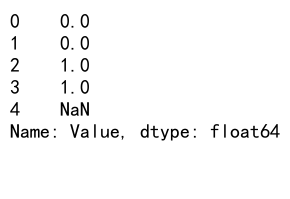
This example demonstrates how to apply a custom normalization function to each group using pandas groupby multiple columns.
Combining GroupBy Results with Pandas GroupBy Multiple Columns
You can combine the results of multiple groupby operations using pandas groupby multiple columns:
import pandas as pd

df = pd.DataFrame({
    'Category': ['A', 'B', 'A', 'B', 'A'],
    'Subcategory': ['X', 'Y', 'X', 'Y', 'Z'],
    'Value': [10, 20, 15, 25, 30]
})

# Combine results of different groupby operations
result1 = df.groupby('Category')['Value'].sum()
result2 = df.groupby('Subcategory')['Value'].mean()

combined_result = pd.concat([result1, result2], axis=1, keys=['Category_Sum', 'Subcategory_Mean'])

print(combined_result)
Output:
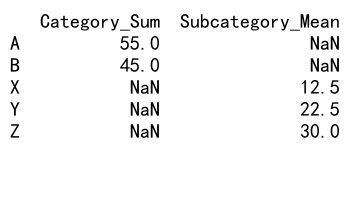
This example shows how to combine the results of two different groupby operations using pandas groupby multiple columns and concatenate them into a single DataFrame.
Performance Considerations for Pandas GroupBy Multiple Columns
When working with large datasets, performance can be a concern. Here are some tips to optimize your pandas groupby multiple columns operations:
- Use categorical data types for grouping columns when possible.
- Consider using the
as_index=Falseparameter to avoid creating a MultiIndex. - Use
agg()instead of multiple separate aggregation calls. - For very large datasets, consider using libraries like Dask or Vaex that support out-of-core processing.
Real-world Applications of Pandas GroupBy Multiple Columns
Pandas groupby multiple columns has numerous real-world applications across various industries:
- Financial analysis: Grouping transactions by date, account, and category to analyze spending patterns.
- Sales reporting: Aggregating sales data by product, region, and time period to identify top-performing segments.
- Customer segmentation: Grouping customer data by demographics and behavior to create targeted marketing campaigns.
- Scientific research: Analyzing experimental results grouped by multiple factors to identify significant relationships.
Common Pitfalls and How to Avoid Them
When using pandas groupby multiple columns, be aware of these common pitfalls:
- Forgetting to reset the index after groupby operations.
- Mishandling missing values in grouping columns.
- Incorrectly specifying column names or aggregation functions.
- Not considering the memory impact of groupby operations on large datasets.
To avoid these issues, always double-check your column names, use appropriate data types, and consider the size of your dataset when performing pandas groupby multiple columns operations.
Conclusion
Pandas groupby multiple columns is a powerful tool for data analysis and manipulation in Python. By mastering this technique, you can efficiently analyze complex datasets, uncover hidden patterns, and extract valuable insights. From basic aggregations to advanced reshaping and filtering, pandas groupby multiple columns offers a wide range of capabilities to support your data analysis needs.
 Pandas Dataframe