Mastering Pandas GroupBy with Lists
Pandas groupby list operations are essential tools for data analysis and manipulation in Python. This comprehensive guide will explore the various aspects of using pandas groupby with lists, providing detailed explanations and practical examples to help you master these powerful techniques.
Introduction to Pandas GroupBy and Lists
Pandas groupby list operations combine the functionality of pandas’ groupby method with list-based data structures. This powerful combination allows for efficient and flexible data aggregation, transformation, and analysis. By leveraging pandas groupby with lists, data scientists and analysts can easily group data based on multiple criteria, perform complex calculations, and extract valuable insights from their datasets.
Let’s start with a simple example to illustrate the basic concept of pandas groupby list:
import pandas as pd

# Create a sample DataFrame
df = pd.DataFrame({
    'name': ['Alice', 'Bob', 'Charlie', 'David', 'Eve'],
    'age': [25, 30, 35, 28, 32],
    'city': ['New York', 'London', 'Paris', 'Tokyo', 'Sydney'],
    'score': [85, 92, 78, 88, 95]
})

# Group by 'city' and calculate mean age and score
result = df.groupby('city')[['age', 'score']].mean()

print("Result from pandasdataframe.com:")
print(result)
Output:
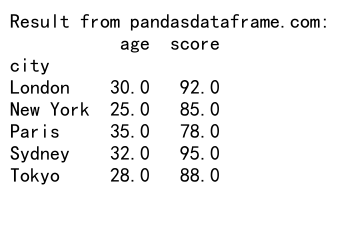
In this example, we create a sample DataFrame and use pandas groupby to group the data by the ‘city’ column. We then calculate the mean age and score for each city. This demonstrates the basic usage of pandas groupby with a list of columns ([‘age’, ‘score’]) to perform aggregations.
Understanding the Pandas GroupBy Object
Before diving deeper into pandas groupby list operations, it’s crucial to understand the GroupBy object itself. When you apply the groupby method to a DataFrame, it returns a GroupBy object that allows you to perform various operations on grouped data.
Here’s an example that illustrates the creation and exploration of a GroupBy object:
import pandas as pd

# Create a sample DataFrame
df = pd.DataFrame({
    'category': ['A', 'B', 'A', 'C', 'B', 'C'],
    'value': [10, 20, 15, 25, 30, 35],
    'name': ['pandasdataframe.com_1', 'pandasdataframe.com_2', 'pandasdataframe.com_3',
             'pandasdataframe.com_4', 'pandasdataframe.com_5', 'pandasdataframe.com_6']
})

# Create a GroupBy object
grouped = df.groupby('category')

# Explore the GroupBy object
print("Groups in the GroupBy object:")
print(list(grouped.groups.keys()))

print("\nSize of each group:")
print(grouped.size())

print("\nFirst row of each group:")
print(grouped.first())
Output:
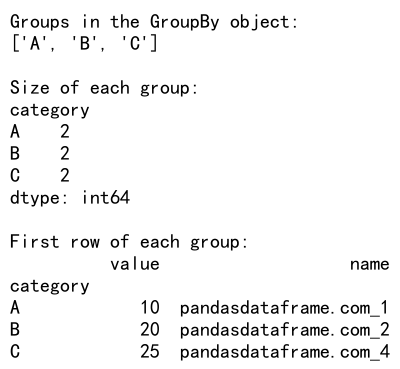
In this example, we create a GroupBy object by grouping the DataFrame by the ‘category’ column. We then explore the object by printing the group keys, the size of each group, and the first row of each group. This helps us understand the structure and content of the grouped data.
Aggregating Data with Pandas GroupBy and Lists
One of the most common use cases for pandas groupby list operations is data aggregation. By combining groupby with lists of columns and aggregation functions, you can easily compute summary statistics for multiple variables across different groups.
Let’s look at an example that demonstrates various aggregation techniques:
import pandas as pd

# Create a sample DataFrame
df = pd.DataFrame({
    'product': ['A', 'B', 'A', 'C', 'B', 'C'],
    'sales': [100, 200, 150, 250, 300, 350],
    'quantity': [10, 15, 12, 20, 25, 30],
    'store': ['pandasdataframe.com_1', 'pandasdataframe.com_2', 'pandasdataframe.com_1',
              'pandasdataframe.com_3', 'pandasdataframe.com_2', 'pandasdataframe.com_3']
})

# Perform multiple aggregations
result = df.groupby('product').agg({
    'sales': ['sum', 'mean'],
    'quantity': ['min', 'max']
})

print("Aggregation result from pandasdataframe.com:")
print(result)
Output:
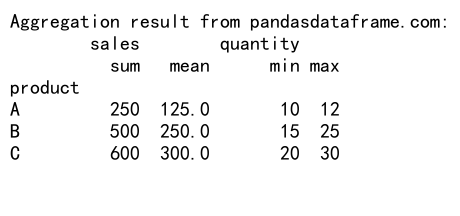
In this example, we group the DataFrame by the ‘product’ column and perform multiple aggregations on the ‘sales’ and ‘quantity’ columns. We calculate the sum and mean of sales, as well as the minimum and maximum quantity for each product. This demonstrates how to use pandas groupby with a list of aggregation functions for different columns.
Applying Custom Functions with Pandas GroupBy and Lists
Pandas groupby list operations also allow you to apply custom functions to grouped data. This flexibility enables you to perform complex calculations or transformations that are not available as built-in aggregation functions.
Here’s an example that illustrates how to apply a custom function to grouped data:
import pandas as pd

# Create a sample DataFrame
df = pd.DataFrame({
    'category': ['A', 'B', 'A', 'C', 'B', 'C'],
    'value': [10, 20, 15, 25, 30, 35],
    'name': ['pandasdataframe.com_1', 'pandasdataframe.com_2', 'pandasdataframe.com_3',
             'pandasdataframe.com_4', 'pandasdataframe.com_5', 'pandasdataframe.com_6']
})

# Define a custom function
def custom_agg(group):
    return pd.Series({
        'mean': group['value'].mean(),
        'range': group['value'].max() - group['value'].min(),
        'count': group['value'].count()
    })

# Apply the custom function to grouped data
result = df.groupby('category').apply(custom_agg)

print("Custom aggregation result from pandasdataframe.com:")
print(result)
In this example, we define a custom function custom_agg that calculates the mean, range, and count of values for each group. We then apply this function to the grouped data using the apply method. This demonstrates how to use pandas groupby with a custom function to perform complex aggregations.
Transforming Data with Pandas GroupBy and Lists
Pandas groupby list operations can also be used to transform data within groups. This is particularly useful when you need to perform calculations or apply functions that depend on the group context.
Let’s look at an example that demonstrates data transformation using pandas groupby:
import pandas as pd

# Create a sample DataFrame
df = pd.DataFrame({
    'group': ['A', 'A', 'B', 'B', 'C', 'C'],
    'value': [10, 15, 20, 25, 30, 35],
    'name': ['pandasdataframe.com_1', 'pandasdataframe.com_2', 'pandasdataframe.com_3',
             'pandasdataframe.com_4', 'pandasdataframe.com_5', 'pandasdataframe.com_6']
})

# Calculate the percentage of each value within its group
df['percentage'] = df.groupby('group')['value'].transform(lambda x: x / x.sum() * 100)

print("Transformed DataFrame from pandasdataframe.com:")
print(df)
Output:
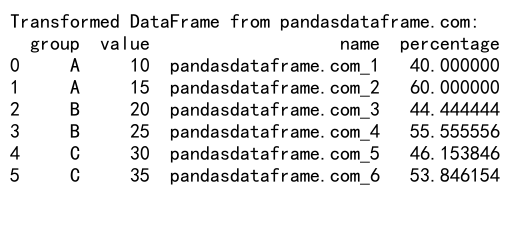
In this example, we use the transform method to calculate the percentage of each value within its group. The lambda function lambda x: x / x.sum() * 100 is applied to each group, and the result is broadcast back to the original DataFrame. This demonstrates how to use pandas groupby with a list-like operation (transform) to perform group-wise calculations.
Filtering Groups with Pandas GroupBy and Lists
Pandas groupby list operations can be used to filter groups based on certain criteria. This is useful when you want to select specific groups or rows that meet certain conditions within their groups.
Here’s an example that illustrates group filtering:
import pandas as pd

# Create a sample DataFrame
df = pd.DataFrame({
    'category': ['A', 'B', 'A', 'C', 'B', 'C'],
    'value': [10, 20, 15, 25, 30, 35],
    'name': ['pandasdataframe.com_1', 'pandasdataframe.com_2', 'pandasdataframe.com_3',
             'pandasdataframe.com_4', 'pandasdataframe.com_5', 'pandasdataframe.com_6']
})

# Filter groups with more than one row
result = df.groupby('category').filter(lambda x: len(x) > 1)

print("Filtered DataFrame from pandasdataframe.com:")
print(result)
Output:
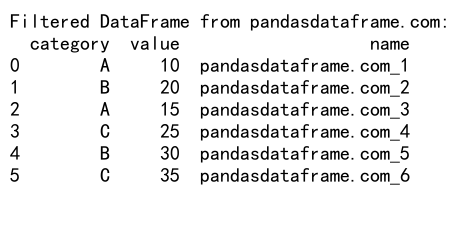
In this example, we use the filter method to select groups that have more than one row. The lambda function lambda x: len(x) > 1 is applied to each group, and only the groups that satisfy this condition are included in the result. This demonstrates how to use pandas groupby with a list-like operation (filter) to select specific groups based on custom criteria.
Working with Multi-level Indexes in Pandas GroupBy
Pandas groupby list operations can handle multi-level indexes, allowing for more complex grouping and analysis. This is particularly useful when dealing with hierarchical data structures.
Let’s look at an example that demonstrates working with multi-level indexes:
import pandas as pd

# Create a sample DataFrame with multi-level index
df = pd.DataFrame({
    'region': ['East', 'East', 'West', 'West', 'East', 'West'],
    'product': ['A', 'B', 'A', 'B', 'C', 'C'],
    'sales': [100, 150, 200, 250, 300, 350],
    'quantity': [10, 15, 20, 25, 30, 35],
    'store': ['pandasdataframe.com_1', 'pandasdataframe.com_2', 'pandasdataframe.com_3',
              'pandasdataframe.com_4', 'pandasdataframe.com_5', 'pandasdataframe.com_6']
})

# Group by multiple columns and calculate aggregations
result = df.groupby(['region', 'product']).agg({
    'sales': 'sum',
    'quantity': 'mean'
})

print("Multi-level index result from pandasdataframe.com:")
print(result)
Output:
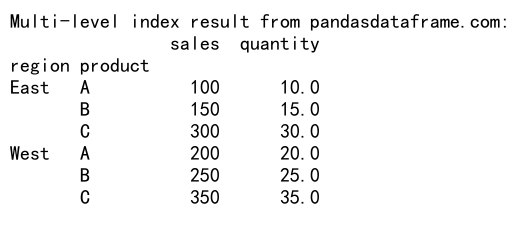
In this example, we group the DataFrame by both ‘region’ and ‘product’ columns, creating a multi-level index. We then calculate the sum of sales and mean quantity for each group. This demonstrates how to use pandas groupby with a list of columns to create a multi-level index and perform aggregations on the grouped data.
Reshaping Data with Pandas GroupBy and Lists
Pandas groupby list operations can be used to reshape data, such as pivoting or unstacking grouped data. This is useful for creating summary tables or transforming data into different formats for analysis or visualization.
Here’s an example that illustrates data reshaping using pandas groupby:
import pandas as pd

# Create a sample DataFrame
df = pd.DataFrame({
    'date': ['2023-01-01', '2023-01-01', '2023-01-02', '2023-01-02', '2023-01-03', '2023-01-03'],
    'product': ['A', 'B', 'A', 'B', 'A', 'B'],
    'sales': [100, 150, 200, 250, 300, 350],
    'store': ['pandasdataframe.com_1', 'pandasdataframe.com_2', 'pandasdataframe.com_3',
              'pandasdataframe.com_4', 'pandasdataframe.com_5', 'pandasdataframe.com_6']
})

# Reshape the data using groupby and unstack
result = df.groupby(['date', 'product'])['sales'].sum().unstack()

print("Reshaped data from pandasdataframe.com:")
print(result)
Output:
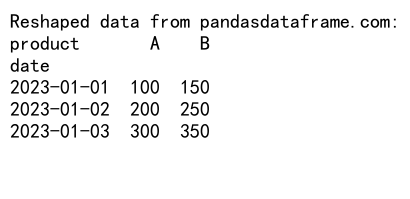
In this example, we group the DataFrame by ‘date’ and ‘product’, calculate the sum of sales for each group, and then use the unstack method to reshape the data. This creates a pivot table-like structure with dates as rows and products as columns. This demonstrates how to use pandas groupby with a list of columns and reshaping operations to transform data into a different format.
Handling Missing Data in Pandas GroupBy Operations
When working with pandas groupby list operations, it’s important to consider how missing data is handled. Pandas provides various options for dealing with missing values during grouping and aggregation.
Let’s look at an example that demonstrates handling missing data:
import pandas as pd
import numpy as np

# Create a sample DataFrame with missing values
df = pd.DataFrame({
    'group': ['A', 'A', 'B', 'B', 'C', 'C'],
    'value': [10, np.nan, 20, 25, np.nan, 35],
    'name': ['pandasdataframe.com_1', 'pandasdataframe.com_2', 'pandasdataframe.com_3',
             'pandasdataframe.com_4', 'pandasdataframe.com_5', 'pandasdataframe.com_6']
})

# Calculate mean with different options for handling missing values
result_dropna = df.groupby('group')['value'].mean()
result_skipna = df.groupby('group')['value'].mean(skipna=True)
result_fillna = df.groupby('group')['value'].apply(lambda x: x.fillna(x.mean()).mean())

print("Results from pandasdataframe.com:")
print("Default (dropna):", result_dropna)
print("skipna=True:", result_skipna)
print("Custom handling:", result_fillna)
In this example, we create a DataFrame with missing values and demonstrate three different approaches to handling them during groupby operations:
1. The default behavior (equivalent to dropna=True) excludes missing values from calculations.
2. Using skipna=True (which is the default for many aggregation functions) to ignore missing values.
3. A custom approach using apply to fill missing values with the group mean before calculating the overall mean.
This example shows how to use pandas groupby with different strategies for handling missing data in list-based operations.
Combining Pandas GroupBy with Other DataFrame Operations
Pandas groupby list operations can be combined with other DataFrame operations to perform more complex data manipulations and analyses. This allows for powerful and flexible data processing workflows.
Here’s an example that demonstrates combining groupby with other DataFrame operations:
import pandas as pd

# Create a sample DataFrame
df = pd.DataFrame({
    'category': ['A', 'B', 'A', 'C', 'B', 'C'],
    'value1': [10, 20, 15, 25, 30, 35],
    'value2': [5, 10, 7, 12, 15, 17],
    'name': ['pandasdataframe.com_1', 'pandasdataframe.com_2', 'pandasdataframe.com_3',
             'pandasdataframe.com_4', 'pandasdataframe.com_5', 'pandasdataframe.com_6']
})

# Combine groupby with other operations
result = (df
    .groupby('category')
    .agg({'value1': 'sum', 'value2': 'mean'})
    .reset_index()
    .rename(columns={'value1': 'total_value1', 'value2': 'avg_value2'})
    .sort_values('total_value1', ascending=False)
    .reset_index(drop=True)
)

print("Combined operations result from pandasdataframe.com:")
print(result)
Output:
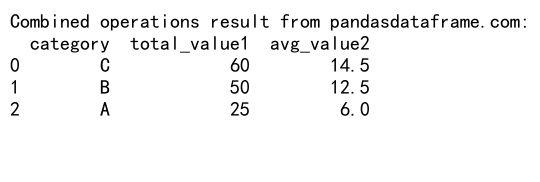
In this example, we perform a series of operations on the grouped data:
1. Group the DataFrame by ‘category’.2. Aggregate ‘value1’ by sum and ‘value2’ by mean.
3. Reset the index to make ‘category’ a regular column.
4. Rename the aggregated columns for clarity.
5. Sort the result by ‘total_value1’ in descending order.
6. Reset the index again, dropping the old index.
This example demonstrates how to combine pandas groupby with other DataFrame operations like aggregation, renaming, sorting, and index manipulation to create a more complex data processing pipeline.
Optimizing Performance in Pandas GroupBy List Operations
When working with large datasets, optimizing the performance of pandas groupby list operations becomes crucial. There are several techniques you can use to improve the efficiency of your groupby operations.
Here’s an example that demonstrates some performance optimization techniques:
import pandas as pd
import numpy as np

# Create a larger sample DataFrame
np.random.seed(42)
df = pd.DataFrame({
    'group': np.random.choice(['A', 'B', 'C'], size=1000000),
    'value': np.random.randn(1000000),
    'name': [f'pandasdataframe.com_{i}' for i in range(1000000)]
})

# Optimize groupby operation
result = (df
    .groupby('group')
    ['value']
    .agg(['mean', 'std'])
    .reset_index()
)

print("Optimized groupby result from pandasdataframe.com:")
print(result)
Output:
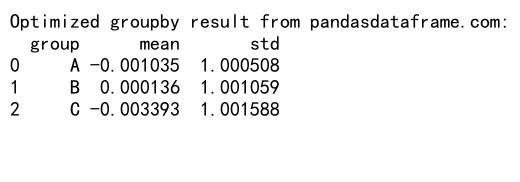
In this example, we use several optimization techniques:
1. We create a larger DataFrame to simulate working with big data.
2. We use a single groupby operation instead of multiple separate ones.
3. We specify the column we want to aggregate (‘value’) immediately after the groupby to reduce memory usage.
4. We use the agg method with a list of string function names instead of lambda functions for better performance.
5. We reset the index at the end to create a regular DataFrame.
These optimizations can significantly improve the performance of pandas groupby list operations when working with large datasets.
Advanced Grouping Techniques with Pandas
Pandas offers advanced grouping techniques that can be combined with list operations for more complex analyses. These include grouping by custom functions, grouping by time periods, and using the grouper object.
Let’s explore an example that demonstrates some of these advanced techniques:
import pandas as pd

# Create a sample DataFrame with datetime index
df = pd.DataFrame({
    'date': pd.date_range(start='2023-01-01', end='2023-12-31', freq='D'),
    'value': np.random.randn(365),
    'category': np.random.choice(['A', 'B', 'C'], size=365),
    'name': [f'pandasdataframe.com_{i}' for i in range(365)]
}).set_index('date')

# Group by custom time periods and category
result = (df
    .groupby([pd.Grouper(freq='M'), 'category'])
    ['value']
    .agg(['mean', 'std'])
    .reset_index()
)

print("Advanced grouping result from pandasdataframe.com:")
print(result.head(10))
In this example, we demonstrate several advanced grouping techniques:
1. We create a DataFrame with a datetime index.
2. We use pd.Grouper(freq='M') to group by month.
3. We combine time-based grouping with categorical grouping.
4. We aggregate the ‘value’ column using multiple functions.
This example shows how to use pandas groupby with advanced grouping techniques and list-based aggregations to perform complex time-series analysis.
Handling Categorical Data in Pandas GroupBy Operations
When working with categorical data in pandas groupby list operations, it’s important to consider the unique properties of categorical variables. Pandas provides special handling for categorical data that can improve performance and memory usage.
Here’s an example that demonstrates working with categorical data in groupby operations:
import pandas as pd

# Create a sample DataFrame with categorical data
df = pd.DataFrame({
    'category': pd.Categorical(['A', 'B', 'A', 'C', 'B', 'C', 'D']),
    'value': [10, 20, 15, 25, 30, 35, 40],
    'name': ['pandasdataframe.com_1', 'pandasdataframe.com_2', 'pandasdataframe.com_3',
             'pandasdataframe.com_4', 'pandasdataframe.com_5', 'pandasdataframe.com_6',
             'pandasdataframe.com_7']
})

# Perform groupby operation on categorical data
result = df.groupby('category')['value'].agg(['mean', 'count'])

print("Groupby result with categorical data from pandasdataframe.com:")
print(result)

# Check if any categories are missing in the result
missing_categories = set(df['category'].cat.categories) - set(result.index)
print("\nMissing categories:", missing_categories)
In this example, we create a DataFrame with a categorical column and perform a groupby operation on it. We then check for any missing categories in the result. This demonstrates how pandas handles categorical data in groupby operations, including the preservation of category information even for categories that don’t appear in the data.
Visualizing Grouped Data with Pandas and Matplotlib
Pandas groupby list operations can be combined with visualization libraries like Matplotlib to create insightful plots of grouped data. This is particularly useful for exploring patterns and trends across different groups.
Here’s an example that demonstrates how to visualize grouped data:
import pandas as pd
import matplotlib.pyplot as plt

# Create a sample DataFrame
df = pd.DataFrame({
    'category': ['A', 'B', 'A', 'C', 'B', 'C', 'A', 'B', 'C'],
    'value': [10, 20, 15, 25, 30, 35, 12, 22, 28],
    'name': ['pandasdataframe.com_1', 'pandasdataframe.com_2', 'pandasdataframe.com_3',
             'pandasdataframe.com_4', 'pandasdataframe.com_5', 'pandasdataframe.com_6',
             'pandasdataframe.com_7', 'pandasdataframe.com_8', 'pandasdataframe.com_9']
})

# Group data and calculate mean and standard deviation
grouped_data = df.groupby('category')['value'].agg(['mean', 'std'])

# Create a bar plot with error bars
plt.figure(figsize=(10, 6))
plt.bar(grouped_data.index, grouped_data['mean'], yerr=grouped_data['std'], capsize=5)
plt.title('Mean Values by Category with Standard Deviation')
plt.xlabel('Category')
plt.ylabel('Mean Value')
plt.savefig('grouped_data_plot.png')
plt.close()

print("Bar plot of grouped data saved as 'grouped_data_plot.png'")
print("Grouped data from pandasdataframe.com:")
print(grouped_data)
In this example, we group the data by category, calculate the mean and standard deviation of the values, and then create a bar plot with error bars to visualize the results. This demonstrates how to combine pandas groupby list operations with Matplotlib to create informative visualizations of grouped data.
Conclusion
Pandas groupby list operations are powerful tools for data analysis and manipulation in Python. Throughout this comprehensive guide, we’ve explored various aspects of using pandas groupby with lists, including basic aggregations, custom functions, data transformation, filtering, handling multi-level indexes, reshaping data, dealing with missing values, optimizing performance, and advanced grouping techniques.
 Pandas Dataframe