Mastering Pandas GroupBy Sum
Pandas groupby sum is a powerful technique for aggregating and analyzing data in Python. This comprehensive guide will explore the ins and outs of using pandas groupby sum to transform and summarize your data effectively. We’ll cover everything from basic usage to advanced techniques, providing clear examples and explanations along the way.
Introduction to Pandas GroupBy Sum
Pandas groupby sum is a combination of two essential operations in data analysis: grouping data and summing values within those groups. This technique allows you to aggregate data based on specific criteria, making it easier to extract meaningful insights from large datasets.
Let’s start with a simple example to illustrate the basic concept of pandas groupby sum:
import pandas as pd

# Create a sample DataFrame
df = pd.DataFrame({
    'Category': ['A', 'B', 'A', 'B', 'A'],
    'Value': [10, 20, 15, 25, 30],
    'Website': ['pandasdataframe.com'] * 5
})

# Perform groupby sum
result = df.groupby('Category')['Value'].sum()

print(result)
Output:
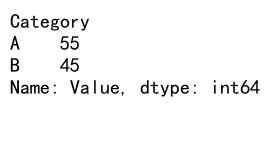
In this example, we create a DataFrame with three columns: ‘Category’, ‘Value’, and ‘Website’. We then use pandas groupby sum to calculate the sum of ‘Value’ for each unique ‘Category’. The result is a Series containing the sum of ‘Value’ for categories ‘A’ and ‘B’.
Understanding the Groupby Operation
Before diving deeper into pandas groupby sum, it’s essential to understand the groupby operation itself. The groupby function in pandas allows you to split your data into groups based on one or more columns. This operation creates a GroupBy object, which you can then apply various aggregation functions to, including sum.
Here’s an example that demonstrates the groupby operation without applying any aggregation:
import pandas as pd

# Create a sample DataFrame
df = pd.DataFrame({
    'Name': ['Alice', 'Bob', 'Charlie', 'Alice', 'Bob'],
    'Age': [25, 30, 35, 25, 30],
    'Score': [80, 85, 90, 75, 88],
    'Website': ['pandasdataframe.com'] * 5
})

# Perform groupby without aggregation
grouped = df.groupby('Name')

# Iterate through the groups
for name, group in grouped:
    print(f"Group: {name}")
    print(group)
    print()
Output:

This example creates a GroupBy object based on the ‘Name’ column. We then iterate through the groups to see how the data is split. Each group contains all rows with the same ‘Name’ value.
Basic Pandas GroupBy Sum
Now that we understand the groupby operation, let’s explore the basic usage of pandas groupby sum. The sum function is one of the most commonly used aggregation methods when working with grouped data.
Here’s an example that demonstrates a basic pandas groupby sum operation:
import pandas as pd

# Create a sample DataFrame
df = pd.DataFrame({
    'Category': ['A', 'B', 'A', 'B', 'A', 'C'],
    'Value1': [10, 20, 15, 25, 30, 35],
    'Value2': [5, 10, 7, 12, 15, 18],
    'Website': ['pandasdataframe.com'] * 6
})

# Perform groupby sum on a single column
result = df.groupby('Category')['Value1'].sum()

print(result)
Output:
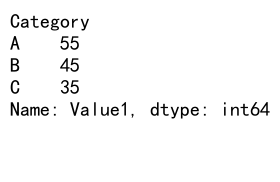
In this example, we group the DataFrame by the ‘Category’ column and sum the ‘Value1’ column for each group. The result is a Series containing the sum of ‘Value1’ for each unique category.
Multiple Column Aggregation
Pandas groupby sum is not limited to a single column. You can aggregate multiple columns simultaneously, which is particularly useful when working with complex datasets.
Here’s an example that demonstrates how to perform pandas groupby sum on multiple columns:
import pandas as pd

# Create a sample DataFrame
df = pd.DataFrame({
    'Category': ['A', 'B', 'A', 'B', 'A', 'C'],
    'Value1': [10, 20, 15, 25, 30, 35],
    'Value2': [5, 10, 7, 12, 15, 18],
    'Website': ['pandasdataframe.com'] * 6
})

# Perform groupby sum on multiple columns
result = df.groupby('Category')[['Value1', 'Value2']].sum()

print(result)
Output:
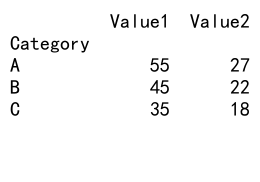
In this example, we group the DataFrame by the ‘Category’ column and sum both ‘Value1’ and ‘Value2’ columns for each group. The result is a DataFrame containing the sum of both columns for each unique category.
Grouping by Multiple Columns
Pandas groupby sum allows you to group data by multiple columns, enabling more granular aggregations. This is particularly useful when you want to analyze data across multiple dimensions.
Here’s an example that demonstrates grouping by multiple columns:
import pandas as pd

# Create a sample DataFrame
df = pd.DataFrame({
    'Category': ['A', 'B', 'A', 'B', 'A', 'C'],
    'Subcategory': ['X', 'Y', 'X', 'Z', 'Y', 'X'],
    'Value': [10, 20, 15, 25, 30, 35],
    'Website': ['pandasdataframe.com'] * 6
})

# Perform groupby sum on multiple grouping columns
result = df.groupby(['Category', 'Subcategory'])['Value'].sum()

print(result)
Output:
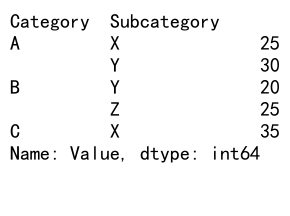
In this example, we group the DataFrame by both ‘Category’ and ‘Subcategory’ columns, then sum the ‘Value’ column for each unique combination of categories and subcategories. The result is a Series with a multi-level index representing the grouped columns.
Handling Missing Values
When performing pandas groupby sum operations, it’s important to consider how missing values (NaN) are handled. By default, pandas excludes NaN values when calculating the sum.
Here’s an example that demonstrates how pandas groupby sum handles missing values:
import pandas as pd
import numpy as np

# Create a sample DataFrame with missing values
df = pd.DataFrame({
    'Category': ['A', 'B', 'A', 'B', 'A', 'C'],
    'Value': [10, np.nan, 15, 25, np.nan, 35],
    'Website': ['pandasdataframe.com'] * 6
})

# Perform groupby sum with missing values
result = df.groupby('Category')['Value'].sum()

print(result)
Output:
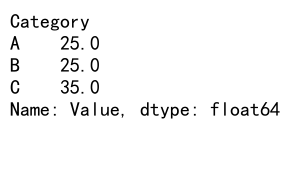
In this example, we have NaN values in the ‘Value’ column. When we perform the groupby sum operation, pandas automatically excludes these NaN values from the calculation.
Custom Aggregation Functions
While sum is a common aggregation function, pandas groupby allows you to use custom aggregation functions as well. This flexibility enables you to perform more complex calculations on your grouped data.
Here’s an example that demonstrates how to use a custom aggregation function with pandas groupby:
import pandas as pd

# Create a sample DataFrame
df = pd.DataFrame({
    'Category': ['A', 'B', 'A', 'B', 'A', 'C'],
    'Value': [10, 20, 15, 25, 30, 35],
    'Website': ['pandasdataframe.com'] * 6
})

# Define a custom aggregation function
def custom_agg(x):
    return x.sum() / x.count()

# Perform groupby with custom aggregation
result = df.groupby('Category')['Value'].agg(custom_agg)

print(result)
Output:
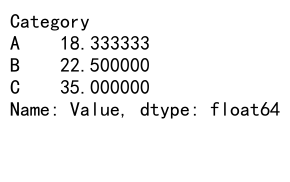
In this example, we define a custom aggregation function that calculates the average value for each group. We then use this function with the agg method to perform the custom aggregation on the grouped data.
Combining Multiple Aggregations
Pandas groupby sum can be combined with other aggregation functions to provide a more comprehensive summary of your data. This is particularly useful when you need to calculate multiple statistics for each group.
Here’s an example that demonstrates how to combine multiple aggregations:
import pandas as pd

# Create a sample DataFrame
df = pd.DataFrame({
    'Category': ['A', 'B', 'A', 'B', 'A', 'C'],
    'Value': [10, 20, 15, 25, 30, 35],
    'Website': ['pandasdataframe.com'] * 6
})

# Perform multiple aggregations
result = df.groupby('Category')['Value'].agg(['sum', 'mean', 'count'])

print(result)
Output:
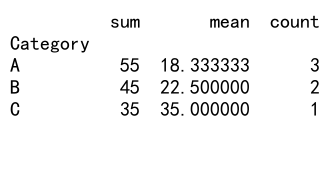
In this example, we use the agg method to apply multiple aggregation functions (‘sum’, ‘mean’, and ‘count’) to the grouped data. The result is a DataFrame containing the sum, mean, and count of ‘Value’ for each unique category.
Groupby Sum with Time Series Data
Pandas groupby sum is particularly useful when working with time series data. You can group data by various time intervals (e.g., day, week, month) and calculate sums for each period.
Here’s an example that demonstrates how to use pandas groupby sum with time series data:
import pandas as pd

# Create a sample DataFrame with date index
df = pd.DataFrame({
    'Date': pd.date_range(start='2023-01-01', end='2023-12-31', freq='D'),
    'Value': range(1, 366),
    'Website': ['pandasdataframe.com'] * 365
})
df.set_index('Date', inplace=True)

# Perform groupby sum by month
result = df.groupby(pd.Grouper(freq='M'))['Value'].sum()

print(result)
In this example, we create a DataFrame with a date index spanning a full year. We then use pd.Grouper(freq='M') to group the data by month and calculate the sum of ‘Value’ for each month.
Handling Large Datasets
When working with large datasets, pandas groupby sum operations can become memory-intensive. In such cases, it’s important to optimize your code to handle the data efficiently.
Here’s an example that demonstrates how to handle large datasets using chunking:
import pandas as pd

# Function to process data in chunks
def process_chunk(chunk):
    return chunk.groupby('Category')['Value'].sum()

# Create a sample large DataFrame (for demonstration purposes)
df = pd.DataFrame({
    'Category': ['A', 'B', 'C'] * 1000000,
    'Value': range(3000000),
    'Website': ['pandasdataframe.com'] * 3000000
})

# Process data in chunks
chunk_size = 100000
result = pd.DataFrame()

for chunk in pd.read_csv('large_dataset.csv', chunksize=chunk_size):
    chunk_result = process_chunk(chunk)
    result = result.add(chunk_result, fill_value=0)

print(result)
In this example, we define a function to process data chunks and use pd.read_csv with the chunksize parameter to read and process the data in smaller chunks. This approach helps manage memory usage when working with large datasets.
Advanced Groupby Sum Techniques
Pandas groupby sum offers several advanced techniques that can help you perform more complex data aggregations. Let’s explore some of these advanced features.
Using Transform for Group-wise Operations
The transform method allows you to perform group-wise operations while maintaining the original DataFrame’s shape. This is useful when you want to add aggregated values back to the original DataFrame.
Here’s an example that demonstrates the use of transform:
import pandas as pd

# Create a sample DataFrame
df = pd.DataFrame({
    'Category': ['A', 'B', 'A', 'B', 'A', 'C'],
    'Value': [10, 20, 15, 25, 30, 35],
    'Website': ['pandasdataframe.com'] * 6
})

# Add a new column with group sums
df['Group_Sum'] = df.groupby('Category')['Value'].transform('sum')

print(df)
Output:
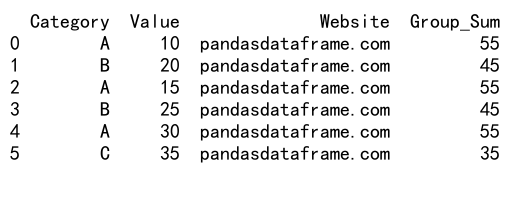
In this example, we use transform('sum') to calculate the sum of ‘Value’ for each category and add it as a new column ‘Group_Sum’ to the original DataFrame.
Filtering Groups Based on Aggregated Values
You can use pandas groupby sum to filter groups based on their aggregated values. This is particularly useful when you want to focus on groups that meet certain criteria.
Here’s an example that demonstrates group filtering:
import pandas as pd

# Create a sample DataFrame
df = pd.DataFrame({
    'Category': ['A', 'B', 'A', 'B', 'A', 'C'],
    'Value': [10, 20, 15, 25, 30, 35],
    'Website': ['pandasdataframe.com'] * 6
})

# Filter groups with sum of 'Value' greater than 50
result = df.groupby('Category').filter(lambda x: x['Value'].sum() > 50)

print(result)
Output:
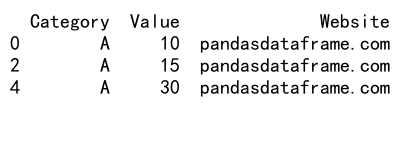
In this example, we use the filter method to keep only the groups where the sum of ‘Value’ is greater than 50. The result is a DataFrame containing only the rows from groups that meet this condition.
Applying Multiple Aggregations to Different Columns
Pandas groupby sum allows you to apply different aggregation functions to different columns in a single operation. This is useful when you need to calculate various statistics for different variables.
Here’s an example that demonstrates multiple aggregations on different columns:
import pandas as pd

# Create a sample DataFrame
df = pd.DataFrame({
    'Category': ['A', 'B', 'A', 'B', 'A', 'C'],
    'Value1': [10, 20, 15, 25, 30, 35],
    'Value2': [5, 10, 7, 12, 15, 18],
    'Website': ['pandasdataframe.com'] * 6
})

# Apply different aggregations to different columns
result = df.groupby('Category').agg({
    'Value1': 'sum',
    'Value2': ['mean', 'max']
})

print(result)
Output:
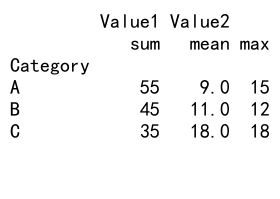
In this example, we use a dictionary in the agg method to specify different aggregation functions for each column. We calculate the sum of ‘Value1’ and both the mean and max of ‘Value2’ for each category.
Handling Hierarchical Indexes
Pandas groupby sum can work with hierarchical (multi-level) indexes, allowing for more complex data structures and aggregations.
Here’s an example that demonstrates working with hierarchical indexes:
import pandas as pd

# Create a sample DataFrame with hierarchical index
df = pd.DataFrame({
    'Category': ['A', 'A', 'B', 'B', 'C', 'C'],
    'Subcategory': ['X', 'Y', 'X', 'Y', 'X', 'Y'],
    'Value': [10, 15, 20, 25, 30, 35],
    'Website': ['pandasdataframe.com'] * 6
})
df.set_index(['Category', 'Subcategory'], inplace=True)

# Perform groupby sum on hierarchical index
result = df.groupby(level='Category')['Value'].sum()

print(result)
Output:
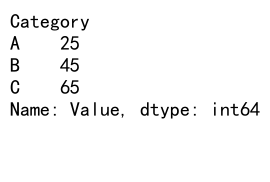
In this example, we create a DataFrame with a hierarchical index using ‘Category’ and ‘Subcategory’. We then perform a groupby sum operation on the ‘Category’ level of the index.
Groupby Sum with Categorical Data
When working with categorical data, pandas groupby sum can help you analyze the distribution of values across different categories.
Here’s an example that demonstrates groupby sum with categorical data:
import pandas as pd

# Create a sample DataFrame with categorical data
df = pd.DataFrame({
    'Category': pd.Categorical(['A', 'B', 'A', 'B', 'A', 'C']),
    'Value': [10, 20, 15, 25, 30, 35],
    'Website': ['pandasdataframe.com']* 6
})

# Perform groupby sum on categorical data
result = df.groupby('Category')['Value'].sum()

print(result)
In this example, we create a DataFrame with a categorical ‘Category’ column. We then perform a groupby sum operation on this categorical data, which can be more memory-efficient than using string-based categories.
Handling Time Zones in Groupby Sum Operations
When working with time series data from different time zones, it’s important to handle time zones correctly in your pandas groupby sum operations.
Here’s an example that demonstrates how to work with time zones:
import pandas as pd
import pytz

# Create a sample DataFrame with time zone aware timestamps
df = pd.DataFrame({
    'Timestamp': pd.date_range(start='2023-01-01', end='2023-12-31', freq='D', tz='UTC'),
    'Value': range(1, 366),
    'Website': ['pandasdataframe.com'] * 365
})

# Convert to a different time zone
df['Timestamp'] = df['Timestamp'].dt.tz_convert('US/Eastern')

# Perform groupby sum by month in the new time zone
result = df.groupby(df['Timestamp'].dt.to_period('M'))['Value'].sum()

print(result)
In this example, we create a DataFrame with UTC timestamps, convert them to US/Eastern time zone, and then perform a groupby sum operation by month. This ensures that the aggregation is done correctly according to the specified time zone.
Optimizing Pandas GroupBy Sum Performance
When working with large datasets, optimizing the performance of pandas groupby sum operations becomes crucial. Here are some techniques to improve performance:
- Use categorical data types for grouping columns
- Avoid unnecessary columns in the DataFrame
- Use
numbafor custom aggregation functions - Consider using
daskfor distributed computing on very large datasets
Here’s an example that demonstrates some of these optimization techniques:
import pandas as pd
import numpy as np
from numba import jit

# Create a large sample DataFrame
df = pd.DataFrame({
    'Category': np.random.choice(['A', 'B', 'C'], size=1000000),
    'Value': np.random.rand(1000000),
    'Website': ['pandasdataframe.com'] * 1000000
})

# Convert 'Category' to categorical
df['Category'] = df['Category'].astype('category')

# Define a custom aggregation function using numba
@jit(nopython=True)
def custom_sum(values):
    return np.sum(values)

# Perform optimized groupby sum
result = df.groupby('Category')['Value'].agg(custom_sum)

print(result)
In this example, we use a categorical data type for the ‘Category’ column and a numba-optimized custom aggregation function to improve the performance of the groupby sum operation.
Combining Pandas GroupBy Sum with Other Pandas Functions
Pandas groupby sum can be combined with other pandas functions to perform more complex data analysis tasks. Let’s explore some common combinations:
Merging After GroupBy Sum
You can use the result of a groupby sum operation to merge with other DataFrames:
import pandas as pd

# Create sample DataFrames
df1 = pd.DataFrame({
    'Category': ['A', 'B', 'A', 'B', 'A', 'C'],
    'Value': [10, 20, 15, 25, 30, 35],
    'Website': ['pandasdataframe.com'] * 6
})

df2 = pd.DataFrame({
    'Category': ['A', 'B', 'C', 'D'],
    'Multiplier': [2, 3, 4, 5],
    'Website': ['pandasdataframe.com'] * 4
})

# Perform groupby sum
grouped_sum = df1.groupby('Category')['Value'].sum().reset_index()

# Merge with df2
result = pd.merge(grouped_sum, df2, on='Category', how='left')

print(result)
Output:

In this example, we perform a groupby sum operation on df1 and then merge the result with df2 based on the ‘Category’ column.
Pivot Tables with GroupBy Sum
You can create pivot tables using the result of a groupby sum operation:
import pandas as pd

# Create a sample DataFrame
df = pd.DataFrame({
    'Category': ['A', 'B', 'A', 'B', 'A', 'C'],
    'Subcategory': ['X', 'Y', 'X', 'Z', 'Y', 'X'],
    'Value': [10, 20, 15, 25, 30, 35],
    'Website': ['pandasdataframe.com'] * 6
})

# Perform groupby sum and pivot
result = df.groupby(['Category', 'Subcategory'])['Value'].sum().unstack()

print(result)
Output:
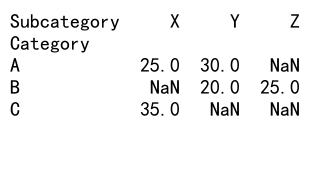
In this example, we perform a groupby sum operation on ‘Category’ and ‘Subcategory’, then use unstack() to create a pivot table with ‘Category’ as rows and ‘Subcategory’ as columns.
Handling Errors and Edge Cases in Pandas GroupBy Sum
When working with pandas groupby sum, it’s important to handle potential errors and edge cases. Here are some common scenarios and how to address them:
Dealing with Empty Groups
When performing a groupby sum operation, you may encounter empty groups. Here’s how to handle them:
import pandas as pd

# Create a sample DataFrame with an empty group
df = pd.DataFrame({
    'Category': ['A', 'B', 'A', 'B', 'A', 'C'],
    'Value': [10, 20, 15, 25, 30, 0],
    'Website': ['pandasdataframe.com'] * 6
})

# Perform groupby sum with a fill value for empty groups
result = df.groupby('Category')['Value'].sum().fillna(0)

print(result)
Output:
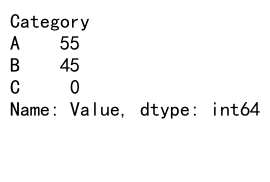
In this example, we use fillna(0) to replace any NaN values resulting from empty groups with 0.
Handling Overflow Errors
When working with large numbers, you may encounter overflow errors. Here’s how to handle them:
import pandas as pd
import numpy as np

# Create a sample DataFrame with large numbers
df = pd.DataFrame({
    'Category': ['A', 'B', 'A', 'B', 'A', 'C'],
    'Value': [1e20, 2e20, 1.5e20, 2.5e20, 3e20, 3.5e20],
    'Website': ['pandasdataframe.com'] * 6
})

# Perform groupby sum with dtype=np.float64 to avoid overflow
result = df.groupby('Category')['Value'].sum(dtype=np.float64)

print(result)
In this example, we use dtype=np.float64 in the sum operation to ensure that the calculation is performed using 64-bit floating-point numbers, which can handle larger values.
Conclusion
Pandas groupby sum is a powerful tool for data aggregation and analysis in Python. Throughout this comprehensive guide, we’ve explored various aspects of using pandas groupby sum, from basic usage to advanced techniques and optimizations. By mastering these concepts and techniques, you’ll be well-equipped to handle a wide range of data analysis tasks efficiently.
 Pandas Dataframe