Pandas Aggregation: Distinct Count
In data analysis, understanding the unique values within your dataset is crucial for recognizing patterns, identifying anomalies, and making informed decisions. Pandas, a powerful data manipulation library in Python, provides various methods to perform aggregations, one of which includes counting distinct values. This article explores how to use the agg function in Pandas to perform distinct counts, which is a common requirement in data analysis tasks.
Introduction to Pandas Aggregation
Pandas offers a wide range of functionalities for data manipulation and analysis. Aggregation is a process in which we combine multiple pieces of data into a single result, typically to get a summary statistic like count, sum, average, minimum, or maximum. When dealing with large datasets, these aggregations become essential for summarizing data and extracting meaningful insights.
Basic Setup
Before diving into the examples, ensure you have the Pandas library installed in your Python environment. If not, you can install it using pip:
pip install pandas
Now, import Pandas and create a simple DataFrame to work with:
import pandas as pd

data = {
    'Domain': ['pandasdataframe.com', 'pandasdataframe.com', 'pandasdataframe.com', 'example.com', 'example.com'],
    'User': ['Alice', 'Bob', 'Alice', 'Charlie', 'Charlie'],
    'Visits': [1, 2, 1, 3, 1]
}
df = pd.DataFrame(data)
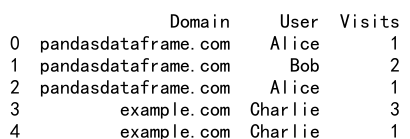
print(df)
Output:

Counting Distinct Values Using agg
The agg function in Pandas allows you to apply one or more operations over the specified axis. It is particularly useful when you need to perform multiple aggregations at once or when you want to apply a specific function.
Example 1: Basic Distinct Count
To count distinct values in a single column:
import pandas as pd

data = {
    'Domain': ['pandasdataframe.com', 'pandasdataframe.com', 'pandasdataframe.com', 'example.com', 'example.com'],
    'User': ['Alice', 'Bob', 'Alice', 'Charlie', 'Charlie'],
    'Visits': [1, 2, 1, 3, 1]
}
df = pd.DataFrame(data)

result = df['User'].agg(pd.Series.nunique)
print(result)
Output:

Example 2: Distinct Count on Grouped Data
Grouping data based on certain criteria and then counting distinct values within each group:
import pandas as pd

data = {
    'Domain': ['pandasdataframe.com', 'pandasdataframe.com', 'pandasdataframe.com', 'example.com', 'example.com'],
    'User': ['Alice', 'Bob', 'Alice', 'Charlie', 'Charlie'],
    'Visits': [1, 2, 1, 3, 1]
}
df = pd.DataFrame(data)

result = df.groupby('Domain')['User'].agg(pd.Series.nunique)
print(result)
Output:

Example 3: Multiple Aggregations
Applying multiple aggregation functions at once, including distinct count:
import pandas as pd

data = {
    'Domain': ['pandasdataframe.com', 'pandasdataframe.com', 'pandasdataframe.com', 'example.com', 'example.com'],
    'User': ['Alice', 'Bob', 'Alice', 'Charlie', 'Charlie'],
    'Visits': [1, 2, 1, 3, 1]
}
df = pd.DataFrame(data)

result = df.agg({'User': pd.Series.nunique, 'Visits': sum})
print(result)
Example 4: Distinct Count with Conditions
Counting distinct values where certain conditions are met:
import pandas as pd

data = {
    'Domain': ['pandasdataframe.com', 'pandasdataframe.com', 'pandasdataframe.com', 'example.com', 'example.com'],
    'User': ['Alice', 'Bob', 'Alice', 'Charlie', 'Charlie'],
    'Visits': [1, 2, 1, 3, 1]
}
df = pd.DataFrame(data)

result = df[df['Visits'] > 1]['User'].agg(pd.Series.nunique)
print(result)
Output:

Example 5: Distinct Count Across Multiple Columns
Counting distinct combinations of values across multiple columns:
import pandas as pd

data = {
    'Domain': ['pandasdataframe.com', 'pandasdataframe.com', 'pandasdataframe.com', 'example.com', 'example.com'],
    'User': ['Alice', 'Bob', 'Alice', 'Charlie', 'Charlie'],
    'Visits': [1, 2, 1, 3, 1]
}
df = pd.DataFrame(data)

result = df.groupby(['Domain', 'User']).size().reset_index(name='Counts')
distinct_count = result['Domain'].agg(pd.Series.nunique)
print(distinct_count)
Output:

Example 6: Using nunique Directly
Sometimes, using nunique directly on the DataFrame or Series can be more straightforward:
import pandas as pd

data = {
    'Domain': ['pandasdataframe.com', 'pandasdataframe.com', 'pandasdataframe.com', 'example.com', 'example.com'],
    'User': ['Alice', 'Bob', 'Alice', 'Charlie', 'Charlie'],
    'Visits': [1, 2, 1, 3, 1]
}
df = pd.DataFrame(data)

result = df['User'].nunique()
print(result)
Output:

Example 7: Distinct Count in a Pivot Table
Creating a pivot table and then applying a distinct count:
import pandas as pd

data = {
    'Domain': ['pandasdataframe.com', 'pandasdataframe.com', 'pandasdataframe.com', 'example.com', 'example.com'],
    'User': ['Alice', 'Bob', 'Alice', 'Charlie', 'Charlie'],
    'Visits': [1, 2, 1, 3, 1]
}
df = pd.DataFrame(data)

pivot_table = df.pivot_table(index='Domain', columns='User', values='Visits', aggfunc='sum')
distinct_count = pivot_table.agg(pd.Series.nunique, axis=1)
print(distinct_count)
Output:

Example 8: Custom Aggregation Function
Defining a custom aggregation function to count distinct values:
import pandas as pd

data = {
    'Domain': ['pandasdataframe.com', 'pandasdataframe.com', 'pandasdataframe.com', 'example.com', 'example.com'],
    'User': ['Alice', 'Bob', 'Alice', 'Charlie', 'Charlie'],
    'Visits': [1, 2, 1, 3, 1]
}
df = pd.DataFrame(data)

def distinct_count(series):
    return series.nunique()

result = df['User'].agg(distinct_count)
print(result)
Output:

Example 9: Distinct Count on Filtered Data
Applying a distinct count on a subset of data filtered by another column:
import pandas as pd

data = {
    'Domain': ['pandasdataframe.com', 'pandasdataframe.com', 'pandasdataframe.com', 'example.com', 'example.com'],
    'User': ['Alice', 'Bob', 'Alice', 'Charlie', 'Charlie'],
    'Visits': [1, 2, 1, 3, 1]
}
df = pd.DataFrame(data)

filtered_data = df[df['Domain'] == 'pandasdataframe.com']
result = filtered_data['User'].agg(pd.Series.nunique)
print(result)
Output:

Example 10: Distinct Count After Concatenation
Concatenating two DataFrames and then counting distinct values:
import pandas as pd

data = {
    'Domain': ['pandasdataframe.com', 'pandasdataframe.com', 'pandasdataframe.com', 'example.com', 'example.com'],
    'User': ['Alice', 'Bob', 'Alice', 'Charlie', 'Charlie'],
    'Visits': [1, 2, 1, 3, 1]
}
df = pd.DataFrame(data)

df2 = pd.DataFrame({
    'Domain': ['pandasdataframe.com', 'newsite.com'],
    'User': ['Alice', 'Zara'],
    'Visits': [1, 1]
})
combined_df = pd.concat([df, df2])
result = combined_df['User'].agg(pd.Series.nunique)
print(result)
Output:

Pandas agg distinct count conclusion
Counting distinct values is a fundamental task in data analysis, helping to understand the diversity and frequency of data. Pandas provides versatile tools like agg, groupby, and nunique to make these tasks easier and more intuitive. By mastering these techniques, you can efficiently summarize and analyze large datasets, gaining deeper insights into your data.
In this article, we explored various ways to count distinct values using Pandas, from simple distinct counts to more complex aggregations involving conditions and custom functions. These examples serve as a foundation for performing advanced data analysis tasks in Python using Pandas.
 Pandas Dataframe