Pandas agg percentile
In this article, we will explore the use of the Pandas library in Python for data aggregation, with a special focus on calculating percentiles. Pandas is a powerful tool for data manipulation and analysis, providing support for operations such as merging, reshaping, selecting, as well as aggregations like summing and averaging. One of the more advanced features of Pandas is its ability to compute percentiles, which can be particularly useful in statistical analyses where you need to understand the distribution of your data.
Introduction to Pandas
Pandas is an open-source library that provides high-performance, easy-to-use data structures, and data analysis tools for Python. The primary data structure in Pandas is the DataFrame, which can be thought of as a table of data with rows and columns.
import pandas as pd

# Creating a simple DataFrame
data = {
    'Website': ['pandasdataframe.com', 'pandasdataframe.com', 'pandasdataframe.com'],
    'Visitors': [100, 200, 300],
    'Bounce Rate': [20, 25, 15]
}
df = pd.DataFrame(data)
print(df)
Output:

Basic Aggregation
Aggregation in Pandas can be performed using the groupby and agg functions. These allow you to group your data by certain columns and then apply various aggregation functions like sum, mean, and median.
import pandas as pd

# Creating a simple DataFrame
data = {
    'Website': ['pandasdataframe.com', 'pandasdataframe.com', 'pandasdataframe.com'],
    'Visitors': [100, 200, 300],
    'Bounce Rate': [20, 25, 15]
}
df = pd.DataFrame(data)

# Grouping and aggregating data
grouped = df.groupby('Website')
aggregated = grouped.agg({
    'Visitors': 'sum',
    'Bounce Rate': 'mean'
})
print(aggregated)
Output:

Percentiles in Aggregation
Percentiles are measures used in statistics indicating the value below which a given percentage of observations in a group of observations fall. The Pandas agg function can be used to compute percentiles using the quantile function.
import pandas as pd

# Creating a simple DataFrame
data = {
    'Website': ['pandasdataframe.com', 'pandasdataframe.com', 'pandasdataframe.com'],
    'Visitors': [100, 200, 300],
    'Bounce Rate': [20, 25, 15]
}
df = pd.DataFrame(data)

# Computing the 50th percentile (median) using agg
percentile_50 = df['Visitors'].agg(lambda x: x.quantile(0.5))
print(percentile_50)
Output:

Detailed Examples of Percentile Calculations
Let’s dive deeper into various ways to calculate and use percentiles in Pandas through multiple examples.
Example 1: Basic Percentile Calculation
import pandas as pd

# Creating a simple DataFrame
data = {
    'Website': ['pandasdataframe.com', 'pandasdataframe.com', 'pandasdataframe.com'],
    'Visitors': [100, 200, 300],
    'Bounce Rate': [20, 25, 15]
}
df = pd.DataFrame(data)

# Calculate the 25th percentile for the 'Visitors' column
percentile_25 = df['Visitors'].quantile(0.25)
print(percentile_25)
Output:

Example 2: Multiple Percentiles at Once
import pandas as pd

# Creating a simple DataFrame
data = {
    'Website': ['pandasdataframe.com', 'pandasdataframe.com', 'pandasdataframe.com'],
    'Visitors': [100, 200, 300],
    'Bounce Rate': [20, 25, 15]
}
df = pd.DataFrame(data)

# Calculate the 25th and 75th percentiles
percentiles = df['Visitors'].quantile([0.25, 0.75])
print(percentiles)
Output:

Example 3: Percentiles with GroupBy
import pandas as pd

# Creating a simple DataFrame
data = {
    'Website': ['pandasdataframe.com', 'pandasdataframe.com', 'pandasdataframe.com'],
    'Visitors': [100, 200, 300],
    'Bounce Rate': [20, 25, 15]
}
df = pd.DataFrame(data)

# Calculate percentiles after grouping by 'Website'
grouped_percentiles = df.groupby('Website')['Visitors'].quantile([0.25, 0.75])
print(grouped_percentiles)
Output:

Example 4: Custom Percentile Function
import pandas as pd

# Creating a simple DataFrame
data = {
    'Website': ['pandasdataframe.com', 'pandasdataframe.com', 'pandasdataframe.com'],
    'Visitors': [100, 200, 300],
    'Bounce Rate': [20, 25, 15]
}
df = pd.DataFrame(data)

# Define a custom function to calculate the 90th percentile
def percentile_90(x):
    return x.quantile(0.9)

custom_percentile = df['Visitors'].agg(percentile_90)
print(custom_percentile)
Output:

Example 5: Using describe to Get Percentiles
import pandas as pd

# Creating a simple DataFrame
data = {
    'Website': ['pandasdataframe.com', 'pandasdataframe.com', 'pandasdataframe.com'],
    'Visitors': [100, 200, 300],
    'Bounce Rate': [20, 25, 15]
}
df = pd.DataFrame(data)

# Using describe to get a summary that includes percentiles
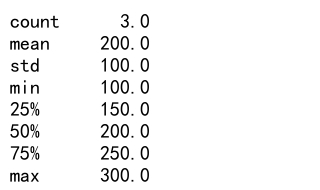
description = df['Visitors'].describe(percentiles=[0.25, 0.5, 0.75])
print(description)
Output:

Example 6: Conditional Percentiles
import pandas as pd

# Creating a simple DataFrame
data = {
    'Website': ['pandasdataframe.com', 'pandasdataframe.com', 'pandasdataframe.com'],
    'Visitors': [100, 200, 300],
    'Bounce Rate': [20, 25, 15]
}
df = pd.DataFrame(data)

# Calculate the 50th percentile for 'Visitors' where 'Bounce Rate' is above 20
conditional_percentile = df[df['Bounce Rate'] > 20]['Visitors'].quantile(0.5)
print(conditional_percentile)
Output:

Example 7: Percentiles in a Lambda Function
import pandas as pd

# Creating a simple DataFrame
data = {
    'Website': ['pandasdataframe.com', 'pandasdataframe.com', 'pandasdataframe.com'],
    'Visitors': [100, 200, 300],
    'Bounce Rate': [20, 25, 15]
}
df = pd.DataFrame(data)

# Using a lambda function to calculate multiple percentiles
lambda_percentiles = df['Visitors'].agg(lambda x: [x.quantile(i) for i in [0.2, 0.4, 0.6, 0.8]])
print(lambda_percentiles)
Output:

Example 8: Percentiles with a Custom Index
import pandas as pd

# Creating a simple DataFrame
data = {
    'Website': ['pandasdataframe.com', 'pandasdataframe.com', 'pandasdataframe.com'],
    'Visitors': [100, 200, 300],
    'Bounce Rate': [20, 25, 15]
}
df = pd.DataFrame(data)

# Calculate percentiles and assign custom index names
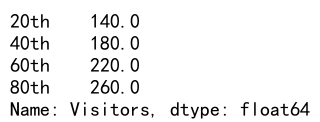
custom_index_percentiles = df['Visitors'].quantile([0.2, 0.4, 0.6, 0.8]).rename(index={0.2: '20th', 0.4: '40th', 0.6: '60th', 0.8: '80th'})
print(custom_index_percentiles)
Output:

Example 9: Dynamic Percentile Calculation
import pandas as pd

# Creating a simple DataFrame
data = {
    'Website': ['pandasdataframe.com', 'pandasdataframe.com', 'pandasdataframe.com'],
    'Visitors': [100, 200, 300],
    'Bounce Rate': [20, 25, 15]
}
df = pd.DataFrame(data)

# Dynamically calculate a range of percentiles
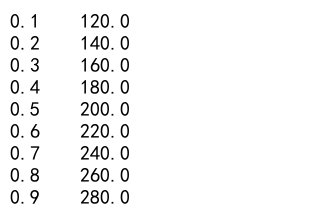
dynamic_percentiles = df['Visitors'].quantile([i/10 for i in range(1, 10)])
print(dynamic_percentiles)
Output:

Example 10: Percentiles with Reset Index
import pandas as pd

# Creating a simple DataFrame
data = {
    'Website': ['pandasdataframe.com', 'pandasdataframe.com', 'pandasdataframe.com'],
    'Visitors': [100, 200, 300],
    'Bounce Rate': [20, 25, 15]
}
df = pd.DataFrame(data)

# Calculate percentiles and reset the index for better readability
reset_index_percentiles = df.groupby('Website')['Visitors'].quantile([0.25, 0.75]).reset_index()
print(reset_index_percentiles)
Output:

Pandas agg percentile conclusion
In this article, we explored how to use Pandas for data aggregation with a focus on percentile calculations. We covered a range of examples showing different ways to compute and utilize percentiles in data analysis.
 Pandas Dataframe