Pandas Aggregation Functions
Pandas is a powerful library in Python widely used for data manipulation and analysis. One of the key features of pandas is its ability to perform aggregation operations efficiently on large datasets. Aggregation functions in pandas help summarize data which is a crucial step in data analysis, allowing us to extract useful statistics and insights. In this article, we will explore various aggregation functions provided by pandas, how to use them, and when they are applicable with comprehensive examples.
Introduction to Aggregation in Pandas
Aggregation refers to the process of combining multiple pieces of data into a single result. In pandas, this can be achieved using the agg() function, which allows for applying one or more operations over the specified axis. This function is highly versatile and can be used with a DataFrame or a Series object.
Example 1: Basic Aggregation
import pandas as pd
import numpy as np

# Creating a DataFrame
df = pd.DataFrame({
    'A': np.random.randn(50),
    'B': np.random.randint(1, 100, 50),
    'C': pd.Series(np.random.randn(50), index=np.arange(50)),
    'D': pd.Series("pandasdataframe.com", index=np.arange(50))
})

# Using agg to find the mean of column A and the sum of column B
result = df[['A', 'B']].agg(['mean', 'sum'])
print(result)
Output:

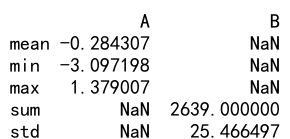
Example 2: Applying Multiple Functions to Multiple Columns
import pandas as pd
import numpy as np

# Creating a DataFrame
df = pd.DataFrame({
    'A': np.random.randn(50),
    'B': np.random.randint(1, 100, 50),
    'C': pd.Series(np.random.randn(50), index=np.arange(50)),
    'D': pd.Series("pandasdataframe.com", index=np.arange(50))
})

# Applying multiple aggregation functions to each column
result = df.agg({
    'A': ['mean', 'min', 'max'],
    'B': ['sum', 'std']
})
print(result)
Output:

Custom Aggregation Functions
Pandas allows the use of custom functions in aggregation, which can be passed using the agg() function. This is particularly useful when predefined functions do not meet the requirements.
Example 3: Using a Custom Function
import pandas as pd
import numpy as np

# Creating a DataFrame
df = pd.DataFrame({
    'A': np.random.randn(50),
    'B': np.random.randint(1, 100, 50),
    'C': pd.Series(np.random.randn(50), index=np.arange(50)),
    'D': pd.Series("pandasdataframe.com", index=np.arange(50))
})

# Define a custom function
def range_diff(x):
    return x.max() - x.min()

# Apply the custom function
result = df['B'].agg(range_diff)
print(result)
Output:

Aggregation with GroupBy
Grouping is another powerful feature in pandas that works well with aggregation. Using groupby() along with agg(), we can perform aggregation on grouped data.
Example 4: GroupBy with Aggregation
import pandas as pd
import numpy as np

# Creating a DataFrame
df = pd.DataFrame({
    'A': np.random.randn(50),
    'B': np.random.randint(1, 100, 50),
    'C': pd.Series(np.random.randn(50), index=np.arange(50)),
    'D': pd.Series("pandasdataframe.com", index=np.arange(50))
})

# Grouping by a column and aggregating
grouped = df.groupby('D')
result = grouped.agg({
    'A': 'mean',
    'B': 'sum'
})
print(result)
Output:

Advanced Aggregation Techniques
Pandas also supports more advanced aggregation techniques, such as window functions and expanding transformations.
Example 5: Rolling Aggregation
import pandas as pd
import numpy as np

# Creating a DataFrame
df = pd.DataFrame({
    'A': np.random.randn(50),
    'B': np.random.randint(1, 100, 50),
    'C': pd.Series(np.random.randn(50), index=np.arange(50)),
    'D': pd.Series("pandasdataframe.com", index=np.arange(50))
})

# Applying a rolling mean
rolling = df['A'].rolling(window=5)
result = rolling.agg('mean')
print(result)
Output:

Example 6: Expanding Aggregation
import pandas as pd
import numpy as np

# Creating a DataFrame
df = pd.DataFrame({
    'A': np.random.randn(50),
    'B': np.random.randint(1, 100, 50),
    'C': pd.Series(np.random.randn(50), index=np.arange(50)),
    'D': pd.Series("pandasdataframe.com", index=np.arange(50))
})

# Applying an expanding sum
expanding = df['B'].expanding(min_periods=1)
result = expanding.agg('sum')
print(result)
Output:

Combining Aggregations
It is often useful to combine different aggregations at once, which can be done easily in pandas.
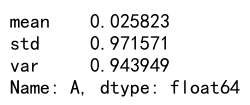
Example 7: Multiple Aggregations on the Same Column
import pandas as pd
import numpy as np

# Creating a DataFrame
df = pd.DataFrame({
    'A': np.random.randn(50),
    'B': np.random.randint(1, 100, 50),
    'C': pd.Series(np.random.randn(50), index=np.arange(50)),
    'D': pd.Series("pandasdataframe.com", index=np.arange(50))
})

# Applying multiple functions to the same column
result = df['A'].agg(['mean', 'std', 'var'])
print(result)
Output:

Aggregation Across Different Axes
Pandas allows aggregation across different axes of the DataFrame.
Example 8: Aggregation Across Columns
import pandas as pd
import numpy as np

# Creating a DataFrame
df = pd.DataFrame({
    'A': np.random.randn(50),
    'B': np.random.randint(1, 100, 50),
    'C': pd.Series(np.random.randn(50), index=np.arange(50)),
    'D': pd.Series("pandasdataframe.com", index=np.arange(50))
})

# Aggregating across columns, finding the mean across rows
result = df.agg('mean', axis='columns')
print(result)
Example 9: Aggregation Across Rows
import pandas as pd
import numpy as np

# Creating a DataFrame
df = pd.DataFrame({
    'A': np.random.randn(50),
    'B': np.random.randint(1, 100, 50),
    'C': pd.Series(np.random.randn(50), index=np.arange(50)),
    'D': pd.Series("pandasdataframe.com", index=np.arange(50))
})

# Aggregating across rows, finding the sum across columns
result = df.agg('sum', axis='rows')
print(result)
Output:

Pandas Aggregation Functions Conclusion
Pandas aggregation functions are essential tools for data analysis, allowing data scientists to summarize complex data sets to derive insights. The flexibility of the agg() function, combined with the power of custom functions and the ability to group data, makes pandas a highly effective tool for data manipulation. By mastering these aggregation techniques, one can efficiently handle large datasets and perform complex data analysis tasks.
This article has covered a range of examples demonstrating the use of pandas aggregation functions in various scenarios. Each example is designed to be self-contained and directly runnable, providing a practical understanding of how to apply these techniques in real-world data analysis tasks.
 Pandas Dataframe