Pandas agg standard deviation
Pandas is a powerful Python library for data manipulation and analysis. It provides numerous functions to perform aggregations, one of which is calculating the standard deviation. The standard deviation is a measure of the amount of variation or dispersion in a set of values. In this article, we will explore how to use the Pandas library to compute the standard deviation of datasets in various scenarios. We will provide detailed examples with complete, standalone code snippets that can be executed directly.
Understanding Standard Deviation
Standard deviation is a statistic that measures the dispersion of a dataset relative to its mean. If the data points are further from the mean, there is higher deviation within the dataset; hence, the standard deviation is higher.
Example 1: Basic Standard Deviation
Let’s start with a simple example where we calculate the standard deviation of a single column in a DataFrame.
import pandas as pd
import numpy as np

# Creating a DataFrame
data = {'Values': np.random.normal(loc=0, scale=1, size=100)}
df = pd.DataFrame(data)

# Calculating standard deviation
std_dev = df['Values'].std()
print(std_dev)
Output:

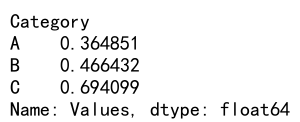
Example 2: Standard Deviation on Grouped Data
Calculating the standard deviation on grouped data can provide insights into the variability of data within sub-categories.
import pandas as pd
import numpy as np

# Creating a DataFrame
data = {
    'Category': ['A', 'A', 'B', 'B', 'C', 'C'],
    'Values': np.random.normal(loc=0, scale=1, size=6)
}
df = pd.DataFrame(data)

# Grouping by 'Category' and calculating standard deviation
grouped_std_dev = df.groupby('Category')['Values'].std()
print(grouped_std_dev)
Output:

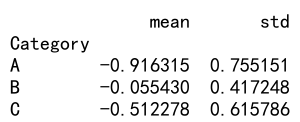
Example 3: Multiple Aggregations Including Standard Deviation
Pandas allows you to perform multiple aggregations at once, which can be very useful for summarizing data efficiently.
import pandas as pd
import numpy as np

# Creating a DataFrame
data = {
    'Category': ['A', 'A', 'B', 'B', 'C', 'C'],
    'Values': np.random.normal(loc=0, scale=1, size=6)
}
df = pd.DataFrame(data)

# Using agg() to apply multiple aggregation functions
result = df.groupby('Category')['Values'].agg(['mean', 'std'])
print(result)
Output:

Example 4: Standard Deviation with Missing Values
Handling missing values is an essential part of data analysis. Pandas provides functionality to handle NaN values gracefully when calculating standard deviation.
import pandas as pd
import numpy as np

# Creating a DataFrame with missing values
data = {
    'Values': [1, 2, np.nan, 4, 5]
}
df = pd.DataFrame(data)

# Calculating standard deviation, ignoring NaN values
std_dev = df['Values'].std()
print(std_dev)
Output:

Example 5: Weighted Standard Deviation
Sometimes, each data point might not contribute equally to the overall calculation. In such cases, a weighted standard deviation might be more appropriate.
import pandas as pd
import numpy as np

# Creating a DataFrame
data = {
    'Values': np.random.normal(loc=0, scale=1, size=100),
    'Weights': np.random.random(size=100)
}
df = pd.DataFrame(data)

# Calculating weighted standard deviation
mean = np.average(df['Values'], weights=df['Weights'])
sum_of_weights = df['Weights'].sum()
weighted_std_dev = np.sqrt(np.average((df['Values'] - mean)**2, weights=df['Weights']))
print(weighted_std_dev)
Output:

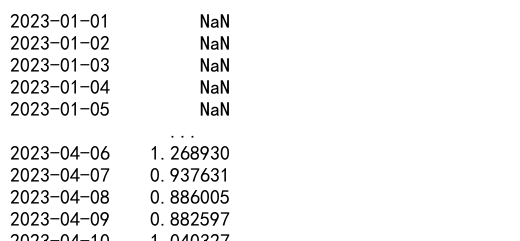
Example 6: Standard Deviation of Time Series Data
Time series data often requires different handling due to its sequential nature. Here’s how you can compute the standard deviation for time series data.
import pandas as pd
import numpy as np

# Creating a time series DataFrame
dates = pd.date_range(start='2023-01-01', periods=100)
data = {
    'Values': np.random.normal(loc=0, scale=1, size=100)
}
df = pd.DataFrame(data, index=dates)

# Calculating rolling standard deviation
rolling_std_dev = df['Values'].rolling(window=10).std()
print(rolling_std_dev)
Output:

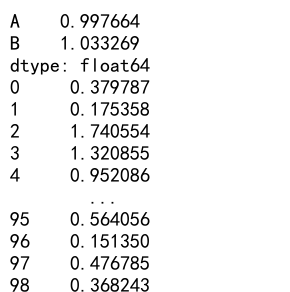
Example 7: Standard Deviation Across Different Axes
In a DataFrame with multiple columns, you might want to calculate the standard deviation across different axes.
import pandas as pd
import numpy as np

# Creating a DataFrame
data = {
    'A': np.random.normal(loc=0, scale=1, size=100),
    'B': np.random.normal(loc=0, scale=1, size=100)
}
df = pd.DataFrame(data)

# Calculating standard deviation across different axes
std_dev_columns = df.std(axis=0)
std_dev_rows = df.std(axis=1)
print(std_dev_columns)
print(std_dev_rows)
Output:

Example 8: Standard Deviation with Filters
Applying filters before calculating standard deviation can help isolate specific segments of the data.
import pandas as pd
import numpy as np

# Creating a DataFrame
data = {
    'Category': ['A', 'B', 'C', 'A', 'B', 'C'],
    'Values': np.random.normal(loc=0, scale=1, size=6)
}
df = pd.DataFrame(data)

# Filtering and calculating standard deviation
filtered_std_dev = df[df['Category'] == 'A']['Values'].std()
print(filtered_std_dev)
Output:

Pandas agg standard deviation conclusion
In this article, we explored various ways to calculate the standard deviation using the Pandas library. We covered basic calculations, handling grouped data, dealing with missing values, and applying custom functions. Each example provided a complete, standalone code snippet that can be executed directly to understand the concepts better. By mastering these techniques, you can effectively analyze the variability and dispersion in your datasets, providing valuable insights into your data analysis projects.
 Pandas Dataframe