Pandas Drop Row
Pandas is a powerful data manipulation library in Python, and one of its most commonly used features is the ability to drop rows from a DataFrame. This operation is crucial for data cleaning, preprocessing, and analysis. In this comprehensive guide, we’ll explore various methods and techniques for dropping rows in Pandas, along with detailed examples and explanations.
1. Introduction to Dropping Rows in Pandas
Dropping rows in Pandas refers to the process of removing specific rows from a DataFrame based on certain conditions or criteria. This operation is essential when dealing with missing data, outliers, or unwanted observations in your dataset.
Let’s start with a basic example of how to drop rows in Pandas:
import pandas as pd

# Create a sample DataFrame
df = pd.DataFrame({
    'Name': ['John', 'Emma', 'Alex', 'Sarah'],
    'Age': [25, 30, 35, 28],
    'City': ['New York', 'London', 'Paris', 'Tokyo'],
    'Website': ['pandasdataframe.com'] * 4
})

# Drop a row by index
df_dropped = df.drop(1)

print("Original DataFrame:")
print(df)
print("\nDataFrame after dropping row with index 1:")
print(df_dropped)
Output:
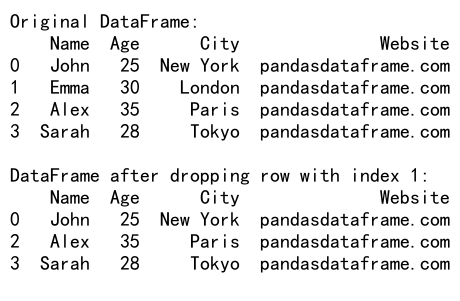
In this example, we create a simple DataFrame and then use the drop() method to remove the row with index 1. The drop() method returns a new DataFrame with the specified row removed, leaving the original DataFrame unchanged.
2. Dropping Rows by Index
Pandas provides several ways to drop rows based on their index. Let’s explore these methods in detail.
2.1 Dropping a Single Row by Index
To drop a single row by its index, you can use the drop() method with the index label:
import pandas as pd

# Create a sample DataFrame
df = pd.DataFrame({
    'Name': ['John', 'Emma', 'Alex', 'Sarah', 'Michael'],
    'Age': [25, 30, 35, 28, 40],
    'City': ['New York', 'London', 'Paris', 'Tokyo', 'Berlin'],
    'Website': ['pandasdataframe.com'] * 5
})

# Drop a single row by index
df_dropped = df.drop(2)

print("Original DataFrame:")
print(df)
print("\nDataFrame after dropping row with index 2:")
print(df_dropped)
Output:
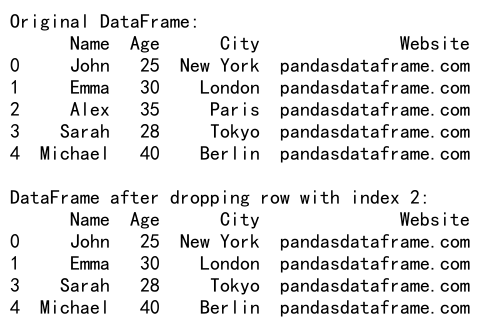
In this example, we drop the row with index 2 from the DataFrame. The drop() method returns a new DataFrame without modifying the original one.
2.2 Dropping Multiple Rows by Index
You can also drop multiple rows by passing a list of index labels to the drop() method:
import pandas as pd

# Create a sample DataFrame
df = pd.DataFrame({
    'Name': ['John', 'Emma', 'Alex', 'Sarah', 'Michael', 'Olivia'],
    'Age': [25, 30, 35, 28, 40, 33],
    'City': ['New York', 'London', 'Paris', 'Tokyo', 'Berlin', 'Sydney'],
    'Website': ['pandasdataframe.com'] * 6
})

# Drop multiple rows by index
df_dropped = df.drop([1, 3, 5])

print("Original DataFrame:")
print(df)
print("\nDataFrame after dropping rows with indices 1, 3, and 5:")
print(df_dropped)
Output:
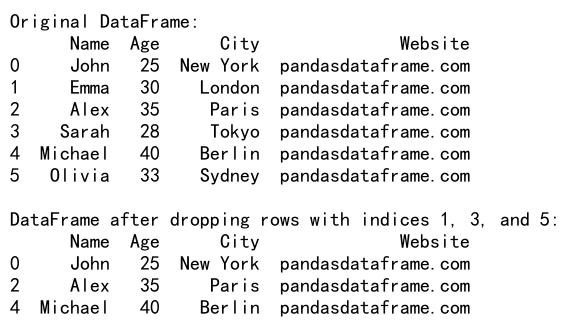
This example demonstrates how to drop multiple rows (with indices 1, 3, and 5) from the DataFrame in a single operation.
2.3 Dropping Rows Using Index Range
You can also drop a range of rows using the iloc indexer:
import pandas as pd

# Create a sample DataFrame
df = pd.DataFrame({
    'Name': ['John', 'Emma', 'Alex', 'Sarah', 'Michael', 'Olivia', 'Daniel', 'Sophia'],
    'Age': [25, 30, 35, 28, 40, 33, 37, 29],
    'City': ['New York', 'London', 'Paris', 'Tokyo', 'Berlin', 'Sydney', 'Madrid', 'Rome'],
    'Website': ['pandasdataframe.com'] * 8
})

# Drop rows using index range
df_dropped = df.drop(df.index[2:5])

print("Original DataFrame:")
print(df)
print("\nDataFrame after dropping rows with indices 2 to 4:")
print(df_dropped)
Output:
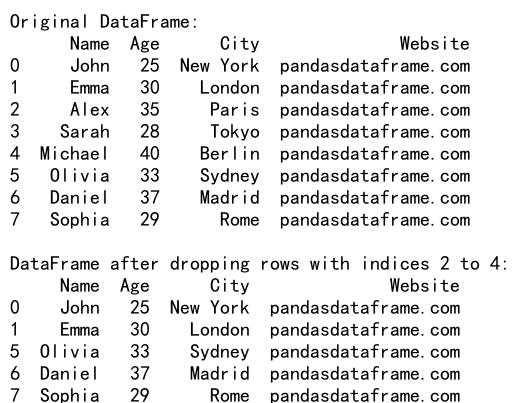
In this example, we use df.index[2:5] to select a range of indices (2, 3, and 4) and drop the corresponding rows from the DataFrame.
3. Dropping Rows Based on Conditions
Often, you’ll need to drop rows based on specific conditions rather than just their indices. Pandas provides powerful filtering capabilities to achieve this.
3.1 Dropping Rows Based on a Single Condition
Here’s an example of dropping rows based on a single condition:
import pandas as pd

# Create a sample DataFrame
df = pd.DataFrame({
    'Name': ['John', 'Emma', 'Alex', 'Sarah', 'Michael'],
    'Age': [25, 30, 35, 28, 40],
    'City': ['New York', 'London', 'Paris', 'Tokyo', 'Berlin'],
    'Website': ['pandasdataframe.com'] * 5
})

# Drop rows where Age is greater than 30
df_dropped = df[df['Age'] <= 30]

print("Original DataFrame:")
print(df)
print("\nDataFrame after dropping rows where Age > 30:")
print(df_dropped)
Output:
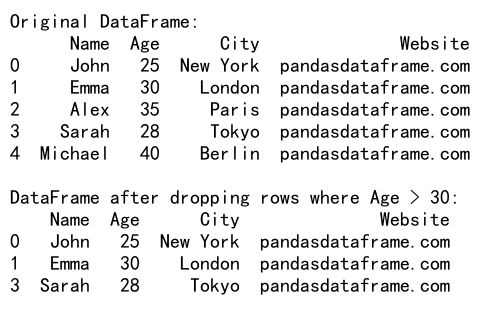
In this example, we create a new DataFrame that only includes rows where the ‘Age’ is less than or equal to 30, effectively dropping rows where ‘Age’ is greater than 30.
3.2 Dropping Rows Based on Multiple Conditions
You can combine multiple conditions using logical operators to drop rows:
import pandas as pd

# Create a sample DataFrame
df = pd.DataFrame({
    'Name': ['John', 'Emma', 'Alex', 'Sarah', 'Michael', 'Olivia'],
    'Age': [25, 30, 35, 28, 40, 33],
    'City': ['New York', 'London', 'Paris', 'Tokyo', 'Berlin', 'Sydney'],
    'Website': ['pandasdataframe.com'] * 6
})

# Drop rows based on multiple conditions
df_dropped = df[(df['Age'] <= 30) & (df['City'] != 'London')]

print("Original DataFrame:")
print(df)
print("\nDataFrame after dropping rows where Age > 30 or City is London:")
print(df_dropped)
Output:
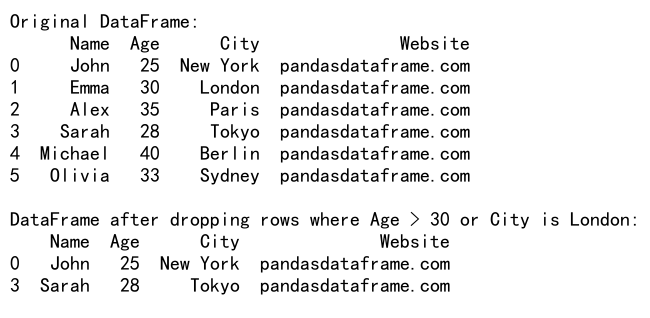
This example demonstrates how to drop rows based on multiple conditions: keeping only rows where ‘Age’ is less than or equal to 30 and ‘City’ is not ‘London’.
3.3 Dropping Rows with Missing Values
Pandas provides convenient methods to drop rows with missing values:
import pandas as pd
import numpy as np

# Create a sample DataFrame with missing values
df = pd.DataFrame({
    'Name': ['John', 'Emma', 'Alex', 'Sarah', 'Michael'],
    'Age': [25, np.nan, 35, 28, np.nan],
    'City': ['New York', 'London', np.nan, 'Tokyo', 'Berlin'],
    'Website': ['pandasdataframe.com'] * 5
})

# Drop rows with any missing values
df_dropped = df.dropna()

print("Original DataFrame:")
print(df)
print("\nDataFrame after dropping rows with any missing values:")
print(df_dropped)
Output:
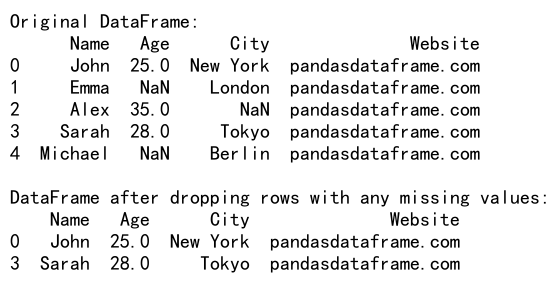
In this example, we use the dropna() method to remove any row that contains at least one missing value (NaN).
4. Inplace Operations
By default, the drop() and dropna() methods return a new DataFrame without modifying the original one. If you want to modify the original DataFrame, you can use the inplace=True parameter.
import pandas as pd

# Create a sample DataFrame
df = pd.DataFrame({
    'Name': ['John', 'Emma', 'Alex', 'Sarah', 'Michael'],
    'Age': [25, 30, 35, 28, 40],
    'City': ['New York', 'London', 'Paris', 'Tokyo', 'Berlin'],
    'Website': ['pandasdataframe.com'] * 5
})

print("Original DataFrame:")
print(df)

# Drop a row inplace
df.drop(2, inplace=True)

print("\nDataFrame after dropping row with index 2 (inplace):")
print(df)
Output:
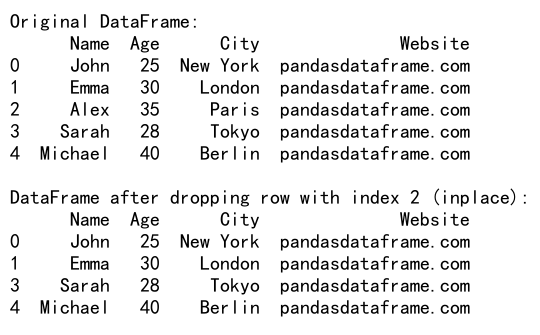
In this example, the drop() method modifies the original DataFrame directly instead of returning a new one.
5. Dropping Rows with Duplicate Values
Pandas provides the drop_duplicates() method to remove duplicate rows from a DataFrame:
import pandas as pd

# Create a sample DataFrame with duplicate rows
df = pd.DataFrame({
    'Name': ['John', 'Emma', 'Alex', 'John', 'Sarah', 'Emma'],
    'Age': [25, 30, 35, 25, 28, 30],
    'City': ['New York', 'London', 'Paris', 'New York', 'Tokyo', 'London'],
    'Website': ['pandasdataframe.com'] * 6
})

# Drop duplicate rows
df_dropped = df.drop_duplicates()

print("Original DataFrame:")
print(df)
print("\nDataFrame after dropping duplicate rows:")
print(df_dropped)
Output:
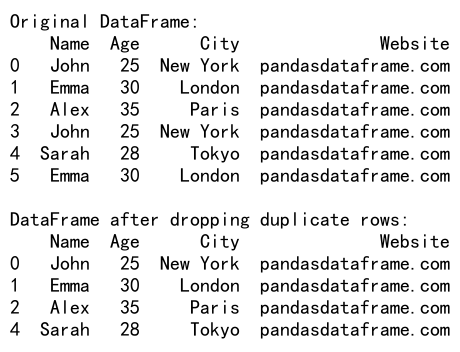
This example demonstrates how to remove duplicate rows from a DataFrame, keeping only the first occurrence of each unique row.
6. Dropping Rows Based on Index Labels
When working with labeled indices, you can drop rows based on their labels:
import pandas as pd

# Create a sample DataFrame with a labeled index
df = pd.DataFrame({
    'Name': ['John', 'Emma', 'Alex', 'Sarah', 'Michael'],
    'Age': [25, 30, 35, 28, 40],
    'City': ['New York', 'London', 'Paris', 'Tokyo', 'Berlin'],
    'Website': ['pandasdataframe.com'] * 5
}, index=['A', 'B', 'C', 'D', 'E'])

# Drop rows by label
df_dropped = df.drop(['B', 'D'])

print("Original DataFrame:")
print(df)
print("\nDataFrame after dropping rows with labels 'B' and 'D':")
print(df_dropped)
Output:
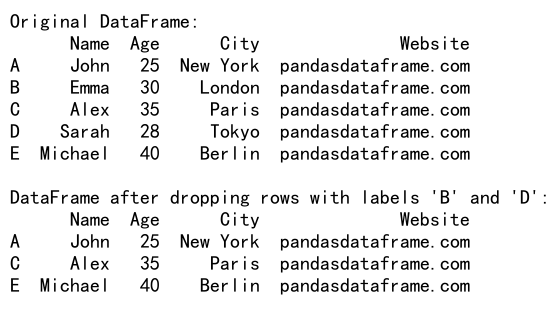
In this example, we create a DataFrame with a labeled index and then drop rows based on their labels (‘B’ and ‘D’).
7. Dropping Rows Based on Position
You can also drop rows based on their position using the iloc indexer:
import pandas as pd

# Create a sample DataFrame
df = pd.DataFrame({
    'Name': ['John', 'Emma', 'Alex', 'Sarah', 'Michael', 'Olivia'],
    'Age': [25, 30, 35, 28, 40, 33],
    'City': ['New York', 'London', 'Paris', 'Tokyo', 'Berlin', 'Sydney'],
    'Website': ['pandasdataframe.com'] * 6
})

# Drop rows based on position
df_dropped = df.iloc[1:5]

print("Original DataFrame:")
print(df)
print("\nDataFrame after keeping rows from position 1 to 4:")
print(df_dropped)
Output:
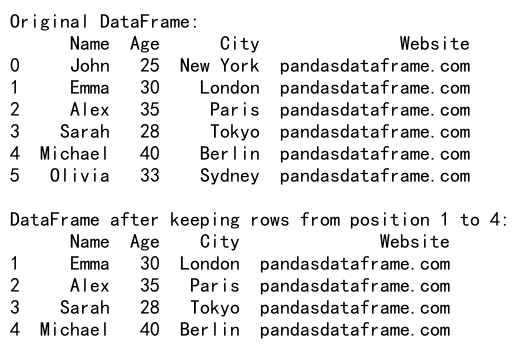
This example demonstrates how to keep only rows from position 1 to 4 (inclusive), effectively dropping the first and last rows.
8. Dropping Rows with Boolean Indexing
Boolean indexing is a powerful technique for filtering rows based on complex conditions:
import pandas as pd

# Create a sample DataFrame
df = pd.DataFrame({
    'Name': ['John', 'Emma', 'Alex', 'Sarah', 'Michael', 'Olivia'],
    'Age': [25, 30, 35, 28, 40, 33],
    'City': ['New York', 'London', 'Paris', 'Tokyo', 'Berlin', 'Sydney'],
    'Website': ['pandasdataframe.com'] * 6
})

# Create a boolean mask
mask = (df['Age'] > 30) | (df['City'] == 'London')

# Drop rows using boolean indexing
df_dropped = df[~mask]

print("Original DataFrame:")
print(df)
print("\nDataFrame after dropping rows where Age > 30 or City is London:")
print(df_dropped)
Output:
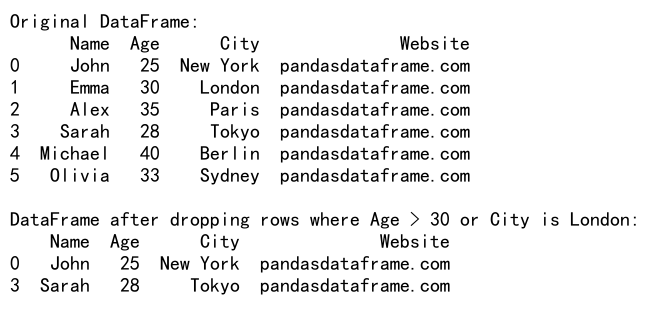
In this example, we create a boolean mask to identify rows where ‘Age’ is greater than 30 or ‘City’ is ‘London’, and then use the negation of this mask to keep only the rows that don’t meet these criteria.
9. Dropping Rows with Custom Functions
You can use custom functions with apply() to create complex filtering conditions:
import pandas as pd

# Create a sample DataFrame
df = pd.DataFrame({
    'Name': ['John', 'Emma', 'Alex', 'Sarah', 'Michael', 'Olivia'],
    'Age': [25, 30, 35, 28, 40, 33],
    'City': ['New York', 'London', 'Paris', 'Tokyo', 'Berlin', 'Sydney'],
    'Website': ['pandasdataframe.com'] * 6
})

# Define a custom function
def drop_condition(row):
    return row['Age'] > 30 or row['City'].startswith('L')

# Drop rows using the custom function
df_dropped = df[~df.apply(drop_condition, axis=1)]

print("Original DataFrame:")
print(df)
print("\nDataFrame after dropping rows based on custom function:")
print(df_dropped)
Output:
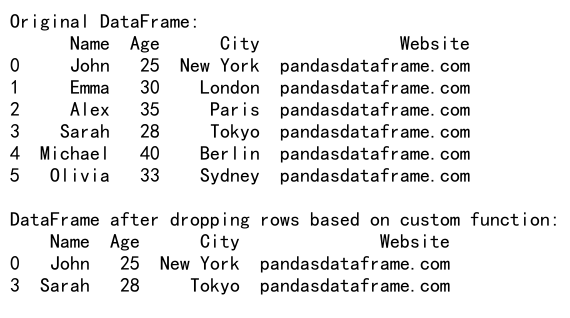
This example demonstrates how to use a custom function to create complex dropping conditions. The function checks if the ‘Age’ is greater than 30 or if the ‘City’ starts with ‘L’, and we drop rows that meet these criteria.
10. Handling Large Datasets
When working with large datasets, it’s important to consider memory usage and performance. Here are some tips for dropping rows efficiently in large DataFrames:
10.1 Using Query Method
For large DataFrames, the query() method can be more efficient than boolean indexing:
import pandas as pd
import numpy as np

# Create a large sample DataFrame
np.random.seed(0)
df = pd.DataFrame({
    'Name': [f'Person_{i}' for i in range(100000)],
    'Age': np.random.randint(18, 80, 100000),
    'City': np.random.choice(['New York', 'London', 'Paris', 'Tokyo', 'Berlin'], 100000),
    'Website': ['pandasdataframe.com'] * 100000
})

# Drop rows using query method
df_dropped = df.query('Age <= 30 and City != "London"')

print("Original DataFrame shape:", df.shape)
print("DataFrame shape after dropping rows:", df_dropped.shape)
print("\nFirst few rows of the dropped DataFrame:")
print(df_dropped.head())
Output:
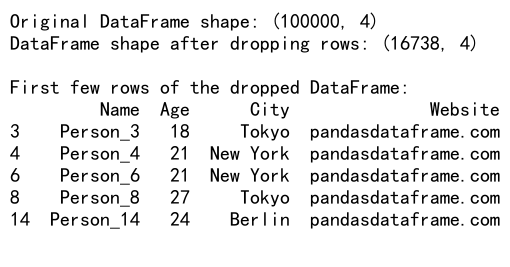
This example demonstrates how to use the query() method to efficiently drop rows in a large DataFrame based on multiple conditions.
11. Advanced Techniques for Dropping Rows
Let’s explore some more advanced techniques for dropping rows in Pandas.
11.1 Dropping Rows Based on Percentiles
Sometimes you might want to drop rows based on percentile values of a column. Here’s how you can do that:
import pandas as pd
import numpy as np

# Create a sample DataFrame
np.random.seed(0)
df = pd.DataFrame({
    'Name': [f'Person_{i}' for i in range(1000)],
    'Score': np.random.randint(0, 100, 1000),
    'City': np.random.choice(['New York', 'London', 'Paris', 'Tokyo', 'Berlin'], 1000),
    'Website': ['pandasdataframe.com'] * 1000
})

# Calculate the 10th and 90th percentiles
lower_percentile = df['Score'].quantile(0.1)
upper_percentile = df['Score'].quantile(0.9)

# Drop rows outside the 10th-90th percentile range
df_dropped = df[(df['Score'] >= lower_percentile) & (df['Score'] <= upper_percentile)]

print("Original DataFrame shape:", df.shape)
print("DataFrame shape after dropping rows:", df_dropped.shape)
print("\nScore range in the dropped DataFrame:")
print(f"Min: {df_dropped['Score'].min()}, Max: {df_dropped['Score'].max()}")
Output:
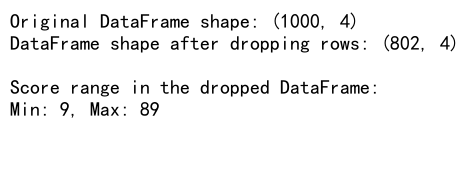
This example demonstrates how to drop rows that fall outside the 10th to 90th percentile range of the ‘Score’ column.
11.2 Dropping Rows Based on Z-Score
Another useful technique is to drop rows based on their Z-score, which can help identify and remove outliers:
import pandas as pd
import numpy as np
from scipy import stats

# Create a sample DataFrame
np.random.seed(0)
df = pd.DataFrame({
    'Name': [f'Person_{i}' for i in range(1000)],
    'Value': np.random.normal(100, 15, 1000),
    'Category': np.random.choice(['A', 'B', 'C'], 1000),
    'Website': ['pandasdataframe.com'] * 1000
})

# Calculate Z-scores
z_scores = np.abs(stats.zscore(df['Value']))

# Drop rows with Z-score > 3
df_dropped = df[z_scores < 3]

print("Original DataFrame shape:", df.shape)
print("DataFrame shape after dropping rows:", df_dropped.shape)
print("\nValue range in the original DataFrame:")
print(f"Min: {df['Value'].min()}, Max: {df['Value'].max()}")
print("Value range in the dropped DataFrame:")
print(f"Min: {df_dropped['Value'].min()}, Max: {df_dropped['Value'].max()}")
Output:
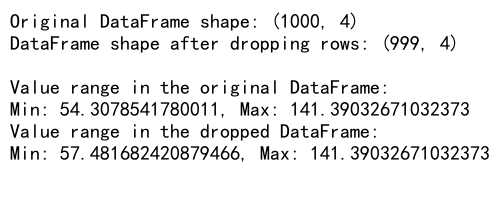
This example shows how to calculate Z-scores for the ‘Value’ column and drop rows where the absolute Z-score is greater than 3, effectively removing outliers.
11.3 Dropping Rows Based on Rolling Window Statistics
You can also drop rows based on rolling window statistics. This can be useful for time series data:
import pandas as pd
import numpy as np

# Create a sample time series DataFrame
np.random.seed(0)
dates = pd.date_range(start='2023-01-01', periods=100, freq='D')
df = pd.DataFrame({
    'Date': dates,
    'Value': np.random.normal(100, 15, 100),
    'Category': np.random.choice(['A', 'B', 'C'], 100),
    'Website': ['pandasdataframe.com'] * 100
})
df.set_index('Date', inplace=True)

# Calculate rolling mean and standard deviation
window_size = 7
df['RollingMean'] = df['Value'].rolling(window=window_size).mean()
df['RollingStd'] = df['Value'].rolling(window=window_size).std()

# Drop rows where the value is outside 2 standard deviations from the rolling mean
df_dropped = df[abs(df['Value'] - df['RollingMean']) <= 2 * df['RollingStd']]

print("Original DataFrame shape:", df.shape)
print("DataFrame shape after dropping rows:", df_dropped.shape)
print("\nFirst few rows of the dropped DataFrame:")
print(df_dropped.head())
Output:
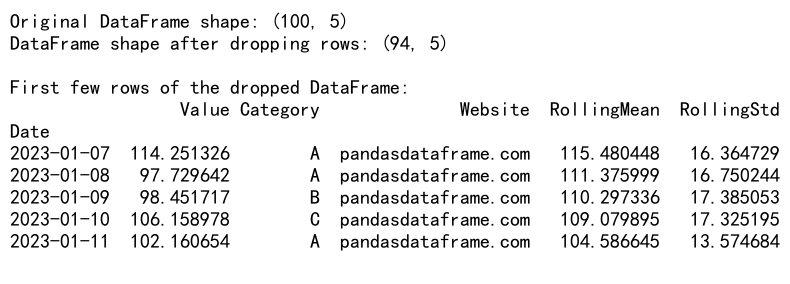
This example demonstrates how to drop rows in a time series DataFrame based on rolling window statistics, specifically removing values that are more than 2 standard deviations away from the 7-day rolling mean.
12. Handling Categorical Data When Dropping Rows
When working with categorical data, you might want to drop rows based on category frequencies or other criteria.
12.1 Dropping Rows with Rare Categories
import pandas as pd
import numpy as np

# Create a sample DataFrame with categorical data
np.random.seed(0)
df = pd.DataFrame({
    'Name': [f'Person_{i}' for i in range(1000)],
    'Category': np.random.choice(['A', 'B', 'C', 'D', 'E', 'F', 'G'], 1000, p=[0.3, 0.25, 0.2, 0.1, 0.05, 0.05, 0.05]),
    'Value': np.random.normal(100, 15, 1000),
    'Website': ['pandasdataframe.com'] * 1000
})

# Calculate category frequencies
category_freq = df['Category'].value_counts(normalize=True)

# Drop rows with categories that appear less than 10% of the time
df_dropped = df[df['Category'].isin(category_freq[category_freq >= 0.1].index)]

print("Original DataFrame shape:", df.shape)
print("DataFrame shape after dropping rows:", df_dropped.shape)
print("\nCategory distribution in the original DataFrame:")
print(df['Category'].value_counts(normalize=True))
print("\nCategory distribution in the dropped DataFrame:")
print(df_dropped['Category'].value_counts(normalize=True))
Output:
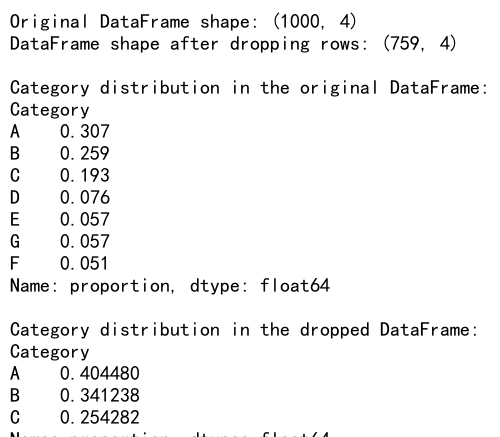
This example shows how to drop rows with categories that appear less frequently in the dataset, keeping only the more common categories.
13. Dropping Rows and Handling Data Integrity
When dropping rows, it’s important to consider the integrity of your data, especially if you have related information across multiple columns.
13.1 Dropping Rows While Maintaining Group Integrity
import pandas as pd
import numpy as np

# Create a sample DataFrame with grouped data
np.random.seed(0)
df = pd.DataFrame({
    'Group': np.repeat(['A', 'B', 'C', 'D'], 25),
    'SubGroup': np.tile(np.arange(1, 6), 20),
    'Value': np.random.normal(100, 15, 100),
    'Website': ['pandasdataframe.com'] * 100
})

print("Original DataFrame:")
print(df.head(10))

# Calculate group means
group_means = df.groupby('Group')['Value'].transform('mean')

# Drop rows where the value is more than 2 standard deviations from the group mean
df_dropped = df[abs(df['Value'] - group_means) <= 2 * df.groupby('Group')['Value'].transform('std')]

print("\nDataFrame after dropping rows:")
print(df_dropped.head(10))

print("\nOriginal group sizes:")
print(df['Group'].value_counts())
print("\nNew group sizes:")
print(df_dropped['Group'].value_counts())
Output:
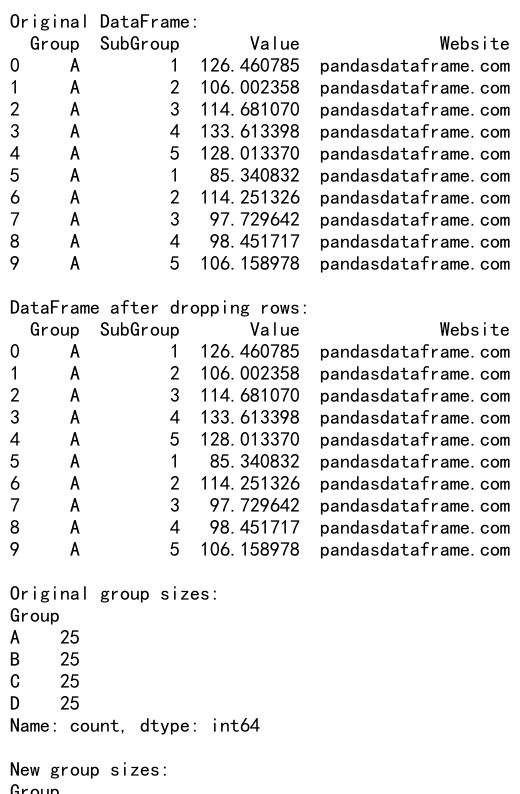
This example shows how to drop rows based on group-specific criteria, maintaining the integrity of the group structure in the data.
14. Dropping Rows and Handling Time Series Data
When working with time series data, you might need to drop rows while considering the temporal nature of the data.
14.1 Dropping Rows in Time Series Data
import pandas as pd
import numpy as np

# Create a sample time series DataFrame
np.random.seed(0)
dates = pd.date_range(start='2023-01-01', periods=100, freq='D')
df = pd.DataFrame({
    'Date': dates,
    'Value': np.random.normal(100, 15, 100),
    'Category': np.random.choice(['A', 'B', 'C'], 100),
    'Website': ['pandasdataframe.com'] * 100
})
df.set_index('Date', inplace=True)

print("Original DataFrame:")
print(df.head())

# Drop weekends
df_dropped = df[df.index.dayofweek < 5]

print("\nDataFrame after dropping weekends:")
print(df_dropped.head())

# Drop rows based on a specific date range
start_date = '2023-02-01'
end_date = '2023-02-28'
df_dropped_range = df.drop(df.loc[start_date:end_date].index)

print("\nDataFrame after dropping rows in February:")
print(df_dropped_range.head())
Output:
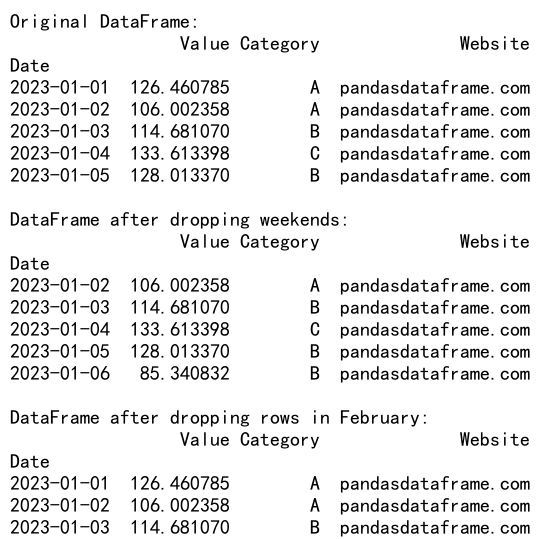
This example demonstrates how to drop rows in time series data based on day of the week and specific date ranges.
Pandas Drop Row Conclusion
Dropping rows in Pandas is a versatile and powerful operation that can be applied in various ways to clean, preprocess, and analyze data. We’ve covered a wide range of techniques, from basic index-based dropping to advanced methods involving statistical measures, categorical data, multi-index DataFrames, and time series data.
Key takeaways from this comprehensive guide include:
- Understanding the different methods for dropping rows, such as
drop(), boolean indexing, anddropna(). - Applying conditions and custom functions to selectively drop rows.
- Handling large datasets efficiently using chunking and the
query()method. - Dropping rows based on statistical measures like percentiles and Z-scores.
- Managing categorical data and maintaining data integrity when dropping rows.
- Working with multi-index DataFrames and time series data.
By mastering these techniques, you’ll be well-equipped to handle a wide variety of data cleaning and preprocessing tasks in your data analysis projects. Remember to always consider the impact of dropping rows on your analysis and to document your data cleaning steps for reproducibility.
As you continue to work with Pandas, you’ll likely discover even more nuanced ways to apply these techniques to your specific data challenges. The flexibility and power of Pandas make it an invaluable tool for data scientists and analysts working with structured data in Python.
 Pandas Dataframe