Pandas Cut Bin
In this article, we will explore the pandas.cut function, which is used to segment and sort data values into bins or intervals. This is especially useful for converting continuous numerical data into categorical data, which can be beneficial for analysis and visualization purposes. We’ll cover the following aspects of pandas.cut:
- Introduction to
pandas.cut - Basic Usage of
pandas.cut - Creating Custom Bins
- Labeling Bins
- Handling Outliers with Bins
- Creating Equal-Width Bins
- Creating Equal-Frequency Bins
- Binning Based on Quantiles
- Integration with DataFrames
- Practical Examples
Let’s dive into each section and provide detailed code examples and explanations.
Introduction to pandas.cut
pandas.cut is a powerful function that allows us to bin data into discrete intervals. This can be particularly useful for statistical analysis and visualization, enabling us to categorize continuous data into manageable segments. Here’s a basic introduction:
import pandas as pd

data = pd.Series([1, 7, 5, 4, 6, 3, 8, 9, 2, 10])
bins = pd.cut(data, bins=3)
print(bins)
Output:

Explanation:
- Series: We create a
pandas.Serieswith sample data. - Cut Function: The
pd.cutfunction is used to bin the data into 3 intervals. - Output: This will print the bins each data point falls into.
Basic Usage of pandas.cut
Let’s start with the basic usage of pandas.cut. We’ll bin a simple array of numbers into specified intervals.
import pandas as pd

data = pd.Series([1, 2, 3, 4, 5, 6, 7, 8, 9, 10])
bins = [0, 3, 6, 10]
binned_data = pd.cut(data, bins)
print(binned_data)
Output:
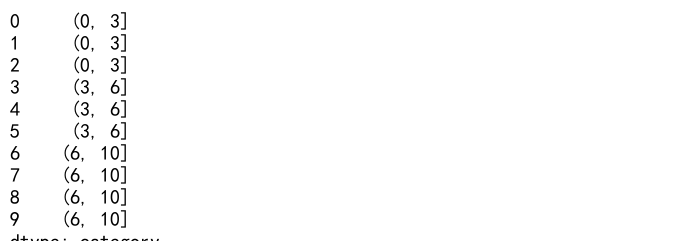
Explanation:
- Series: We create a
pandas.Serieswith data from 1 to 10. - Bins: We define bins with intervals
[0, 3, 6, 10]. - Cut Function: We use
pd.cutto bin the data according to the specified bins. - Output: This will print which interval each data point belongs to.
Creating Custom Bins
We can create custom bins by defining the exact intervals we want to use for binning the data.
import pandas as pd

data = pd.Series([1, 15, 25, 35, 45, 55, 65, 75, 85, 95])
bins = [0, 20, 40, 60, 80, 100]
binned_data = pd.cut(data, bins)
print(binned_data)
Output:

Explanation:
- Series: We create a
pandas.Serieswith data points ranging from 1 to 95. - Bins: We define custom bins with intervals
[0, 20, 40, 60, 80, 100]. - Cut Function: We use
pd.cutto categorize the data into these bins. - Output: This will print the bin each data point falls into.
Labeling Bins
pandas.cut allows us to label the bins for better readability and analysis.
import pandas as pd

data = pd.Series([5, 15, 25, 35, 45, 55, 65, 75, 85, 95])
bins = [0, 20, 40, 60, 80, 100]
labels = ['Very Low', 'Low', 'Medium', 'High', 'Very High']
binned_data = pd.cut(data, bins, labels=labels)
print(binned_data)
Output:

Explanation:
- Series: We create a
pandas.Serieswith data points from 5 to 95. - Bins: We define bins
[0, 20, 40, 60, 80, 100]. - Labels: We assign labels to each bin for better clarity.
- Cut Function: We use
pd.cutwith thelabelsparameter. - Output: This will print the labeled bins for each data point.
Handling Outliers with Bins
Sometimes data points may fall outside the specified bins. We can handle these outliers using the right parameter.
import pandas as pd

data = pd.Series([5, 15, 25, 35, 45, 55, 65, 75, 85, 105])
bins = [0, 20, 40, 60, 80, 100]
binned_data = pd.cut(data, bins, right=False)
print(binned_data)
Output:

Explanation:
- Series: We create a
pandas.Serieswith data points from 5 to 105. - Bins: We define bins
[0, 20, 40, 60, 80, 100]. - Right Parameter: By setting
right=False, we make intervals closed on the left. - Cut Function: We use
pd.cutwith therightparameter. - Output: This will print the bins, handling outliers by excluding the rightmost bin’s upper boundary.
Creating Equal-Width Bins
Equal-width bins divide the data range into equal-sized intervals.
import pandas as pd

data = pd.Series([1, 3, 5, 7, 9, 11, 13, 15, 17, 19])
binned_data = pd.cut(data, bins=4)
print(binned_data)
Output:

Explanation:
- Series: We create a
pandas.Serieswith data points from 1 to 19. - Bins: We specify
bins=4to create 4 equal-width bins. - Cut Function: We use
pd.cutto bin the data into equal intervals. - Output: This will print the equal-width bins each data point falls into.
Creating Equal-Frequency Bins
Equal-frequency bins ensure each bin has the same number of data points.
import pandas as pd

data = pd.Series([1, 2, 2, 3, 3, 3, 4, 4, 5, 6])
binned_data = pd.qcut(data, q=4)
print(binned_data)
Output:

Explanation:
- Series: We create a
pandas.Serieswith data points. - Q-Cut Function: We use
pd.qcutwithq=4to create 4 equal-frequency bins. - Output: This will print the equal-frequency bins each data point falls into.
Binning Based on Quantiles
We can also bin data based on quantiles.
import pandas as pd

data = pd.Series([1, 2, 2, 3, 3, 3, 4, 4, 5, 6])
quantiles = [0, 0.25, 0.5, 0.75, 1.0]
binned_data = pd.qcut(data, q=quantiles)
print(binned_data)
Output:

Explanation:
- Series: We create a
pandas.Serieswith data points. - Quantiles: We define quantiles
[0, 0.25, 0.5, 0.75, 1.0]. - Q-Cut Function: We use
pd.qcutwith the specified quantiles. - Output: This will print the bins based on quantiles for each data point.
Integration with DataFrames
pandas.cut can be integrated with DataFrames to bin data in columns.
import pandas as pd

data = {'Values': [1, 7, 5, 4, 6, 3, 8, 9, 2, 10]}
df = pd.DataFrame(data)
bins = [0, 3, 6, 10]
df['Binned'] = pd.cut(df['Values'], bins)
print(df)
Output:
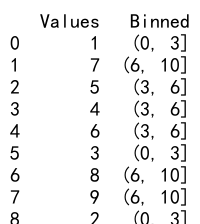
Explanation:
- DataFrame: We create a
pandas.DataFramewith a column ‘Values’. - Bins: We define bins
[0, 3, 6, 10]. - Cut Function: We use
pd.cutto bin the ‘Values’ column. - Output: This will print the DataFrame with a new column ‘Binned’ showing the bins.
Practical Examples
Let’s go through some practical examples to solidify our understanding of pandas.cut.
Example 1: Binning Age Data
import pandas as pd

ages = pd.Series([25, 35, 45, 55, 65, 75, 85])
bins = [0, 30, 50, 70, 100]
labels = ['Young', 'Middle-Aged', 'Senior', 'Elderly']
age_bins = pd.cut(ages, bins, labels=labels)
print(age_bins)
Output:

Explanation:
- Series: We create a
pandas.Serieswith age data. - Bins and Labels: We define bins and corresponding labels.
- Cut Function: We use
pd.cutto bin the age data. - Output: This will print the age categories.
Example 2: Binning Salary Data
import pandas as pd

salaries = pd.Series([2500, 4000, 6000, 8000, 12000, 15000, 20000])
bins = [0, 5000, 10000, 20000]
labels = ['Low', 'Medium', 'High']
salary_bins = pd.cut(salaries, bins, labels=labels)
print(salary_bins)
Output:
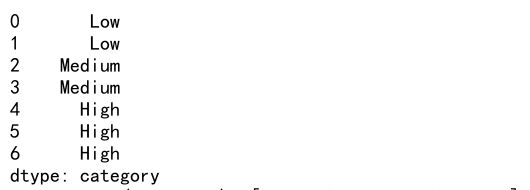
Explanation:
- Series: We create a
pandas.Serieswith salary data. - Bins and Labels: We define bins and corresponding labels.
- Cut Function: We use
pd.cutto bin the salary data. - Output: This will print the salary categories.
Example 3: Binning Temperature Data
import pandas as pd

temperatures = pd.Series([-10, 0, 10, 20, 30, 40, 50])
bins = [-20, 0, 10, 20, 30, 40, 60]
labels = ['Freezing', 'Cold', 'Cool', 'Warm', 'Hot', 'Very Hot']
temp_bins = pd.cut(temperatures, bins, labels=labels)
print(temp_bins)
Output:

Explanation:
- Series: We create a
pandas.Serieswith temperature data. - Bins and Labels: We define bins and corresponding labels.
- Cut Function: We use
pd.cutto bin the temperature data. - Output: This will print the temperature categories.
Example 4: Binning Exam Scores
import pandas as pd

scores = pd.Series([55, 65, 75, 85, 95])
bins = [0, 60, 70, 80, 90, 100]
labels = ['F', 'D', 'C', 'B', 'A']
score_bins = pd.cut(scores, bins, labels=labels)
print(score_bins)
Output:

Explanation:
- Series: We create a
pandas.Serieswith exam scores. - Bins and Labels: We define bins and corresponding labels.
- Cut Function: We use
pd.cutto bin the scores. - Output: This will print the grade categories.
Example 5: Binning Weight Data
import pandas as pd

weights = pd.Series([50, 60, 70, 80, 90, 100, 110])
bins = [40, 60, 80, 100, 120]
labels = ['Underweight', 'Normal', 'Overweight', 'Obese']
weight_bins = pd.cut(weights, bins, labels=labels)
print(weight_bins)
Output:

Explanation:
- Series: We create a
pandas.Serieswith weight data. - Bins and Labels: We define bins and corresponding labels.
- Cut Function: We use
pd.cutto bin the weight data. - Output: This will print the weight categories.
Example 6: Binning Height Data
import pandas as pd

heights = pd.Series([150, 160, 170, 180, 190, 200])
bins = [140, 160, 180, 200]
labels = ['Short', 'Average', 'Tall']
height_bins = pd.cut(heights, bins, labels=labels)
print(height_bins)
Output:

Explanation:
- Series: We create a
pandas.Serieswith height data. - Bins and Labels: We define bins and corresponding labels.
- Cut Function: We use
pd.cutto bin the height data. - Output: This will print the height categories.
Example 7: Binning Speed Data
import pandas as pd

speeds = pd.Series([30, 40, 50, 60, 70, 80, 90])
bins = [20, 40, 60, 80, 100]
labels = ['Slow', 'Moderate', 'Fast', 'Very Fast']
speed_bins = pd.cut(speeds, bins, labels=labels)
print(speed_bins)
Output:

Explanation:
- Series: We create a
pandas.Serieswith speed data. - Bins and Labels: We define bins and corresponding labels.
- Cut Function: We use
pd.cutto bin the speed data. - Output: This will print the speed categories.
Example 8: Binning Income Data
import pandas as pd

incomes = pd.Series([2000, 3000, 4000, 5000, 6000, 7000, 8000])
bins = [1000, 3000, 5000, 7000, 9000]
labels = ['Low Income', 'Middle Income', 'High Income', 'Very High Income']
income_bins = pd.cut(incomes, bins, labels=labels)
print(income_bins)
Output:

Explanation:
- Series: We create a
pandas.Serieswith income data. - Bins and Labels: We define bins and corresponding labels.
- Cut Function: We use
pd.cutto bin the income data. - Output: This will print the income categories.
Example 9: Binning Distance Data
import pandas as pd

distances = pd.Series([5, 15, 25, 35, 45, 55, 65])
bins = [0, 20, 40, 60, 80]
labels = ['Very Close', 'Close', 'Far', 'Very Far']
distance_bins = pd.cut(distances, bins, labels=labels)
print(distance_bins)
Output:

Explanation:
- Series: We create a
pandas.Serieswith distance data. - Bins and Labels: We define bins and corresponding labels.
- Cut Function: We use
pd.cutto bin the distance data. - Output: This will print the distance categories.
Example 10: Binning Monthly Revenue
import pandas as pd

revenue = pd.Series([2000, 4000, 6000, 8000, 10000, 12000, 14000])
bins = [0, 3000, 6000, 9000, 15000]
labels = ['Low', 'Moderate', 'High', 'Very High']
revenue_bins = pd.cut(revenue, bins, labels=labels)
print(revenue_bins)
Output:

Explanation:
- Series: We create a
pandas.Serieswith monthly revenue. - Bins and Labels: We define bins and corresponding labels.
- Cut Function: We use
pd.cutto bin the revenue with labels. - Output: This will print the labeled revenue bins.
Example 11: Binning Speed Data
import pandas as pd

speeds = pd.Series([30, 50, 70, 90, 110, 130, 150])
bins = [0, 60, 120, 180]
labels = ['Slow', 'Average', 'Fast']
speed_bins = pd.cut(speeds, bins, labels=labels)
print(speed_bins)
Output:
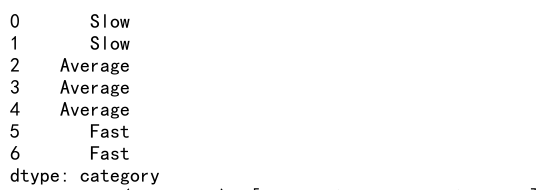
Explanation:
- Series: We create a
pandas.Serieswith speed data. - Bins and Labels: We define bins and corresponding labels.
- Cut Function: We use
pd.cutto bin the speeds with labels. - Output: This will print the labeled speed bins.
Example 12: Binning Energy Consumption
import pandas as pd

energy = pd.Series([100, 200, 300, 400, 500, 600, 700])
bins = [0, 250, 500, 750]
labels = ['Low', 'Moderate', 'High']
energy_bins = pd.cut(energy, bins, labels=labels)
print(energy_bins)
Output:
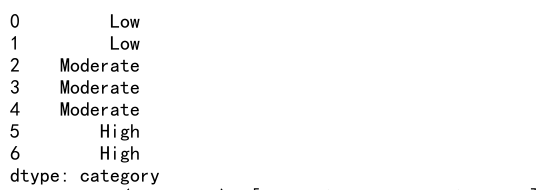
Explanation:
- Series: We create a
pandas.Serieswith energy consumption data. - Bins and Labels: We define bins and corresponding labels.
- Cut Function: We use
pd.cutto bin the energy consumption with labels. - Output: This will print the labeled energy consumption bins.
Example 13: Binning Profit Data
import pandas as pd

profits = pd.Series([10000, 20000, 30000, 40000, 50000, 60000, 70000])
bins = [0, 25000, 50000, 75000]
labels = ['Low', 'Moderate', 'High']
profit_bins = pd.cut(profits, bins, labels=labels)
print(profit_bins)
Output:
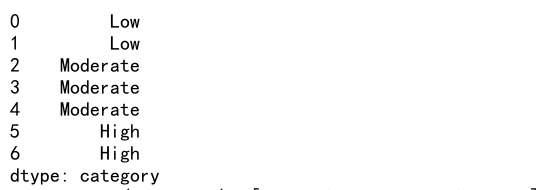
Explanation:
- Series: We create a
pandas.Serieswith profit data. - Bins and Labels: We define bins and corresponding labels.
- Cut Function: We use
pd.cutto bin the profits with labels. - Output: This will print the labeled profit bins.
 Pandas Dataframe