Pandas fillna
Pandas is a powerful data manipulation library in Python, and one of its most useful features is the ability to handle missing data. The fillna() method is a crucial tool for dealing with null values in pandas DataFrames and Series. This comprehensive guide will explore the various aspects of fillna(), its parameters, and how to use it effectively in different scenarios.
Introduction to Missing Data in Pandas
Before diving into the fillna() method, it’s essential to understand how pandas represents missing data. In pandas, missing data is typically denoted by the NaN (Not a Number) value, which is part of the NumPy library. However, pandas can also recognize other forms of missing data, such as None or NaT (Not a Time) for datetime data types.
Missing data can occur for various reasons, such as data collection errors, incomplete records, or intentional omissions. Regardless of the cause, handling missing data is crucial for accurate data analysis and machine learning tasks.
Basic Usage of fillna()
The fillna() method is used to replace missing values in a DataFrame or Series with specified values. Let’s start with a simple example to demonstrate its basic usage:
import pandas as pd
import numpy as np

# Create a sample DataFrame with missing values
df = pd.DataFrame({
    'A': [1, 2, np.nan, 4, 5],
    'B': [np.nan, 2, 3, np.nan, 5],
    'C': [1, 2, 3, 4, np.nan]
})

# Fill all NaN values with 0
filled_df = df.fillna(0)

print("Original DataFrame:")
print(df)
print("\nDataFrame after filling NaN values with 0:")
print(filled_df)
Output:
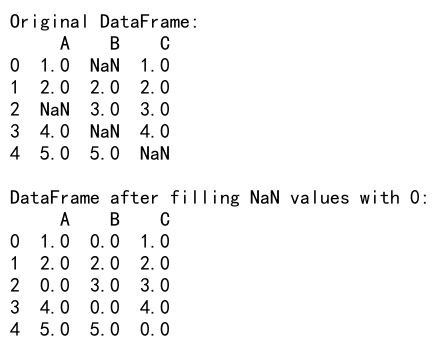
In this example, we create a DataFrame with some NaN values and use fillna(0) to replace all missing values with 0. The fillna() method returns a new DataFrame with the filled values, leaving the original DataFrame unchanged.
Filling with a Specific Value
You can fill missing values with any specific value, not just 0. This is useful when you have domain knowledge about what the missing values should represent:
import pandas as pd
import numpy as np

# Create a sample DataFrame
df = pd.DataFrame({
    'temperature': [25, np.nan, 28, np.nan, 30],
    'humidity': [60, 65, np.nan, 70, 75]
})

# Fill missing values with the mean of each column
filled_df = df.fillna({
    'temperature': df['temperature'].mean(),
    'humidity': df['humidity'].mean()
})

print("Original DataFrame:")
print(df)
print("\nDataFrame after filling NaN values with column means:")
print(filled_df)
Output:
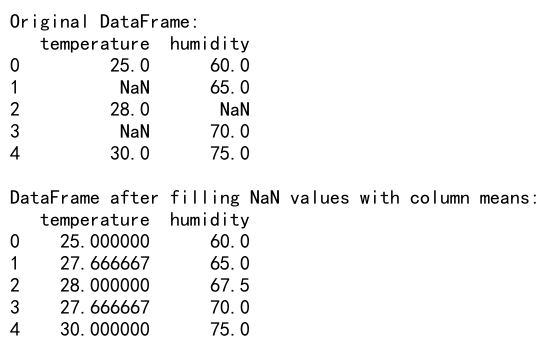
In this example, we fill missing temperature values with the mean temperature and missing humidity values with the mean humidity. This approach is often used when dealing with numerical data where the mean is a reasonable estimate for missing values.
Filling with a Function
The fillna() method also accepts a function as an argument, allowing for more complex filling logic:
import pandas as pd
import numpy as np

# Create a sample DataFrame
df = pd.DataFrame({
    'A': [1, 2, np.nan, 4, 5],
    'B': [np.nan, 20, 30, np.nan, 50]
})

# Define a custom fill function
def custom_fill(column):
    return column.fillna(column.mean() * 2)

# Apply the custom fill function
filled_df = df.fillna(custom_fill)

print("Original DataFrame:")
print(df)
print("\nDataFrame after filling with custom function:")
print(filled_df)
Output:
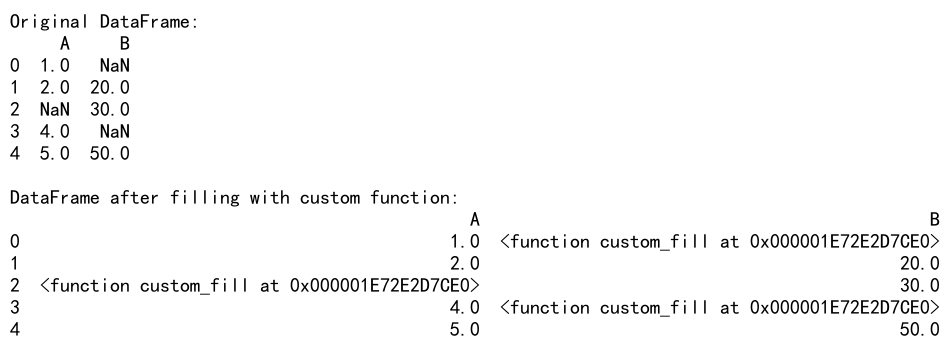
In this example, we define a custom function custom_fill that fills missing values with twice the mean of the column. This demonstrates how you can implement more sophisticated filling logic based on your specific requirements.
Filling Based on Other Columns
Sometimes, you may want to fill missing values in one column based on the values in another column. Here’s an example of how to do this:
import pandas as pd
import numpy as np

# Create a sample DataFrame
df = pd.DataFrame({
    'category': ['A', 'B', 'A', 'C', 'B', 'C'],
    'value': [10, np.nan, 15, np.nan, 25, 30]
})

# Fill missing values based on category mean
df['value'] = df.groupby('category')['value'].transform(lambda x: x.fillna(x.mean()))

print("Original DataFrame:")
print(df)
print("\nDataFrame after filling based on category mean:")
print(df)
Output:
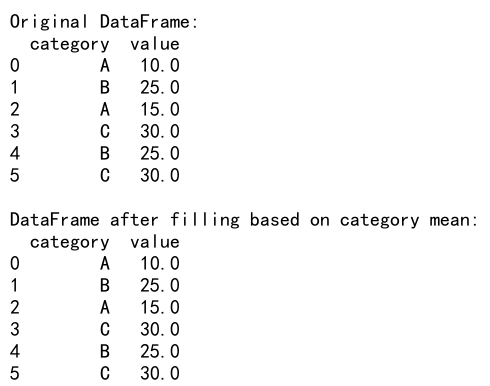
In this example, we fill missing values in the ‘value’ column with the mean value for each category. This is particularly useful when you have categorical data and want to fill missing values based on the category statistics.
Interpolation
Pandas fillna() can also perform interpolation to fill missing values:
import pandas as pd
import numpy as np

# Create a sample DataFrame
df = pd.DataFrame({
    'A': [1, np.nan, np.nan, 4, 5],
    'B': [10, 20, np.nan, np.nan, 50]
})

# Fill using linear interpolation
interpolated_df = df.interpolate(method='linear')

print("Original DataFrame:")
print(df)
print("\nDataFrame after linear interpolation:")
print(interpolated_df)
Output:
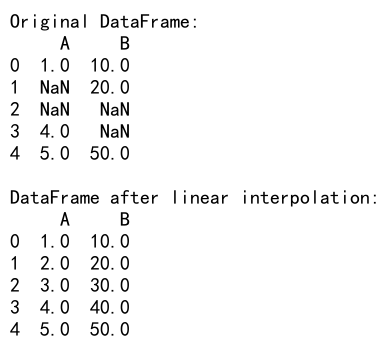
This example uses linear interpolation to fill missing values. Interpolation can be particularly useful for time series data or when you want to estimate missing values based on surrounding data points.
Filling with Rolling Statistics
You can use rolling statistics to fill missing values based on a window of surrounding data:
import pandas as pd
import numpy as np

# Create a sample DataFrame
df = pd.DataFrame({
    'date': pd.date_range(start='2023-01-01', periods=10),
    'value': [10, 15, np.nan, 20, 25, np.nan, 30, 35, np.nan, 40]
}).set_index('date')

# Fill NaN values with 3-day rolling mean
df['filled_value'] = df['value'].fillna(df['value'].rolling(window=3, min_periods=1).mean())

print("Original DataFrame:")
print(df)
print("\nDataFrame after filling with 3-day rolling mean:")
print(df)
Output:
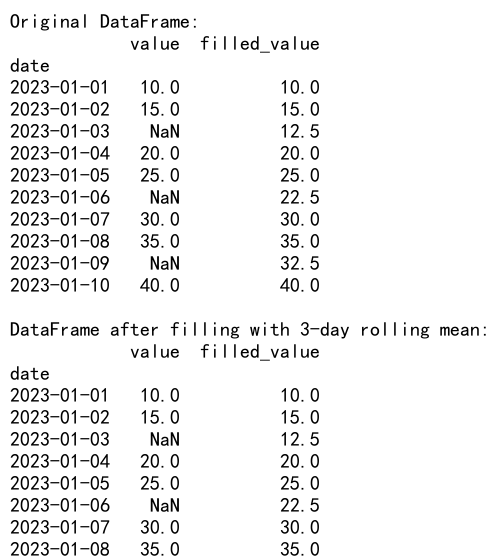
In this example, we fill missing values with the 3-day rolling mean. This approach can be useful for time series data where you want to consider recent trends when filling missing values.
Filling with Conditional Logic
Sometimes, you might want to fill missing values based on certain conditions. Here’s an example of how to do this:
import pandas as pd
import numpy as np

# Create a sample DataFrame
df = pd.DataFrame({
    'A': [1, np.nan, 3, np.nan, 5],
    'B': [10, 20, np.nan, 40, 50],
    'C': ['x', 'y', 'z', 'x', 'y']
})

# Fill NaN values in column A based on conditions
df['A'] = df['A'].fillna(df.apply(lambda row: row['B'] / 10 if row['C'] == 'x' else row['B'] / 5, axis=1))

print("Original DataFrame:")
print(df)
print("\nDataFrame after conditional filling:")
print(df)
Output:
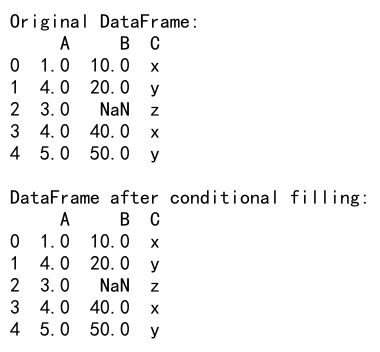
In this example, we fill missing values in column A based on the values in columns B and C. This demonstrates how you can implement complex filling logic based on multiple conditions and columns.
Filling with External Data
In some cases, you might want to fill missing values with data from an external source. Here’s an example of how you could do this:
import pandas as pd
import numpy as np

# Create a sample DataFrame with missing values
df = pd.DataFrame({
    'date': pd.date_range(start='2023-01-01', periods=5),
    'value': [100, np.nan, 150, np.nan, 200]
}).set_index('date')

# Create an external data source
external_data = pd.DataFrame({
    'date': pd.date_range(start='2023-01-01', periods=5),
    'external_value': [110, 120, 130, 140, 150]
}).set_index('date')

# Fill missing values with external data where available
df['filled_value'] = df['value'].fillna(external_data['external_value'])

print("Original DataFrame:")
print(df)
print("\nExternal Data:")
print(external_data)
print("\nDataFrame after filling with external data:")
print(df)
Output:
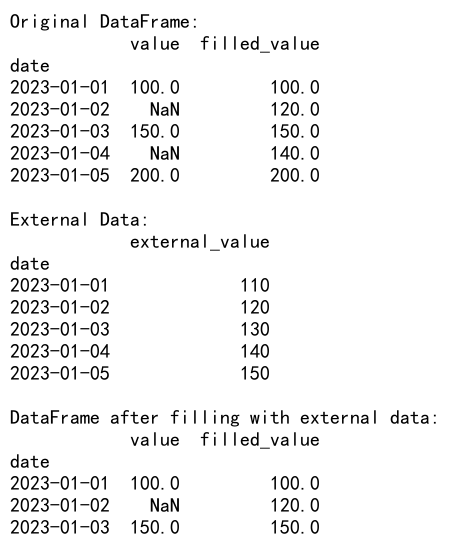
This example demonstrates how to fill missing values using data from an external source. This can be useful when you have additional data that can provide reasonable estimates for the missing values.
Handling Missing Values in Categorical Data
When dealing with categorical data, you might want to treat missing values differently. Here’s an example of how to handle missing values in categorical columns:
import pandas as pd
import numpy as np

# Create a sample DataFrame with categorical data
df = pd.DataFrame({
    'category': pd.Categorical(['A', 'B', np.nan, 'A', 'C']),
    'value': [1, 2, 3, 4, 5]
})

# Fill missing categories with a new category 'Unknown'
df['category'] = df['category'].cat.add_categories('Unknown').fillna('Unknown')

print("Original DataFrame:")
print(df)
print("\nDataFrame after filling missing categories:")
print(df)
Output:
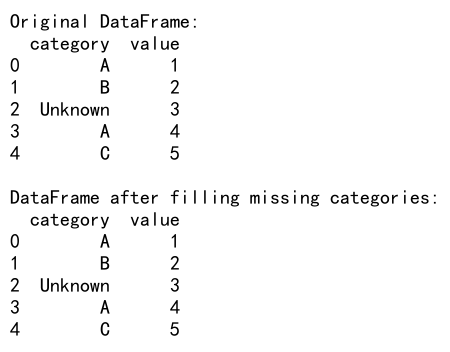
In this example, we add a new category ‘Unknown’ to the categorical column and then fill the missing values with this new category. This approach is often used when you want to explicitly identify missing categorical values rather than imputing them.
Filling Missing Values in a DataFrame with a Series
You can also use a Series to fill missing values in a DataFrame. This can be useful when you have a separate Series of values that you want to use for filling:
import pandas as pd
import numpy as np

# Create a sample DataFrame
df = pd.DataFrame({
    'A': [1, np.nan, 3, np.nan, 5],
    'B': [np.nan, 2, np.nan, 4, 5],
    'C': [1, 2, 3, 4, np.nan]
})

# Create a Series to use for filling
fill_series = pd.Series([10, 20, 30], index=['A', 'B', 'C'])

# Fill missing values using the Series
filled_df = df.fillna(fill_series)

print("Original DataFrame:")
print(df)
print("\nFill Series:")
print(fill_series)
print("\nDataFrame after filling with Series:")
print(filled_df)
Output:
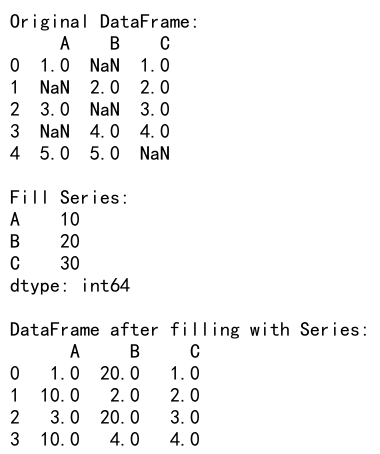
In this example, we create a Series with values for each column and use it to fill missing values in the DataFrame. This can be particularly useful when you have different fill values for different columns.
Pandas fillna Conclusion
The fillna() method in pandas is a versatile tool for handling missing data in DataFrames and Series. It offers a wide range of options for filling missing values, from simple constant values to complex conditional logic and external data sources. By understanding and effectively using fillna(), you can significantly improve the quality and completeness of your data, leading to more accurate analyses and machine learning models.
Remember that the choice of how to fill missing values should be guided by your understanding of the data and the specific requirements of your analysis or model. Always consider the potential impact of your chosen filling method on your results, and when in doubt, it’s often
 Pandas Dataframe