Pandas Drop Column Axis
Pandas is a powerful data manipulation library in Python that provides efficient and flexible data structures for working with structured data. One of the most common operations in data analysis is removing unwanted columns from a DataFrame. In this comprehensive guide, we’ll explore the various methods and techniques for dropping columns in Pandas, with a focus on the axis parameter and its implications.
Understanding the Basics of Dropping Columns
Before we dive into the specifics of dropping columns using the axis parameter, let’s start with the basics of column removal in Pandas.
The primary method for dropping columns in Pandas is the drop() function. This versatile function can be used to remove both rows and columns from a DataFrame. When dropping columns, we typically use the axis parameter to specify that we want to operate on columns rather than rows.
Here’s a simple example to illustrate the basic usage of drop() for removing a column:
import pandas as pd

# Create a sample DataFrame
df = pd.DataFrame({
    'A': [1, 2, 3],
    'B': [4, 5, 6],
    'C': [7, 8, 9],
    'D': [10, 11, 12]
})

# Drop column 'B'
df_dropped = df.drop('B', axis=1)

print("Original DataFrame:")
print(df)
print("\nDataFrame after dropping column 'B':")
print(df_dropped)
Output:
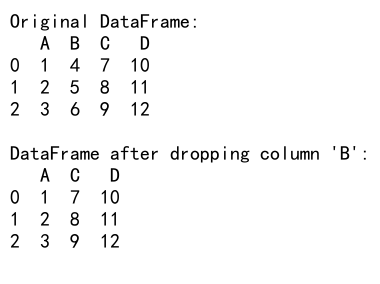
In this example, we create a simple DataFrame with four columns (A, B, C, and D) and use the drop() function to remove column ‘B’. The axis=1 parameter tells Pandas to operate on columns (axis 1) rather than rows (axis 0).
Dropping Multiple Columns
Often, you’ll need to drop multiple columns at once. Pandas makes this easy by allowing you to pass a list of column names to the drop() function. Here’s an example:
import pandas as pd

# Create a sample DataFrame
df = pd.DataFrame({
    'A': [1, 2, 3],
    'B': [4, 5, 6],
    'C': [7, 8, 9],
    'D': [10, 11, 12],
    'E': [13, 14, 15]
})

# Drop multiple columns
df_dropped = df.drop(['B', 'D'], axis=1)

print("Original DataFrame:")
print(df)
print("\nDataFrame after dropping columns 'B' and 'D':")
print(df_dropped)
Output:
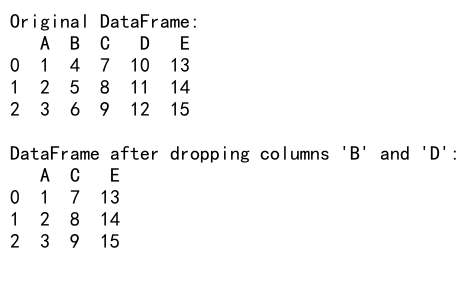
In this example, we drop columns ‘B’ and ‘D’ simultaneously by passing a list of column names to the drop() function.
Inplace Parameter: Modifying the Original DataFrame
By default, the drop() function returns a new DataFrame with the specified columns removed, leaving the original DataFrame unchanged. If you want to modify the original DataFrame directly, you can use the inplace parameter:
import pandas as pd

# Create a sample DataFrame
df = pd.DataFrame({
    'A': [1, 2, 3],
    'B': [4, 5, 6],
    'C': [7, 8, 9],
    'D': [10, 11, 12]
})

# Drop column 'B' inplace
df.drop('B', axis=1, inplace=True)

print("DataFrame after dropping column 'B' inplace:")
print(df)
Output:
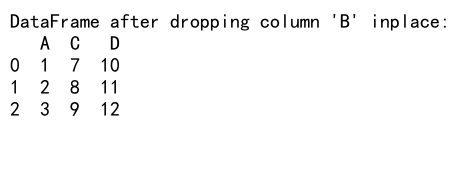
In this example, we use inplace=True to modify the original DataFrame directly, removing column ‘B’ without creating a new DataFrame.
Dropping Columns Based on Conditions
Sometimes you may want to drop columns based on certain conditions, such as data type or column name patterns. Here are a few examples:
Dropping Columns by Data Type
import pandas as pd
import numpy as np

# Create a sample DataFrame with mixed data types
df = pd.DataFrame({
    'A': [1, 2, 3],
    'B': ['x', 'y', 'z'],
    'C': [1.1, 2.2, 3.3],
    'D': [True, False, True],
    'E': pd.date_range('2023-01-01', periods=3)
})

# Drop all numeric columns
df_no_numeric = df.drop(df.select_dtypes(include=[np.number]).columns, axis=1)

print("Original DataFrame:")
print(df)
print("\nDataFrame after dropping numeric columns:")
print(df_no_numeric)
Output:
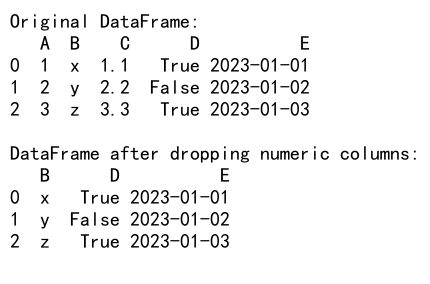
In this example, we use select_dtypes() to identify all numeric columns and then drop them using the drop() function.
Dropping Columns by Name Pattern
import pandas as pd

# Create a sample DataFrame
df = pd.DataFrame({
    'col1': [1, 2, 3],
    'col2': [4, 5, 6],
    'feature1': [7, 8, 9],
    'feature2': [10, 11, 12],
    'other': [13, 14, 15]
})

# Drop columns that start with 'col'
df_dropped = df.drop(columns=df.filter(regex='^col').columns, axis=1)

print("Original DataFrame:")
print(df)
print("\nDataFrame after dropping columns starting with 'col':")
print(df_dropped)
Output:
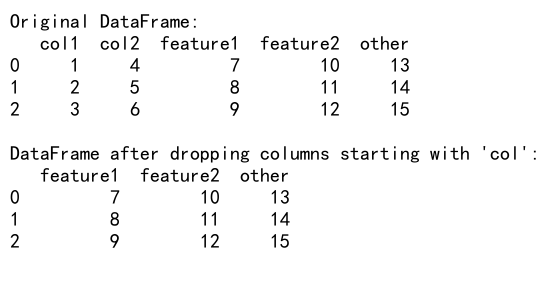
In this example, we use the filter() function with a regular expression to identify columns that start with ‘col’, and then drop them using the drop() function.
Handling Errors When Dropping Columns
When dropping columns, you may encounter situations where the specified column doesn’t exist. By default, Pandas will raise a KeyError in such cases. However, you can use the errors parameter to control this behavior:
import pandas as pd

# Create a sample DataFrame
df = pd.DataFrame({
    'A': [1, 2, 3],
    'B': [4, 5, 6],
    'C': [7, 8, 9]
})

# Attempt to drop a non-existent column
df_dropped = df.drop('D', axis=1, errors='ignore')

print("Original DataFrame:")
print(df)
print("\nDataFrame after attempting to drop non-existent column 'D':")
print(df_dropped)
Output:
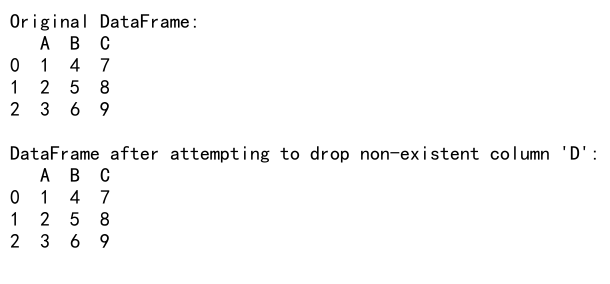
In this example, we attempt to drop a non-existent column ‘D’. By using errors='ignore', Pandas silently ignores the error and returns the DataFrame unchanged.
Advanced Column Dropping Techniques
Let’s explore some more advanced techniques for dropping columns in Pandas:
Dropping Columns with Missing Values
You might want to drop columns that have a certain percentage of missing values:
import pandas as pd
import numpy as np

# Create a sample DataFrame with missing values
df = pd.DataFrame({
    'A': [1, 2, np.nan, 4, 5],
    'B': [np.nan, 2, 3, 4, 5],
    'C': [1, 2, 3, np.nan, 5],
    'D': [1, 2, 3, 4, 5],
    'E': [np.nan, np.nan, np.nan, np.nan, np.nan]
})

# Drop columns with more than 50% missing values
threshold = len(df) * 0.5
df_dropped = df.dropna(axis=1, thresh=threshold)

print("Original DataFrame:")
print(df)
print("\nDataFrame after dropping columns with >50% missing values:")
print(df_dropped)
Output:
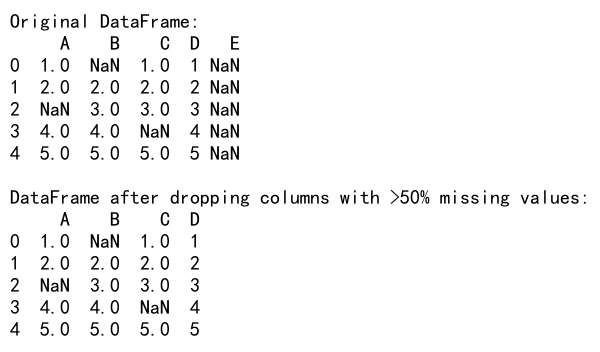
In this example, we use the dropna() function with axis=1 to drop columns. The thresh parameter specifies the minimum number of non-null values required to keep a column.
Dropping Columns Based on Correlation
You might want to remove highly correlated columns to reduce multicollinearity in your dataset:
import pandas as pd
import numpy as np

# Create a sample DataFrame with correlated columns
np.random.seed(42)
df = pd.DataFrame({
    'A': np.random.rand(100),
    'B': np.random.rand(100),
    'C': np.random.rand(100),
    'D': np.random.rand(100)
})
df['E'] = df['A'] * 0.5 + df['B'] * 0.5  # Highly correlated with A and B

# Calculate correlation matrix
corr_matrix = df.corr().abs()

# Select upper triangle of correlation matrix
upper = corr_matrix.where(np.triu(np.ones(corr_matrix.shape), k=1).astype(bool))

# Find columns with correlation greater than 0.95
to_drop = [column for column in upper.columns if any(upper[column] > 0.95)]

# Drop highly correlated columns
df_dropped = df.drop(to_drop, axis=1)

print("Original DataFrame shape:", df.shape)
print("DataFrame shape after dropping highly correlated columns:", df_dropped.shape)
Output:

This example demonstrates how to identify and drop highly correlated columns using the correlation matrix.
Performance Considerations When Dropping Columns
When working with large datasets, the performance of column dropping operations can become a concern. Here are some tips to optimize column dropping:
- Use
inplace=Truewhen possible to avoid creating unnecessary copies of the DataFrame. - If you’re dropping multiple columns, it’s generally more efficient to drop them all at once rather than in separate operations.
- Consider using
df.loc[:, columns_to_keep]instead ofdrop()if you’re keeping most columns and dropping only a few.
Here’s an example comparing the performance of different column dropping methods:
import pandas as pd
import numpy as np
import time

# Create a large DataFrame
n_rows = 1000000
n_cols = 100
df = pd.DataFrame(np.random.rand(n_rows, n_cols), columns=[f'col_{i}' for i in range(n_cols)])

# Method 1: Drop columns one by one
start_time = time.time()
for i in range(10):
    df = df.drop(f'col_{i}', axis=1)
method1_time = time.time() - start_time

# Reset DataFrame
df = pd.DataFrame(np.random.rand(n_rows, n_cols), columns=[f'col_{i}' for i in range(n_cols)])

# Method 2: Drop multiple columns at once
start_time = time.time()
df = df.drop([f'col_{i}' for i in range(10)], axis=1)
method2_time = time.time() - start_time

# Reset DataFrame
df = pd.DataFrame(np.random.rand(n_rows, n_cols), columns=[f'col_{i}' for i in range(n_cols)])

# Method 3: Use loc to select columns to keep
start_time = time.time()
df = df.loc[:, df.columns.drop([f'col_{i}' for i in range(10)])]
method3_time = time.time() - start_time

print(f"Method 1 (drop one by one) time: {method1_time:.4f} seconds")
print(f"Method 2 (drop multiple at once) time: {method2_time:.4f} seconds")
print(f"Method 3 (use loc to select columns) time: {method3_time:.4f} seconds")
Output:

This example compares the performance of three different methods for dropping columns in a large DataFrame.
Dropping Columns in MultiIndex DataFrames
When working with MultiIndex DataFrames, dropping columns requires a slightly different approach. You need to specify the full column name as a tuple when dropping:
import pandas as pd
import numpy as np

# Create a sample MultiIndex DataFrame
arrays = [
    ['bar', 'bar', 'baz', 'baz', 'foo', 'foo', 'qux', 'qux'],
    ['one', 'two', 'one', 'two', 'one', 'two', 'one', 'two']
]
tuples = list(zip(*arrays))
index = pd.MultiIndex.from_tuples(tuples, names=['first', 'second'])
df = pd.DataFrame(np.random.randn(3, 8), index=['A', 'B', 'C'], columns=index)

# Drop a specific column
df_dropped = df.drop(('bar', 'one'), axis=1)

print("Original MultiIndex DataFrame:")
print(df)
print("\nMultiIndex DataFrame after dropping ('bar', 'one'):")
print(df_dropped)
Output:
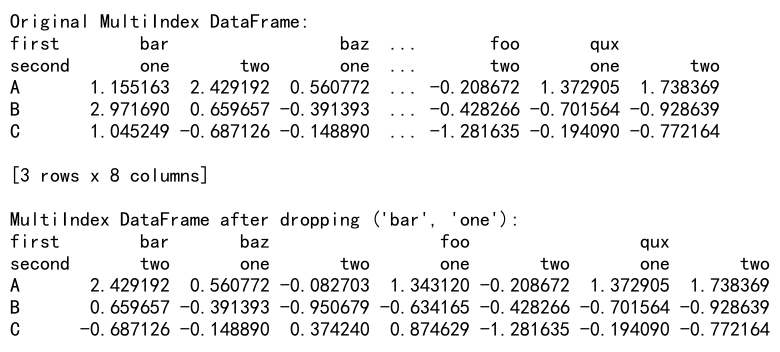
In this example, we create a MultiIndex DataFrame and demonstrate how to drop a specific column using the full column name as a tuple.
Dropping Columns Based on Data Quality
Sometimes you might want to drop columns based on data quality metrics, such as the percentage of unique values or the presence of outliers. Here are a couple of examples:
Dropping Columns with Low Variance
import pandas as pd
import numpy as np

# Create a sample DataFrame
df = pd.DataFrame({
    'A': [1, 1, 1, 1, 1],
    'B': [1, 2, 3, 4, 5],
    'C': [1, 1, 1, 2, 2],
    'D': [1, 2, 3, 4, 5],
    'E': [1, 1, 1, 1, 2]
})

# Calculate variance for each column
variances = df.var()

# Drop columns with variance below a threshold
threshold = 0.5
low_variance_columns = variances[variances < threshold].index
df_dropped = df.drop(low_variance_columns, axis=1)

print("Original DataFrame:")
print(df)
print("\nDataFrame after dropping low variance columns:")
print(df_dropped)
Output:
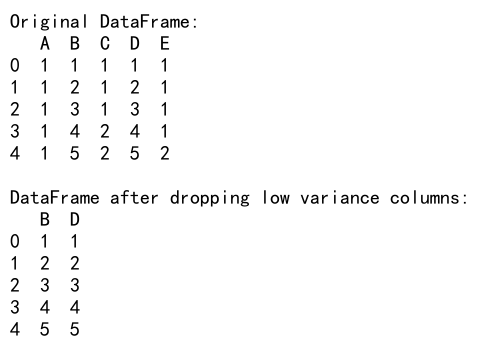
This example demonstrates how to drop columns with low variance, which might not provide much information for analysis or modeling.
Dropping Columns with High Percentage of Outliers
import pandas as pd
import numpy as np
from scipy import stats

# Create a sample DataFrame with outliers
np.random.seed(42)
df = pd.DataFrame({
    'A': np.random.normal(0, 1, 1000),
    'B': np.random.normal(0, 1, 1000),
    'C': np.concatenate([np.random.normal(0, 1, 950), np.random.normal(10, 1, 50)]),
    'D': np.random.normal(0, 1, 1000),
    'E': np.concatenate([np.random.normal(0, 1, 900), np.random.normal(20, 1, 100)])
})

# Function to calculate percentage of outliers
def outlier_percentage(column, threshold=3):
    z_scores = np.abs(stats.zscore(column))
    return (z_scores> threshold).mean()

# Calculate outlier percentage for each column
outlier_percentages = df.apply(outlier_percentage)

# Drop columns with outlier percentage above a threshold
threshold = 0.05  # 5% outliers
high_outlier_columns = outlier_percentages[outlier_percentages > threshold].index
df_dropped = df.drop(high_outlier_columns, axis=1)

print("Original DataFrame shape:", df.shape)
print("DataFrame shape after dropping columns with high outlier percentage:", df_dropped.shape)
print("\nOutlier percentages:")
print(outlier_percentages)
Output:
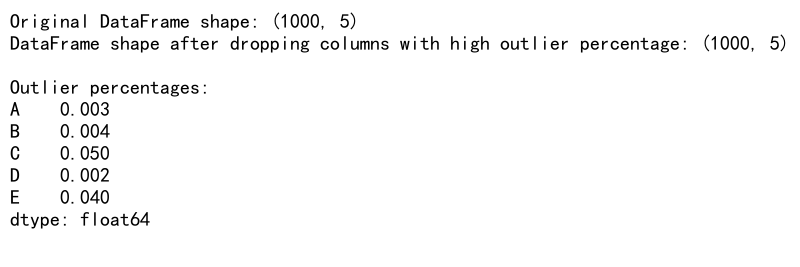
This example shows how to identify and drop columns with a high percentage of outliers, which might skew your analysis or modeling results.
Dropping Columns in Time Series Data
When working with time series data, you might want to drop columns based on temporal characteristics. Here’s an example of dropping columns with low variability over time:
import pandas as pd
import numpy as np

# Create a sample time series DataFrame
dates = pd.date_range('2023-01-01', periods=100)
df = pd.DataFrame({
    'A': np.sin(np.arange(100)) + np.random.randn(100) * 0.1,
    'B': np.random.randn(100),
    'C': np.repeat([1, 2, 3, 4, 5], 20),
    'D': np.random.choice(['X', 'Y', 'Z'], 100),
    'E': np.arange(100)
}, index=dates)

# Calculate the coefficient of variation for numeric columns
def cv(x):
    return np.std(x) / np.mean(x) if np.mean(x) != 0 else 0

numeric_columns = df.select_dtypes(include=[np.number]).columns
cv_values = df[numeric_columns].apply(cv)

# Drop columns with low coefficient of variation
threshold = 0.1
low_variability_columns = cv_values[cv_values < threshold].index
df_dropped = df.drop(low_variability_columns, axis=1)

print("Original DataFrame:")
print(df.head())
print("\nCoefficient of variation for numeric columns:")
print(cv_values)
print("\nDataFrame after dropping low variability columns:")
print(df_dropped.head())
Output:
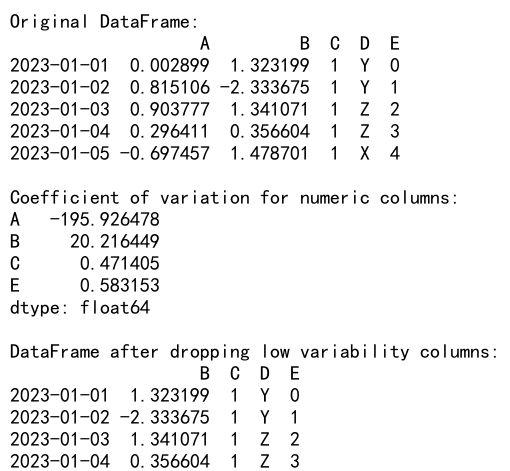
This example demonstrates how to drop columns with low variability over time in a time series dataset, which might not provide useful information for time-based analysis or forecasting.
Dropping Columns Based on Feature Importance
When working with machine learning models, you might want to drop columns based on their importance to the target variable. Here’s an example using a Random Forest model to determine feature importance:
import pandas as pd
import numpy as np
from sklearn.ensemble import RandomForestRegressor
from sklearn.model_selection import train_test_split

# Create a sample DataFrame
np.random.seed(42)
df = pd.DataFrame({
    'A': np.random.rand(1000),
    'B': np.random.rand(1000),
    'C': np.random.rand(1000),
    'D': np.random.rand(1000),
    'E': np.random.rand(1000)
})
df['target'] = 2 * df['A'] + 0.5 * df['B'] + np.random.randn(1000) * 0.1

# Split the data into features and target
X = df.drop('target', axis=1)
y = df['target']

# Train a Random Forest model
rf_model = RandomForestRegressor(n_estimators=100, random_state=42)
rf_model.fit(X, y)

# Get feature importances
importances = pd.Series(rf_model.feature_importances_, index=X.columns).sort_values(ascending=False)

# Drop columns with low importance
importance_threshold = 0.1
columns_to_drop = importances[importances < importance_threshold].index
df_dropped = df.drop(columns_to_drop, axis=1)

print("Feature importances:")
print(importances)
print("\nOriginal DataFrame shape:", df.shape)
print("DataFrame shape after dropping low importance columns:", df_dropped.shape)
Output:
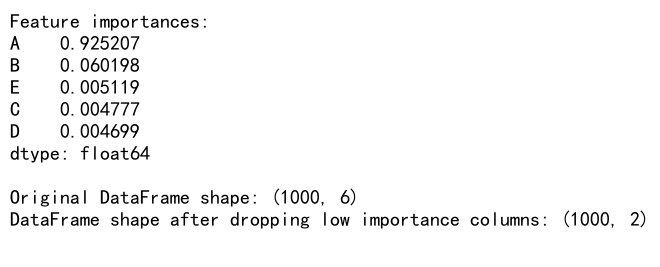
This example shows how to use a Random Forest model to determine feature importance and drop columns that have low importance for predicting the target variable.
Handling Column Dropping in Grouped Operations
When working with grouped data in Pandas, dropping columns can be a bit tricky. Here’s an example of how to drop columns within grouped operations:
import pandas as pd
import numpy as np

# Create a sample DataFrame
df = pd.DataFrame({
    'group': ['A', 'A', 'B', 'B', 'C', 'C'],
    'value1': np.random.rand(6),
    'value2': np.random.rand(6),
    'value3': np.random.rand(6)
})

# Define a function to drop columns based on their mean
def drop_low_mean_columns(group, threshold=0.5):
    means = group.mean()
    columns_to_keep = means[means >= threshold].index
    return group[columns_to_keep]

# Apply the function to each group
df_dropped = df.groupby('group').apply(drop_low_mean_columns).reset_index(drop=True)

print("Original DataFrame:")
print(df)
print("\nDataFrame after dropping columns with low mean within each group:")
print(df_dropped)
Output:
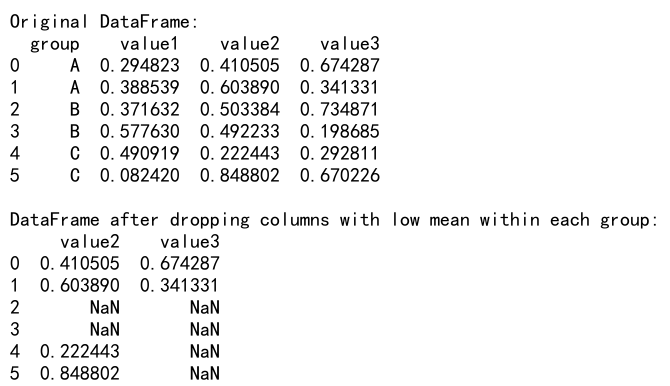
This example demonstrates how to drop columns based on their mean values within each group, which can be useful when you want to apply different column dropping criteria to different subsets of your data.
Pandas Drop Column Axis Conclusion
Dropping columns is a fundamental operation in data preprocessing and analysis. The axis parameter plays a crucial role in specifying that we want to operate on columns rather than rows. Throughout this article, we’ve explored various techniques for dropping columns in Pandas, including:
- Basic column dropping using
drop() - Dropping multiple columns at once
- Using the
inplaceparameter for in-place modifications - Dropping columns based on conditions (data type, name patterns)
- Handling errors when dropping non-existent columns
- Advanced techniques like dropping columns with missing values or based on correlation
- Performance considerations for large datasets
- Dropping columns in MultiIndex DataFrames
- Dropping columns based on data quality metrics
- Handling column dropping in time series data and grouped operations
- Dropping columns based on feature importance in machine learning contexts
By mastering these techniques, you’ll be well-equipped to handle a wide range of data preprocessing tasks involving column manipulation in Pandas. Remember to always consider the specific requirements of your data analysis or machine learning project when deciding which columns to drop and how to perform the operation efficiently.
 Pandas Dataframe