Mastering Pandas GroupBy: Adding Sum Columns for Efficient Data Analysis
Pandas groupby add sum column is a powerful technique in data analysis that allows you to aggregate data and create summary statistics for grouped data. This article will explore the various aspects of using pandas groupby to add sum columns, providing detailed explanations and practical examples to help you master this essential skill.
Understanding Pandas GroupBy and Sum Operations
Pandas groupby add sum column operations are fundamental for data analysis and manipulation. The groupby function in pandas allows you to split your data into groups based on one or more columns, while the sum operation enables you to calculate the sum of numeric columns within each group. By combining these two operations, you can create new columns that represent the sum of values for each group.
Let’s start with a simple example to illustrate the basic concept of pandas groupby add sum column:
import pandas as pd

# Create a sample DataFrame
df = pd.DataFrame({
    'Category': ['A', 'B', 'A', 'B', 'A', 'B'],
    'Value': [10, 20, 15, 25, 30, 35],
    'Website': ['pandasdataframe.com'] * 6
})

# Group by 'Category' and sum 'Value'
grouped_sum = df.groupby('Category')['Value'].sum().reset_index()
grouped_sum.columns = ['Category', 'Total_Value']

# Merge the grouped sum back to the original DataFrame
result = pd.merge(df, grouped_sum, on='Category')

print(result)
Output:
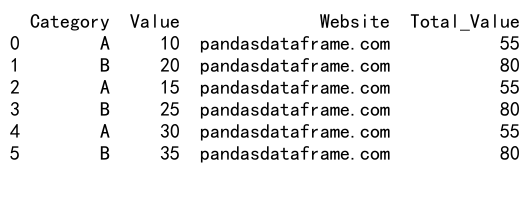
In this example, we create a sample DataFrame with ‘Category’ and ‘Value’ columns. We then use groupby to group the data by ‘Category’ and sum the ‘Value’ column. The resulting grouped sum is merged back to the original DataFrame, creating a new ‘Total_Value’ column that represents the sum of ‘Value’ for each category.
Advanced Groupby Techniques for Adding Sum Columns
Pandas groupby add sum column operations can be extended to more complex scenarios. Let’s explore some advanced techniques:
Multiple Column Grouping
You can group by multiple columns to create more specific sum columns:
import pandas as pd

# Create a sample DataFrame
df = pd.DataFrame({
    'Category': ['A', 'B', 'A', 'B', 'A', 'B'],
    'Subcategory': ['X', 'Y', 'X', 'Z', 'Y', 'Z'],
    'Value': [10, 20, 15, 25, 30, 35],
    'Website': ['pandasdataframe.com'] * 6
})

# Group by multiple columns and sum 'Value'
grouped_sum = df.groupby(['Category', 'Subcategory'])['Value'].sum().reset_index()
grouped_sum.columns = ['Category', 'Subcategory', 'Total_Value']

# Merge the grouped sum back to the original DataFrame
result = pd.merge(df, grouped_sum, on=['Category', 'Subcategory'])

print(result)
Output:

This example demonstrates how to group by both ‘Category’ and ‘Subcategory’ columns, creating a more granular sum of ‘Value’.
Adding Multiple Sum Columns
You can add multiple sum columns in a single operation:
import pandas as pd

# Create a sample DataFrame
df = pd.DataFrame({
    'Category': ['A', 'B', 'A', 'B', 'A', 'B'],
    'Value1': [10, 20, 15, 25, 30, 35],
    'Value2': [5, 10, 7, 12, 15, 17],
    'Website': ['pandasdataframe.com'] * 6
})

# Group by 'Category' and sum multiple columns
grouped_sum = df.groupby('Category').agg({
    'Value1': 'sum',
    'Value2': 'sum'
}).reset_index()
grouped_sum.columns = ['Category', 'Total_Value1', 'Total_Value2']

# Merge the grouped sum back to the original DataFrame
result = pd.merge(df, grouped_sum, on='Category')

print(result)
Output:

This example shows how to sum multiple columns (‘Value1’ and ‘Value2’) simultaneously using the agg function.
Handling Missing Values in Groupby Sum Operations
When dealing with real-world data, you may encounter missing values. Pandas groupby add sum column operations provide options to handle these scenarios:
import pandas as pd
import numpy as np

# Create a sample DataFrame with missing values
df = pd.DataFrame({
    'Category': ['A', 'B', 'A', 'B', 'A', 'B'],
    'Value': [10, np.nan, 15, 25, np.nan, 35],
    'Website': ['pandasdataframe.com'] * 6
})

# Group by 'Category' and sum 'Value', ignoring NaN values
grouped_sum = df.groupby('Category')['Value'].sum().reset_index()
grouped_sum.columns = ['Category', 'Total_Value']

# Merge the grouped sum back to the original DataFrame
result = pd.merge(df, grouped_sum, on='Category')

print(result)
Output:
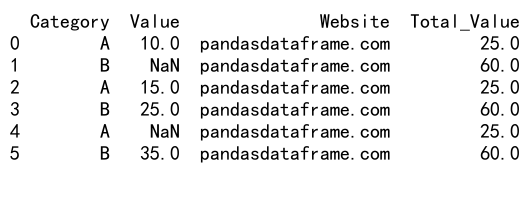
In this example, NaN values are automatically ignored when calculating the sum. You can also use the skipna parameter to control this behavior explicitly:
# Group by 'Category' and sum 'Value', including NaN values
grouped_sum_with_nan = df.groupby('Category')['Value'].sum(skipna=False).reset_index()
grouped_sum_with_nan.columns = ['Category', 'Total_Value_With_NaN']

# Merge the grouped sum back to the original DataFrame
result_with_nan = pd.merge(df, grouped_sum_with_nan, on='Category')

print(result_with_nan)
Applying Custom Functions with Groupby Sum
Pandas groupby add sum column operations can be extended to include custom functions for more complex aggregations:
import pandas as pd

# Create a sample DataFrame
df = pd.DataFrame({
    'Category': ['A', 'B', 'A', 'B', 'A', 'B'],
    'Value': [10, 20, 15, 25, 30, 35],
    'Website': ['pandasdataframe.com'] * 6
})

# Define a custom function
def custom_sum(x):
    return x.sum() if x.sum() > 50 else 0

# Group by 'Category' and apply custom function
grouped_custom = df.groupby('Category').agg({
    'Value': ['sum', custom_sum]
}).reset_index()
grouped_custom.columns = ['Category', 'Total_Value', 'Custom_Sum']

# Merge the grouped results back to the original DataFrame
result = pd.merge(df, grouped_custom, on='Category')

print(result)
Output:

This example demonstrates how to apply both a standard sum and a custom function to the grouped data.
Time-based Grouping and Summing
Pandas groupby add sum column operations are particularly useful for time-series data:
import pandas as pd
import numpy as np

# Create a sample DataFrame with date information
dates = pd.date_range(start='2023-01-01', end='2023-12-31', freq='D')
df = pd.DataFrame({
    'Date': dates,
    'Category': np.random.choice(['A', 'B', 'C'], size=len(dates)),
    'Value': np.random.randint(1, 100, size=len(dates)),
    'Website': ['pandasdataframe.com'] * len(dates)
})

# Group by month and sum 'Value'
df['Month'] = df['Date'].dt.to_period('M')
monthly_sum = df.groupby(['Month', 'Category'])['Value'].sum().reset_index()
monthly_sum.columns = ['Month', 'Category', 'Monthly_Total']

# Merge the monthly sum back to the original DataFrame
result = pd.merge(df, monthly_sum, on=['Month', 'Category'])

print(result.head())
Output:

This example demonstrates how to group time-series data by month and category, calculating monthly totals for each category.
Hierarchical Indexing with Groupby Sum
Pandas groupby add sum column operations can create hierarchical indexes, which are useful for multi-level aggregations:
import pandas as pd

# Create a sample DataFrame
df = pd.DataFrame({
    'Category': ['A', 'B', 'A', 'B', 'A', 'B'],
    'Subcategory': ['X', 'Y', 'X', 'Z', 'Y', 'Z'],
    'Value': [10, 20, 15, 25, 30, 35],
    'Website': ['pandasdataframe.com'] * 6
})

# Create a hierarchical index with groupby and sum
hierarchical_sum = df.groupby(['Category', 'Subcategory'])['Value'].sum()

print(hierarchical_sum)

# Accessing specific groups
print(hierarchical_sum.loc['A'])
print(hierarchical_sum.loc['A', 'X'])
Output:
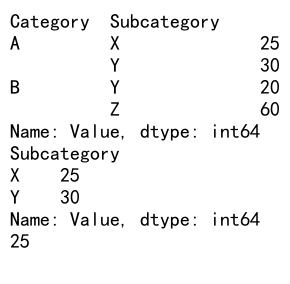
This example shows how to create a hierarchical index using groupby and sum, and how to access specific levels of the hierarchy.
Combining Groupby Sum with Other Aggregations
Pandas groupby add sum column operations can be combined with other aggregation functions for comprehensive data summaries:
import pandas as pd

# Create a sample DataFrame
df = pd.DataFrame({
    'Category': ['A', 'B', 'A', 'B', 'A', 'B'],
    'Value': [10, 20, 15, 25, 30, 35],
    'Website': ['pandasdataframe.com'] * 6
})

# Perform multiple aggregations
multi_agg = df.groupby('Category').agg({
    'Value': ['sum', 'mean', 'min', 'max', 'count']
}).reset_index()

# Flatten column names
multi_agg.columns = ['Category', 'Total_Value', 'Mean_Value', 'Min_Value', 'Max_Value', 'Count']

print(multi_agg)
Output:

This example demonstrates how to combine sum with other aggregation functions like mean, min, max, and count in a single groupby operation.
Handling Categorical Data in Groupby Sum
When working with categorical data, pandas groupby add sum column operations may require special handling:
import pandas as pd

# Create a sample DataFrame with categorical data
df = pd.DataFrame({
    'Category': pd.Categorical(['A', 'B', 'A', 'B', 'C', 'C']),
    'Value': [10, 20, 15, 25, 30, 35],
    'Website': ['pandasdataframe.com'] * 6
})

# Ensure all categories are included in the groupby sum
all_categories = pd.Categorical(['A', 'B', 'C', 'D'])  # Include 'D' even though it's not in the data
df['Category'] = df['Category'].astype(pd.CategoricalDtype(categories=all_categories))

# Group by 'Category' and sum 'Value'
grouped_sum = df.groupby('Category', observed=False)['Value'].sum().reset_index()
grouped_sum.columns = ['Category', 'Total_Value']

print(grouped_sum)
Output:
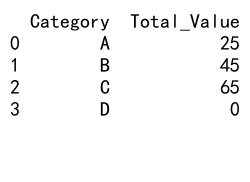
This example shows how to handle categorical data in groupby sum operations, ensuring that all categories are included in the result, even if they don’t appear in the original data.
Groupby Sum with Date Ranges
Pandas groupby add sum column operations can be useful for analyzing data over specific date ranges:
import pandas as pd
import numpy as np

# Create a sample DataFrame with date information
dates = pd.date_range(start='2023-01-01', end='2023-12-31', freq='D')
df = pd.DataFrame({
    'Date': dates,
    'Category': np.random.choice(['A', 'B', 'C'], size=len(dates)),
    'Value': np.random.randint(1, 100, size=len(dates)),
    'Website': ['pandasdataframe.com'] * len(dates)
})

# Define date ranges
date_ranges = [
    ('Q1', '2023-01-01', '2023-03-31'),
    ('Q2', '2023-04-01', '2023-06-30'),
    ('Q3', '2023-07-01', '2023-09-30'),
    ('Q4', '2023-10-01', '2023-12-31')
]

# Function to calculate sum for a specific date range
def sum_for_range(df, start, end):
    return df[(df['Date'] >= start) & (df['Date'] <= end)].groupby('Category')['Value'].sum()

# Calculate sums for each date range
results = []
for quarter, start, end in date_ranges:
    quarter_sum = sum_for_range(df, start, end).reset_index()
    quarter_sum['Quarter'] = quarter
    results.append(quarter_sum)

# Combine results
quarterly_sums = pd.concat(results)
quarterly_sums.columns = ['Category', 'Quarterly_Total', 'Quarter']

print(quarterly_sums)
Output:
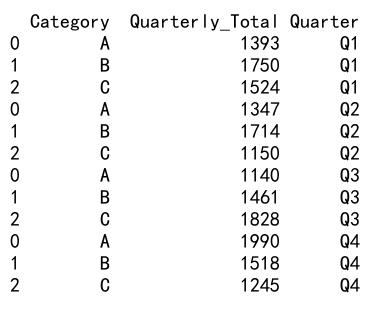
This example demonstrates how to calculate sums for specific date ranges (quarters in this case) using pandas groupby add sum column operations.
Groupby Sum with Rolling Windows
Pandas groupby add sum column operations can be combined with rolling windows for time-series analysis:
import pandas as pd
import numpy as np

# Create a sample DataFrame with date information
dates = pd.date_range(start='2023-01-01', end='2023-12-31', freq='D')
df = pd.DataFrame({
    'Date': dates,
    'Category': np.random.choice(['A', 'B'], size=len(dates)),
    'Value': np.random.randint(1, 100, size=len(dates)),
    'Website': ['pandasdataframe.com'] * len(dates)
})

# Set Date as index
df.set_index('Date', inplace=True)

# Calculate 7-day rolling sum for each category
rolling_sum = df.groupby('Category')['Value'].rolling(window=7).sum().reset_index()
rolling_sum.columns = ['Category', 'Date', 'Rolling_Sum']

# Merge rolling sum back to original DataFrame
result = pd.merge(df.reset_index(), rolling_sum, on=['Category', 'Date'])

print(result.head(10))
Output:
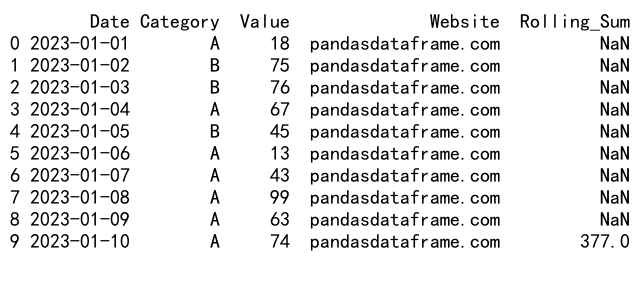
This example shows how to calculate a 7-day rolling sum for each category using pandas groupby add sum column operations combined with the rolling function.
Groupby Sum with Pivot Tables
Pandas groupby add sum column operations can be used in conjunction with pivot tables for more complex data reshaping:
import pandas as pd
import numpy as np

# Create a sample DataFrame
df = pd.DataFrame({
    'Date': pd.date_range(start='2023-01-01', end='2023-12-31', freq='D'),
    'Category': np.random.choice(['A', 'B', 'C'], size=365),
    'Subcategory': np.random.choice(['X', 'Y', 'Z'], size=365),
    'Value': np.random.randint(1, 100, size=365),
    'Website': ['pandasdataframe.com'] * 365
})

# Create a pivot table with sum of 'Value'
pivot_sum = pd.pivot_table(df, values='Value', index=['Date'], columns=['Category', 'Subcategory'], aggfunc='sum')

# Reset index to make 'Date' a column
pivot_sum.reset_index(inplace=True)

print(pivot_sum.head())
Output:

This example demonstrates how to create a pivot table that summarizes the sum of ‘Value’ for each combination of Date, Category, and Subcategory.
Groupby Sum with Percentage Calculation
Pandas groupby add sum column operations can be extended to calculate percentages within groups:
import pandas as pd

# Create a sample DataFrame
df = pd.DataFrame({
    'Category': ['A', 'A', 'B', 'B', 'C', 'C'],
    'Subcategory': ['X', 'Y', 'X', 'Y', 'X', 'Y'],
    'Value': [10, 20, 15, 25, 30, 35],
    'Website': ['pandasdataframe.com'] * 6
})

# Calculate sum and percentage within each Category
df['Category_Sum'] = df.groupby('Category')['Value'].transform('sum')
df['Percentage'] = df['Value'] / df['Category_Sum'] * 100

print(df)
Output:

This example shows how to calculate the sum for each category and then compute the percentage that each value represents within its category.
Groupby Sum with Multiple Aggregations
Pandas groupby add sum column operations can be combined with other aggregations for comprehensive summaries:
import pandas as pd
import numpy as np

# Create a sample DataFrame
df = pd.DataFrame({
    'Category': np.random.choice(['A', 'B', 'C'], size=1000),
    'Value1': np.random.randint(1, 100, size=1000),
    'Value2': np.random.randint(1, 100, size=1000),
    'Website': ['pandasdataframe.com'] * 1000
})

# Perform multiple aggregations
agg_results = df.groupby('Category').agg({
    'Value1': ['sum', 'mean', 'max'],
    'Value2': ['sum', 'mean', 'min']
})

# Flatten column names
agg_results.columns = ['_'.join(col).strip() for col in agg_results.columns.values]
agg_results.reset_index(inplace=True)

print(agg_results)
Output:

This example shows how to perform multiple aggregations (sum, mean, max, min) on different columns within the same groupby operation.
Pandas groupby add sum column Conclusion
Pandas groupby add sum column operations are a powerful tool for data analysis and manipulation. Throughout this article, we’ve explored various techniques and applications of this functionality, from basic grouping and summing to more advanced operations like handling missing values, applying custom functions, and working with time-series data.
By mastering these techniques, you can efficiently aggregate and analyze your data, creating insightful summaries and statistics. Remember to consider factors such as data types, missing values, and memory constraints when working with large datasets.
 Pandas Dataframe