Mastering Pandas GroupBy: A Comprehensive Guide to Getting Groups
Pandas groupby get groups is a powerful feature in the pandas library that allows you to efficiently group and analyze data. This article will dive deep into the intricacies of using groupby and retrieving groups in pandas, providing you with a comprehensive understanding of this essential functionality.
Introduction to Pandas GroupBy
Pandas groupby get groups is a fundamental operation in data analysis that enables you to split your data into groups based on specific criteria and perform operations on these groups. The groupby operation is particularly useful when dealing with large datasets and when you need to aggregate or transform data based on certain categories or conditions.
Let’s start with a simple example to illustrate the basic concept of pandas groupby get groups:
import pandas as pd

# Create a sample DataFrame
df = pd.DataFrame({
    'Name': ['John', 'Emma', 'John', 'Emma', 'Mike'],
    'Age': [25, 30, 25, 30, 35],
    'City': ['New York', 'London', 'New York', 'Paris', 'Tokyo']
})

# Group the DataFrame by 'Name'
grouped = df.groupby('Name')

# Get the groups
groups = grouped.groups

print(groups)
Output:

In this example, we create a simple DataFrame with information about people and their cities. We then use the groupby method to group the data by the ‘Name’ column. The groups attribute of the resulting GroupBy object gives us a dictionary where the keys are the unique values in the ‘Name’ column, and the values are the corresponding row indices.
Understanding the GroupBy Object
When you use pandas groupby get groups, you create a GroupBy object. This object is a powerful tool that allows you to perform various operations on your grouped data. Let’s explore some of the key attributes and methods of the GroupBy object:
The groups Attribute
The groups attribute, as we saw in the previous example, returns a dictionary of group names and their corresponding row indices. Here’s another example:
import pandas as pd

# Create a sample DataFrame
df = pd.DataFrame({
    'Product': ['A', 'B', 'A', 'B', 'C'],
    'Sales': [100, 200, 150, 250, 300],
    'Region': ['East', 'West', 'East', 'East', 'West']
})

# Group by 'Product'
grouped = df.groupby('Product')

# Get the groups
groups = grouped.groups

print(groups)
Output:

In this example, we group the DataFrame by ‘Product’ and retrieve the groups. The resulting dictionary will show the row indices for each unique product.
The get_group() Method
The get_group() method allows you to retrieve a specific group from your grouped data. Here’s how you can use it:
import pandas as pd

# Create a sample DataFrame
df = pd.DataFrame({
    'Category': ['A', 'B', 'A', 'B', 'C'],
    'Value': [10, 20, 15, 25, 30],
    'pandasdataframe.com': ['x', 'y', 'z', 'w', 'v']
})

# Group by 'Category'
grouped = df.groupby('Category')

# Get a specific group
group_a = grouped.get_group('A')

print(group_a)
Output:
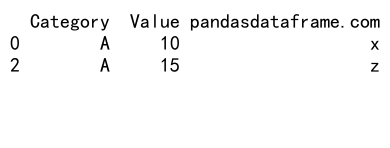
In this example, we group the DataFrame by ‘Category’ and then use get_group() to retrieve all rows where the ‘Category’ is ‘A’.
Advanced GroupBy Operations
Now that we’ve covered the basics of pandas groupby get groups, let’s explore some more advanced operations and techniques.
Multi-level Grouping
Pandas allows you to group by multiple columns, creating a hierarchical index. Here’s an example:
import pandas as pd

# Create a sample DataFrame
df = pd.DataFrame({
    'Department': ['IT', 'HR', 'IT', 'HR', 'Finance'],
    'Employee': ['John', 'Emma', 'Mike', 'Sarah', 'Tom'],
    'Salary': [50000, 60000, 55000, 65000, 70000],
    'pandasdataframe.com': ['a', 'b', 'c', 'd', 'e']
})

# Group by multiple columns
grouped = df.groupby(['Department', 'Employee'])

# Get the groups
groups = grouped.groups

print(groups)
Output:

In this example, we group the DataFrame by both ‘Department’ and ‘Employee’. The resulting groups will be hierarchical, with ‘Department’ as the outer level and ‘Employee’ as the inner level.
Aggregation with GroupBy
One of the most common operations with pandas groupby get groups is aggregation. You can use various aggregation functions to summarize your grouped data. Here’s an example:
import pandas as pd

# Create a sample DataFrame
df = pd.DataFrame({
    'Product': ['A', 'B', 'A', 'B', 'C'],
    'Sales': [100, 200, 150, 250, 300],
    'Quantity': [10, 15, 12, 18, 20],
    'pandasdataframe.com': ['p', 'q', 'r', 's', 't']
})

# Group by 'Product' and aggregate
result = df.groupby('Product').agg({
    'Sales': 'sum',
    'Quantity': 'mean'
})

print(result)
Output:
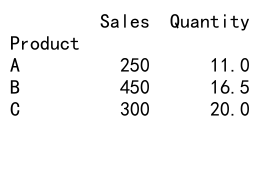
In this example, we group the DataFrame by ‘Product’ and then apply different aggregation functions to different columns. We sum the ‘Sales’ and calculate the mean of ‘Quantity’ for each product.
Transformation with GroupBy
Transformation is another powerful feature of pandas groupby get groups. It allows you to apply a function to each group and return a result with the same shape as the input. Here’s an example:
import pandas as pd

# Create a sample DataFrame
df = pd.DataFrame({
    'Category': ['A', 'B', 'A', 'B', 'C'],
    'Value': [10, 20, 15, 25, 30],
    'pandasdataframe.com': ['v', 'w', 'x', 'y', 'z']
})

# Group by 'Category' and transform
df['Normalized'] = df.groupby('Category')['Value'].transform(lambda x: (x - x.mean()) / x.std())

print(df)
Output:
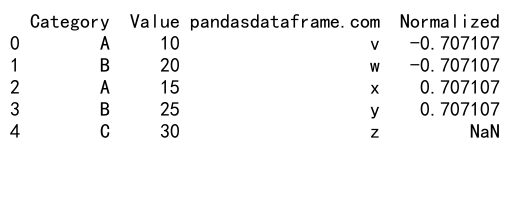
In this example, we group the DataFrame by ‘Category’ and then apply a transformation to normalize the ‘Value’ column within each group.
Working with Time Series Data
Pandas groupby get groups is particularly useful when working with time series data. You can group by time periods and perform various analyses. Here’s an example:
import pandas as pd

# Create a sample DataFrame with time series data
dates = pd.date_range(start='2023-01-01', end='2023-12-31', freq='D')
df = pd.DataFrame({
    'Date': dates,
    'Sales': np.random.randint(100, 1000, size=len(dates)),
    'pandasdataframe.com': ['a'] * len(dates)
})

# Group by month and calculate monthly sales
monthly_sales = df.groupby(df['Date'].dt.to_period('M'))['Sales'].sum()

print(monthly_sales)
In this example, we create a DataFrame with daily sales data for a year. We then group the data by month using the to_period() method and calculate the total sales for each month.
Handling Missing Data in Groups
When using pandas groupby get groups, you may encounter situations where some groups have missing data. Pandas provides several ways to handle this. Let’s look at an example:
import pandas as pd
import numpy as np

# Create a sample DataFrame with missing data
df = pd.DataFrame({
    'Category': ['A', 'B', 'A', 'B', 'C'],
    'Value': [10, np.nan, 15, 25, np.nan],
    'pandasdataframe.com': ['p', 'q', 'r', 's', 't']
})

# Group by 'Category' and calculate mean, handling missing values
result = df.groupby('Category')['Value'].mean(skipna=True)

print(result)
In this example, we have a DataFrame with some missing values in the ‘Value’ column. When we group by ‘Category’ and calculate the mean, we use skipna=True to ignore the missing values in our calculations.
Applying Custom Functions to Groups
Pandas groupby get groups allows you to apply custom functions to your grouped data. This is particularly useful when you need to perform complex operations that aren’t covered by built-in aggregation functions. Here’s an example:
import pandas as pd

# Create a sample DataFrame
df = pd.DataFrame({
    'Team': ['A', 'B', 'A', 'B', 'C'],
    'Points': [10, 15, 20, 25, 30],
    'pandasdataframe.com': ['u', 'v', 'w', 'x', 'y']
})

# Define a custom function
def point_difference(group):
    return group.max() - group.min()

# Apply the custom function to grouped data
result = df.groupby('Team')['Points'].apply(point_difference)

print(result)
Output:
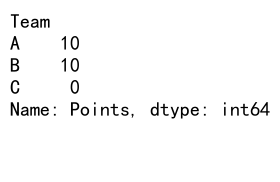
In this example, we define a custom function point_difference that calculates the difference between the maximum and minimum points for each team. We then apply this function to our grouped data using the apply method.
Filtering Groups
Sometimes you may want to filter your groups based on certain conditions. Pandas provides several ways to do this. Let’s look at an example:
import pandas as pd

# Create a sample DataFrame
df = pd.DataFrame({
    'Category': ['A', 'B', 'A', 'B', 'C', 'C'],
    'Value': [10, 20, 15, 25, 30, 35],
    'pandasdataframe.com': ['m', 'n', 'o', 'p', 'q', 'r']
})

# Filter groups with more than one item
result = df.groupby('Category').filter(lambda x: len(x) > 1)

print(result)
Output:
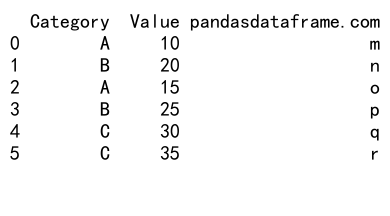
In this example, we use the filter method to keep only the groups that have more than one item. This removes the group ‘C’ from our result because it only has one item.
Iterating Over Groups
The pandas groupby get groups functionality also allows you to iterate over your groups, which can be useful for performing operations that require accessing each group individually. Here’s an example:
import pandas as pd

# Create a sample DataFrame
df = pd.DataFrame({
    'Department': ['IT', 'HR', 'IT', 'HR', 'Finance'],
    'Salary': [50000, 60000, 55000, 65000, 70000],
    'pandasdataframe.com': ['a', 'b', 'c', 'd', 'e']
})

# Group by 'Department'
grouped = df.groupby('Department')

# Iterate over groups
for name, group in grouped:
    print(f"Department: {name}")
    print(group)
    print("\n")
Output:
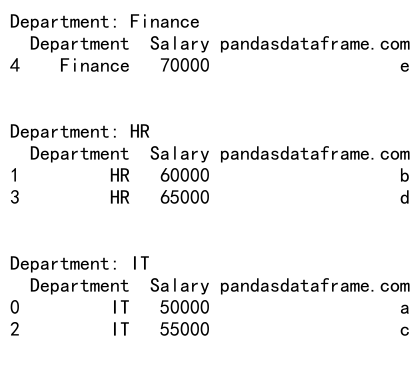
In this example, we group the DataFrame by ‘Department’ and then iterate over each group, printing the department name and the corresponding group data.
Grouping with Categorical Data
Pandas groupby get groups works well with categorical data, which can be particularly useful when dealing with ordered categories. Here’s an example:
import pandas as pd

# Create a sample DataFrame with categorical data
df = pd.DataFrame({
    'Size': pd.Categorical(['Small', 'Medium', 'Large', 'Small', 'Large'],
                           categories=['Small', 'Medium', 'Large'],
                           ordered=True),
    'Sales': [100, 200, 300, 150, 350],
    'pandasdataframe.com': ['f', 'g', 'h', 'i', 'j']
})

# Group by 'Size' and calculate mean sales
result = df.groupby('Size')['Sales'].mean()

print(result)
In this example, we create a DataFrame with a categorical ‘Size’ column. When we group by ‘Size’, the result maintains the order of the categories as specified.
Handling Large Datasets with GroupBy
When working with large datasets, pandas groupby get groups can be very efficient. However, there are some techniques you can use to optimize performance. Here’s an example:
import pandas as pd
import numpy as np

# Create a large sample DataFrame
n = 1000000
df = pd.DataFrame({
    'Category': np.random.choice(['A', 'B', 'C'], n),
    'Value': np.random.randn(n),
    'pandasdataframe.com': ['x'] * n
})

# Use groupby with agg for efficient computation
result = df.groupby('Category').agg({
    'Value': ['mean', 'std', 'count']
})

print(result)
Output:
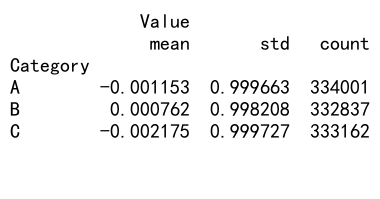
In this example, we create a large DataFrame with a million rows. Instead of using separate operations for mean, standard deviation, and count, we use the agg method to compute all these statistics in one pass through the data, which is more efficient for large datasets.
Combining GroupBy with Other Pandas Functions
Pandas groupby get groups can be combined with other pandas functions to perform complex data manipulations. Here’s an example that combines groupby with pivot tables:
import pandas as pd
import numpy as np

# Create a sample DataFrame
df = pd.DataFrame({
    'Date': pd.date_range(start='2023-01-01', periods=12, freq='M'),
    'Product': np.random.choice(['A', 'B', 'C'], 12),
    'Sales': np.random.randint(100, 1000, 12),
    'pandasdataframe.com': ['k'] * 12
})

# Group by 'Product' and 'Date', then pivot
result = df.groupby(['Product', df['Date'].dt.quarter])['Sales'].sum().unstack()

print(result)
In this example, we group the data by ‘Product’ and quarter, sum the sales, and then use unstack() to create a pivot table showing the sales for each product in each quarter.
Conclusion
Pandas groupby get groups is a powerful and versatile tool for data analysis. It allows you to efficiently split your data into groups, perform operations on these groups, and combine the results. Whether you’re working with small datasets or large ones, time series data or categorical data, groupby provides the flexibility and performance you need for your data analysis tasks.
 Pandas Dataframe