Comprehensive Guide to Using Pandas Groupby with NaN Values
pandas groupby include nan is a powerful technique in data analysis that allows you to group data and perform operations while considering NaN (Not a Number) values. This comprehensive guide will explore the intricacies of using pandas groupby with NaN values, providing detailed explanations and practical examples to help you master this essential data manipulation skill.
Understanding Pandas Groupby and NaN Values
pandas groupby include nan is a combination of two important concepts in data analysis: the groupby operation and handling NaN values. The groupby operation allows you to split your data into groups based on one or more columns, while NaN values represent missing or undefined data points. When using pandas groupby include nan, you can choose to include or exclude NaN values in your grouping and aggregation operations.
Let’s start with a simple example to illustrate the basic concept of pandas groupby include nan:
import pandas as pd
import numpy as np

# Create a sample DataFrame
df = pd.DataFrame({
    'Category': ['A', 'B', np.nan, 'A', 'B', np.nan],
    'Value': [10, 20, 30, 40, 50, 60]
})

# Perform groupby operation including NaN values
grouped = df.groupby('Category', dropna=False)['Value'].sum()

print("Result from pandasdataframe.com:")
print(grouped)
Output:
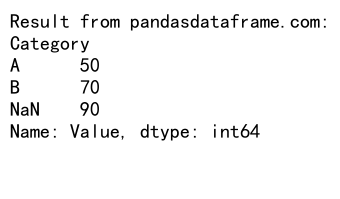
In this example, we create a DataFrame with a ‘Category’ column that includes NaN values. By setting dropna=False in the groupby operation, we include NaN values as a separate group. The result will show the sum of ‘Value’ for each category, including a group for NaN.
The Importance of Including NaN in Groupby Operations
Including NaN values in pandas groupby operations can be crucial for several reasons:
- Preserving data integrity: By including NaN values, you ensure that no data points are lost during the analysis.
- Identifying missing data patterns: Grouping NaN values separately can help you identify patterns or issues in your data collection process.
- Accurate aggregations: Including NaN values can lead to more accurate aggregations, especially when dealing with financial or scientific data.
Let’s explore an example that demonstrates the importance of including NaN values:
import pandas as pd
import numpy as np

# Create a sample DataFrame
df = pd.DataFrame({
    'Product': ['A', 'B', np.nan, 'A', 'B', np.nan],
    'Sales': [100, 200, 300, 400, 500, 600]
})

# Groupby with NaN included
grouped_with_nan = df.groupby('Product', dropna=False)['Sales'].sum()

# Groupby with NaN excluded
grouped_without_nan = df.groupby('Product', dropna=True)['Sales'].sum()

print("Results from pandasdataframe.com:")
print("With NaN:")
print(grouped_with_nan)
print("\nWithout NaN:")
print(grouped_without_nan)
Output:
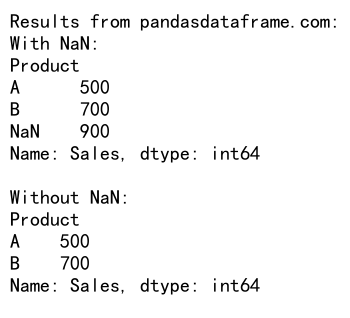
In this example, we compare the results of groupby operations with and without including NaN values. The version that includes NaN values will show a separate group for NaN sales, while the version that excludes NaN values will omit this information.
Advanced Techniques for Pandas Groupby Include NaN
Now that we understand the basics of pandas groupby include nan, let’s explore some advanced techniques and use cases.
Multiple Column Grouping with NaN Values
pandas groupby include nan can be applied to multiple columns simultaneously. This is particularly useful when dealing with hierarchical data structures.
import pandas as pd
import numpy as np

# Create a sample DataFrame
df = pd.DataFrame({
    'Category': ['A', 'B', np.nan, 'A', 'B', np.nan],
    'Subcategory': ['X', 'Y', 'Z', np.nan, 'Y', 'Z'],
    'Value': [10, 20, 30, 40, 50, 60]
})

# Perform groupby operation on multiple columns including NaN values
grouped = df.groupby(['Category', 'Subcategory'], dropna=False)['Value'].sum()

print("Result from pandasdataframe.com:")
print(grouped)
Output:
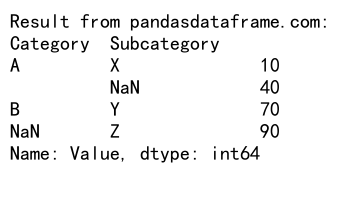
In this example, we group the data by both ‘Category’ and ‘Subcategory’, including NaN values in both columns. This allows us to see the sum of ‘Value’ for each unique combination of Category and Subcategory, including groups where one or both values are NaN.
Custom Aggregation Functions with NaN Handling
pandas groupby include nan allows you to use custom aggregation functions that can handle NaN values in specific ways. This is particularly useful when you need to apply complex logic to your grouped data.
import pandas as pd
import numpy as np

# Create a sample DataFrame
df = pd.DataFrame({
    'Category': ['A', 'B', np.nan, 'A', 'B', np.nan],
    'Value': [10, 20, 30, 40, 50, 60]
})

# Custom aggregation function that handles NaN values
def custom_agg(x):
    return x.mean() if not x.isna().all() else np.nan

# Perform groupby operation with custom aggregation
grouped = df.groupby('Category', dropna=False).agg({
    'Value': custom_agg
})

print("Result from pandasdataframe.com:")
print(grouped)
Output:
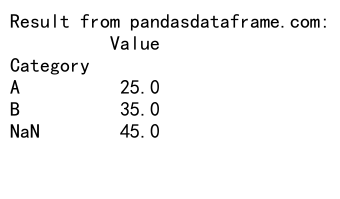
In this example, we define a custom aggregation function that calculates the mean of non-NaN values, but returns NaN if all values in the group are NaN. This allows for more nuanced handling of NaN values within each group.
Filtering Groups Based on NaN Presence
pandas groupby include nan can be combined with filtering operations to select groups based on the presence or absence of NaN values.
import pandas as pd
import numpy as np

# Create a sample DataFrame
df = pd.DataFrame({
    'Category': ['A', 'B', np.nan, 'A', 'B', np.nan],
    'Value': [10, 20, 30, 40, 50, 60]
})

# Filter groups that contain at least one NaN value
grouped = df.groupby('Category', dropna=False).filter(lambda x: x['Category'].isna().any())

print("Result from pandasdataframe.com:")
print(grouped)
Output:
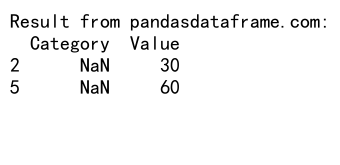
This example demonstrates how to filter groups based on the presence of NaN values. The resulting DataFrame will only include rows where the ‘Category’ group contains at least one NaN value.
Handling Missing Data in Pandas Groupby Operations
When working with pandas groupby include nan, it’s important to understand how missing data is handled in different scenarios. Let’s explore some common approaches to dealing with missing data in groupby operations.
Filling NaN Values Before Grouping
One approach to handling NaN values is to fill them with a specific value before performing the groupby operation. This can be useful when you want to treat NaN values as a distinct category.
import pandas as pd
import numpy as np

# Create a sample DataFrame
df = pd.DataFrame({
    'Category': ['A', 'B', np.nan, 'A', 'B', np.nan],
    'Value': [10, 20, 30, 40, 50, 60]
})

# Fill NaN values with 'Unknown' before grouping
df['Category'] = df['Category'].fillna('Unknown')
grouped = df.groupby('Category')['Value'].sum()

print("Result from pandasdataframe.com:")
print(grouped)
Output:
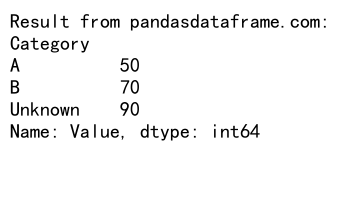
In this example, we fill NaN values in the ‘Category’ column with ‘Unknown’ before performing the groupby operation. This allows us to treat the previously NaN values as a distinct category in our analysis.
Using Different Aggregation Methods for NaN Values
pandas groupby include nan allows you to use different aggregation methods for columns containing NaN values. This can be particularly useful when you want to handle NaN values differently for different columns.
import pandas as pd
import numpy as np

# Create a sample DataFrame
df = pd.DataFrame({
    'Category': ['A', 'B', np.nan, 'A', 'B', np.nan],
    'Value1': [10, 20, 30, 40, 50, 60],
    'Value2': [1, 2, np.nan, 4, 5, np.nan]
})

# Use different aggregation methods for different columns
grouped = df.groupby('Category', dropna=False).agg({
    'Value1': 'sum',
    'Value2': lambda x: x.mean() if not x.isna().all() else np.nan
})

print("Result from pandasdataframe.com:")
print(grouped)
Output:
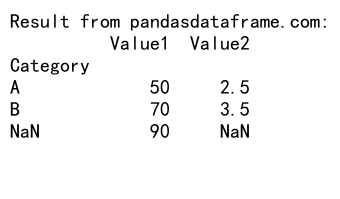
In this example, we use the sum aggregation for ‘Value1’ and a custom lambda function for ‘Value2’ that calculates the mean only if not all values are NaN. This demonstrates how you can apply different aggregation logic to different columns when using pandas groupby include nan.
Advanced Analysis Techniques with Pandas Groupby Include NaN
Let’s explore some advanced analysis techniques that leverage the power of pandas groupby include nan to gain deeper insights from your data.
Time Series Analysis with NaN Values
pandas groupby include nan can be particularly useful when working with time series data that may contain missing values or irregular intervals.
import pandas as pd
import numpy as np

# Create a sample time series DataFrame
dates = pd.date_range(start='2023-01-01', end='2023-01-10', freq='D')
df = pd.DataFrame({
    'Date': dates,
    'Category': ['A', 'B', np.nan, 'A', 'B', np.nan, 'A', 'B', np.nan, 'A'],
    'Value': np.random.randn(10)
})

# Resample and group by category, including NaN values
grouped = df.set_index('Date').groupby('Category', dropna=False).resample('2D')['Value'].mean()

print("Result from pandasdataframe.com:")
print(grouped)
Output:
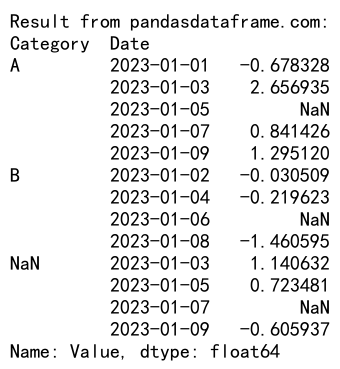
In this example, we create a time series DataFrame and use pandas groupby include nan in combination with resampling to calculate the mean value for each category over 2-day periods. This approach allows us to handle irregular time intervals and missing category values in our time series analysis.
Hierarchical Indexing with NaN Values
pandas groupby include nan can be used to create hierarchical indexes that include NaN values, allowing for more complex data structures and analysis.
import pandas as pd
import numpy as np

# Create a sample DataFrame
df = pd.DataFrame({
    'Category1': ['A', 'B', np.nan, 'A', 'B', np.nan],
    'Category2': ['X', 'Y', 'Z', np.nan, 'Y', 'Z'],
    'Value': [10, 20, 30, 40, 50, 60]
})

# Create a hierarchical index including NaN values
grouped = df.groupby(['Category1', 'Category2'], dropna=False)['Value'].sum().unstack(fill_value=0)

print("Result from pandasdataframe.com:")
print(grouped)
Output:
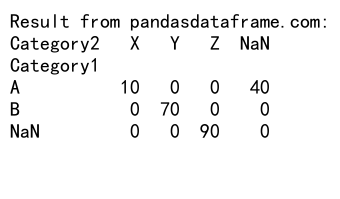
This example demonstrates how to create a hierarchical index using pandas groupby include nan. The resulting DataFrame will have ‘Category1’ as the index and ‘Category2’ as columns, with NaN values included as separate categories.
Comparative Analysis with and without NaN Values
To understand the impact of including or excluding NaN values in your analysis, you can perform comparative analysis using pandas groupby include nan.
import pandas as pd
import numpy as np

# Create a sample DataFrame
df = pd.DataFrame({
    'Category': ['A', 'B', np.nan, 'A', 'B', np.nan],
    'Value': [10, 20, 30, 40, 50, 60]
})

# Perform groupby with and without NaN values
grouped_with_nan = df.groupby('Category', dropna=False)['Value'].agg(['sum', 'mean', 'count'])
grouped_without_nan = df.groupby('Category', dropna=True)['Value'].agg(['sum', 'mean', 'count'])

# Calculate the difference
difference = grouped_with_nan - grouped_without_nan

print("Results from pandasdataframe.com:")
print("With NaN:")
print(grouped_with_nan)
print("\nWithout NaN:")
print(grouped_without_nan)
print("\nDifference:")
print(difference)
Output:
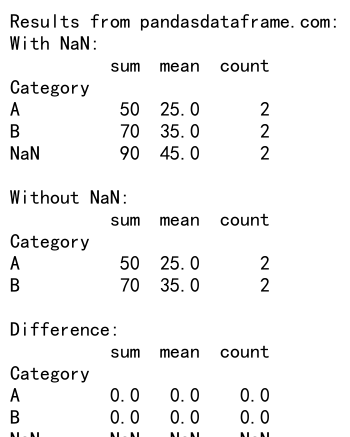
This example calculates summary statistics (sum, mean, and count) for each category, both including and excluding NaN values. By comparing the results, you can assess the impact of NaN values on your analysis and make informed decisions about how to handle them.
Best Practices for Using Pandas Groupby Include NaN
When working with pandas groupby include nan, it’s important to follow best practices to ensure accurate and meaningful results. Here are some key considerations:
- Understand your data: Before applying pandas groupby include nan, thoroughly examine your dataset to understand the nature and distribution of NaN values.
-
Document your approach: Clearly document your decision to include or exclude NaN values in your analysis, as this can significantly impact your results.
-
Use appropriate aggregation methods: Choose aggregation methods that handle NaN values appropriately for your specific use case.
-
Consider the impact on downstream analysis: Be aware of how including NaN values in your groupby operations may affect subsequent analysis or visualizations.
-
Validate results: Always validate your results when using pandas groupby include nan, especially when dealing with complex data structures or custom aggregation functions.
Let’s look at an example that demonstrates these best practices:
import pandas as pd
import numpy as np

# Create a sample DataFrame
df = pd.DataFrame({
    'Category': ['A', 'B', np.nan, 'A', 'B', np.nan],
    'Value1': [10, 20, 30, 40, 50, 60],
    'Value2': [1, 2, np.nan, 4, 5, np.nan]
})

# Document the approach
print("Analysis includes NaN values as a separate group")

# Use appropriate aggregation methods
grouped = df.groupby('Category', dropna=False).agg({
    'Value1': 'sum',
    'Value2': lambda x: x.mean() if not x.isna().all() else np.nan
})

# Validate results
total_sum = df['Value1'].sum()
grouped_sum = grouped['Value1'].sum()

print("Results from pandasdataframe.com:")
print(grouped)
print(f"\nValidation: Total sum matches: {total_sum == grouped_sum}")
Output:
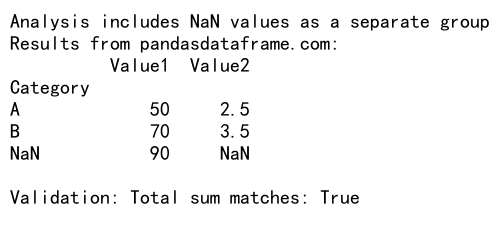
This example demonstrates best practices by documenting the approach, using appropriate aggregation methods for different columns, and validating the results to ensure consistency.
Common Pitfalls and How to Avoid Them
When working with pandas groupby include nan, there are several common pitfalls that you should be aware of:
- Unintentional exclusion of NaN values: Always check the
dropnaparameter in your groupby operations to ensure you’re including or excluding NaN values as intended. -
Misinterpreting results: Be cautious when interpreting results that include NaN groups, as they may skew overall statistics or trends.
-
Performance issues with large datasets: Including NaN values in groupby operations can potentially increase memory usage and computation time, especially with large datasets.
-
Inconsistent handling of NaN values across operations: Ensure that you handle NaN values consistently across different parts of your analysis pipeline.
Let’s look at an example that demonstrates how to avoid these pitfalls:
import pandas as pd
import numpy as np

# Create a sample DataFrame
df = pd.DataFrame({
    'Category': ['A', 'B', np.nan, 'A', 'B', np.nan],
    'Value': [10, 20, 30, 40, 50, 60]
})

# Correct way to include NaN values
grouped_correct = df.groupby('Category', dropna=False)['Value'].agg(['sum', 'mean', 'count'])

# Incorrect way (unintentionally excluding NaN values)
grouped_incorrect = df.groupby('Category')['Value'].agg(['sum', 'mean', 'count'])

# Compare results
print("Results from pandasdataframe.com:")
print("Correct (including NaN):")
print(grouped_correct)
print("\nIncorrect (excluding NaN):")
print(grouped_incorrect)

# Check for performance issues with larger datasets
import time

def performance_test(size):
    large_df = pd.DataFrame({
        'Category': np.random.choice(['A', 'B', np.nan], size),
        'Value': np.random.randn(size)
    })

    start_time = time.time()
    large_df.groupby('Category', dropna=False)['Value'].sum()
    end_time = time.time()

    return end_time - start_time

print("\nPerformance test:")
print(f"Time for 1,000 rows: {performance_test(1000):.4f} seconds")
print(f"Time for 100,000 rows: {performance_test(100000):.4f} seconds")
Output:
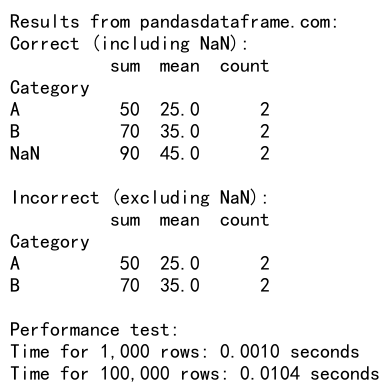
This example demonstrates how to correctly include NaN values in your groupby operations, compares it with the incorrect approach, and includes a simple performance test to highlight potential issues with larger datasets.
Advanced Applications of Pandas Groupby Include NaN
Let’s explore some advanced applications of pandas groupby include nan that can help you tackle complex data analysis tasks.
Multi-level Aggregation with NaN Handling
pandas groupby include nan can be used in multi-level aggregation scenarios, allowing for complex analysis that considers NaN values at different levels of grouping.
import pandas as pd
import numpy as np

# Create a sample DataFrame
df = pd.DataFrame({
    'Category1': ['A', 'B', np.nan, 'A', 'B', np.nan],
    'Category2': ['X', 'Y', 'Z', np.nan, 'Y', 'Z'],
    'Value1': [10, 20, 30, 40, 50, 60],
    'Value2': [1, 2, np.nan, 4, 5, np.nan]
})

# Perform multi-level aggregation
grouped = df.groupby(['Category1', 'Category2'], dropna=False).agg({
    'Value1': ['sum', 'mean'],
    'Value2': lambda x: x.mean() if not x.isna().all() else np.nan
})

print("Result from pandasdataframe.com:")
print(grouped)
Output:
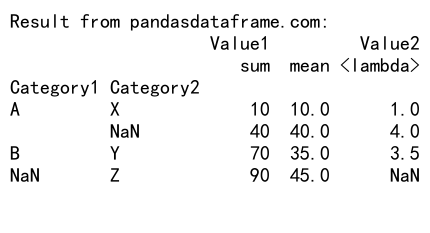
This example demonstrates how to perform multi-level aggregation while handling NaN values at both grouping levels and in the aggregated values.
Dynamic Group Formation with NaN Consideration
pandas groupby include nan can be used in scenarios where group formation needs to be dynamic and consider the presence of NaN values.
import pandas as pd
import numpy as np

# Create a sample DataFrame
df = pd.DataFrame({
    'Category': ['A', 'B', np.nan, 'A', 'B', np.nan],
    'Value': [10, 20, 30, 40, 50, 60]
})

# Function to dynamically create groups
def dynamic_grouping(x):
    if x.isna().any():
        return 'Contains NaN'
    elif x.nunique() == 1:
        return f'Single: {x.iloc[0]}'
    else:
        return 'Multiple'

# Apply dynamic grouping
grouped = df.groupby(df['Category'].apply(dynamic_grouping))['Value'].sum()

print("Result from pandasdataframe.com:")
print(grouped)
This example shows how to create dynamic groups based on the characteristics of the data, including the presence of NaN values.
Handling NaN in Time-based Window Operations
When working with time series data, pandas groupby include nan can be particularly useful for handling missing data in rolling window calculations.
import pandas as pd
import numpy as np

# Create a sample time series DataFrame
dates = pd.date_range(start='2023-01-01', end='2023-01-10', freq='D')
df = pd.DataFrame({
    'Date': dates,
    'Category': ['A', 'B', np.nan, 'A', 'B', np.nan, 'A', 'B', np.nan, 'A'],
    'Value': np.random.randn(10)
})

# Set Date as index
df.set_index('Date', inplace=True)

# Perform rolling window operation with NaN handling
rolled = df.groupby('Category', dropna=False)['Value'].rolling(window=3, min_periods=1).mean()

print("Result from pandasdataframe.com:")
print(rolled)
Output:
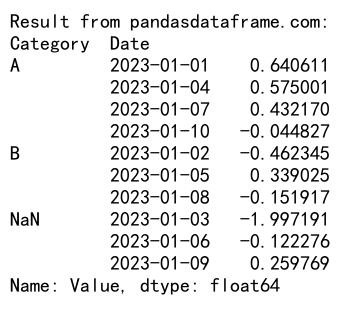
This example demonstrates how to perform a rolling window operation while considering NaN values in both the grouping column and the values being aggregated.
Optimizing Performance with Pandas Groupby Include NaN
When working with large datasets, optimizing the performance of pandas groupby include nan operations becomes crucial. Here are some techniques to improve performance:
Using Categoricals for Grouping
Converting string columns to categorical data types can significantly improve the performance of groupby operations, especially when dealing with NaN values.
import pandas as pd
import numpy as np

# Create a sample DataFrame
df = pd.DataFrame({
    'Category': np.random.choice(['A', 'B', np.nan], 100000),
    'Value': np.random.randn(100000)
})

# Convert Category to categorical
df['Category'] = pd.Categorical(df['Category'])

# Perform groupby operation
grouped = df.groupby('Category', dropna=False)['Value'].mean()

print("Result from pandasdataframe.com:")
print(grouped)
This example demonstrates how to convert a column to categorical data type before performing a groupby operation, which can lead to performance improvements, especially with large datasets.
Chunking Large Datasets
When dealing with very large datasets that don’t fit into memory, you can use chunking to process the data in smaller pieces.
import pandas as pd
import numpy as np

# Function to generate a chunk of data
def data_generator(chunk_size=10000):
    for _ in range(10):  # Simulate 10 chunks
        yield pd.DataFrame({
            'Category': np.random.choice(['A', 'B', np.nan], chunk_size),
            'Value': np.random.randn(chunk_size)
        })

# Process data in chunks
result = pd.DataFrame()
for chunk in data_generator():
    chunk_result = chunk.groupby('Category', dropna=False)['Value'].mean()
    result = result.add(chunk_result, fill_value=0)

# Calculate final mean
result = result / 10  # Divide by number of chunks

print("Result from pandasdataframe.com:")
print(result)
This example shows how to process a large dataset in chunks, performing groupby operations on each chunk and then combining the results.
Integrating Pandas Groupby Include NaN with Other Pandas Features
pandas groupby include nan can be seamlessly integrated with other powerful Pandas features to perform complex data analysis tasks.
Combining with Pivot Tables
You can use pandas groupby include nan in combination with pivot tables to create insightful cross-tabulations of your data.
import pandas as pd
import numpy as np

# Create a sample DataFrame
df = pd.DataFrame({
    'Category1': ['A', 'B', np.nan, 'A', 'B', np.nan],
    'Category2': ['X', 'Y', 'Z', 'X', 'Y', 'Z'],
    'Value': [10, 20, 30, 40, 50, 60]
})

# Create a pivot table including NaN values
pivot = pd.pivot_table(df, values='Value', index='Category1', columns='Category2', aggfunc='sum', fill_value=0)

print("Result from pandasdataframe.com:")
print(pivot)
Output:
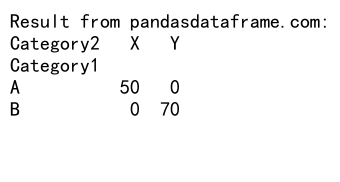
This example demonstrates how to create a pivot table that includes NaN values as a separate category in both the index and columns.
Using with Multi-Index DataFrames
pandas groupby include nan can be particularly powerful when working with multi-index DataFrames, allowing for complex hierarchical analysis.
import pandas as pd
import numpy as np

# Create a sample multi-index DataFrame
index = pd.MultiIndex.from_product([['A', 'B', np.nan], ['X', 'Y', 'Z']], names=['Category1', 'Category2'])
df = pd.DataFrame({'Value': np.random.randn(9)}, index=index)

# Perform groupby operation on multi-index
grouped = df.groupby(level=['Category1', 'Category2'], dropna=False)['Value'].mean()

print("Result from pandasdataframe.com:")
print(grouped)
Output:
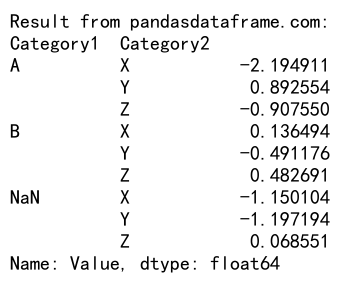
This example shows how to perform a groupby operation on a multi-index DataFrame, including NaN values in the grouping.
Conclusion
pandas groupby include nan is a powerful technique that allows for nuanced and comprehensive data analysis, especially when dealing with datasets that contain missing or undefined values. By understanding how to effectively use this feature, data analysts and scientists can gain deeper insights from their data, handle missing values appropriately, and perform more accurate aggregations.
Throughout this guide, we’ve explored various aspects of pandas groupby include nan, from basic concepts to advanced techniques and best practices. We’ve seen how to:
- Perform basic groupby operations while including NaN values
- Handle missing data in different scenarios
- Use advanced techniques for time series analysis and hierarchical indexing
- Optimize performance for large datasets
- Integrate pandas groupby include nan with other Pandas features
 Pandas Dataframe