Comprehensive Guide: How to Use Pandas Groupby Average All Columns for Efficient Data Analysis
Pandas groupby average all columns is a powerful technique in data analysis that allows you to efficiently summarize and aggregate data across multiple columns in a DataFrame. This method combines the versatility of the groupby operation with the ability to calculate averages for all columns simultaneously, providing a comprehensive view of your data. In this article, we’ll explore the ins and outs of using pandas groupby average all columns, covering various scenarios and providing practical examples to help you master this essential data manipulation skill.
Understanding the Basics of Pandas Groupby Average All Columns
Before diving into the specifics of pandas groupby average all columns, it’s crucial to understand the fundamental concepts behind this operation. The pandas groupby function allows you to split your data into groups based on one or more columns, while the average (or mean) calculation can be applied to all numeric columns within these groups.
Let’s start with a simple example to illustrate the basic usage of pandas groupby average all columns:
import pandas as pd

# Create a sample DataFrame
df = pd.DataFrame({
    'Category': ['A', 'B', 'A', 'B', 'A', 'B'],
    'Value1': [10, 15, 20, 25, 30, 35],
    'Value2': [5, 7, 9, 11, 13, 15]
})

# Perform groupby average on all columns
result = df.groupby('Category').mean()

print("Data from pandasdataframe.com:")
print(result)
Output:
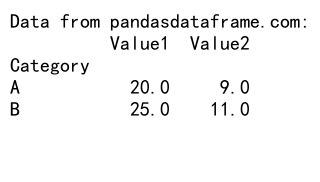
In this example, we create a simple DataFrame with a ‘Category’ column and two numeric columns (‘Value1’ and ‘Value2’). We then use the groupby method to group the data by ‘Category’ and calculate the mean for all numeric columns. The result is a new DataFrame containing the average values for each category.
Advantages of Using Pandas Groupby Average All Columns
Utilizing pandas groupby average all columns offers several advantages in data analysis:
- Efficiency: By applying the average calculation to all columns at once, you save time and reduce the need for multiple operations.
- Consistency: This method ensures that all numeric columns are treated uniformly, reducing the risk of overlooking important data.
- Scalability: As your dataset grows, pandas groupby average all columns can handle large amounts of data without significant performance degradation.
- Flexibility: You can easily modify the grouping criteria or add additional aggregation functions as needed.
Common Use Cases for Pandas Groupby Average All Columns
Pandas groupby average all columns is versatile and can be applied in various scenarios. Here are some common use cases:
1. Analyzing Sales Data
When working with sales data, you might want to calculate average metrics across different product categories or regions. Here’s an example:
import pandas as pd

# Create a sample sales DataFrame
sales_df = pd.DataFrame({
    'Product': ['A', 'B', 'A', 'B', 'A', 'B'],
    'Region': ['East', 'West', 'East', 'West', 'East', 'West'],
    'Units_Sold': [100, 150, 120, 180, 90, 200],
    'Revenue': [1000, 1500, 1200, 1800, 900, 2000]
})

# Calculate average sales metrics by product and region
avg_sales = sales_df.groupby(['Product', 'Region']).mean()

print("Sales data from pandasdataframe.com:")
print(avg_sales)
Output:
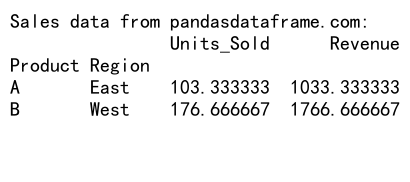
This example demonstrates how to use pandas groupby average all columns to analyze sales data across multiple dimensions (Product and Region) and calculate average units sold and revenue.
2. Summarizing Financial Data
Financial analysts often need to summarize large datasets by various criteria. Here’s how you can use pandas groupby average all columns for this purpose:
import pandas as pd

# Create a sample financial DataFrame
financial_df = pd.DataFrame({
    'Company': ['X', 'Y', 'Z', 'X', 'Y', 'Z'],
    'Year': [2020, 2020, 2020, 2021, 2021, 2021],
    'Revenue': [1000000, 1500000, 2000000, 1200000, 1800000, 2200000],
    'Expenses': [800000, 1200000, 1600000, 950000, 1400000, 1800000],
    'Profit': [200000, 300000, 400000, 250000, 400000, 400000]
})

# Calculate average financial metrics by company
avg_financials = financial_df.groupby('Company').mean()

print("Financial data from pandasdataframe.com:")
print(avg_financials)
Output:
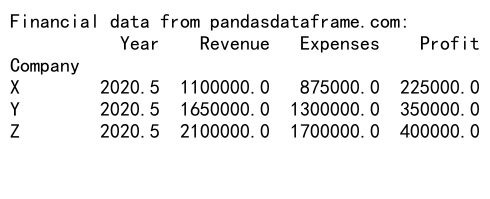
This example shows how to use pandas groupby average all columns to summarize financial data for different companies, providing average revenue, expenses, and profit figures.
Advanced Techniques with Pandas Groupby Average All Columns
While the basic usage of pandas groupby average all columns is straightforward, there are several advanced techniques you can employ to enhance your data analysis:
1. Handling Non-Numeric Columns
When using pandas groupby average all columns, non-numeric columns are typically excluded from the calculation. However, you can explicitly select numeric columns if needed:
import pandas as pd

# Create a sample DataFrame with mixed data types
mixed_df = pd.DataFrame({
    'Category': ['A', 'B', 'A', 'B', 'A', 'B'],
    'Value1': [10, 15, 20, 25, 30, 35],
    'Value2': [5, 7, 9, 11, 13, 15],
    'Text': ['abc', 'def', 'ghi', 'jkl', 'mno', 'pqr']
})

# Select numeric columns and calculate average
numeric_cols = mixed_df.select_dtypes(include=[np.number]).columns
avg_result = mixed_df.groupby('Category')[numeric_cols].mean()

print("Data from pandasdataframe.com:")
print(avg_result)
This example demonstrates how to handle mixed data types by selecting only numeric columns for the average calculation.
2. Applying Multiple Aggregation Functions
You can combine the average calculation with other aggregation functions using the agg method:
import pandas as pd

# Create a sample DataFrame
df = pd.DataFrame({
    'Category': ['A', 'B', 'A', 'B', 'A', 'B'],
    'Value1': [10, 15, 20, 25, 30, 35],
    'Value2': [5, 7, 9, 11, 13, 15]
})

# Apply multiple aggregation functions
result = df.groupby('Category').agg({
    'Value1': ['mean', 'sum', 'count'],
    'Value2': ['mean', 'min', 'max']
})

print("Data from pandasdataframe.com:")
print(result)
Output:
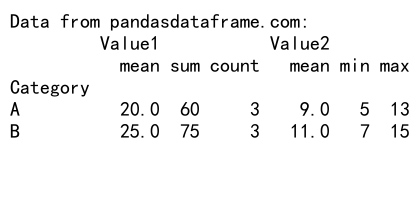
This example shows how to apply different aggregation functions to specific columns while still using the average for others.
3. Handling Missing Values
When dealing with missing values in your dataset, you can specify how pandas groupby average all columns should handle them:
import pandas as pd
import numpy as np

# Create a sample DataFrame with missing values
df_with_na = pd.DataFrame({
    'Category': ['A', 'B', 'A', 'B', 'A', 'B'],
    'Value1': [10, 15, np.nan, 25, 30, 35],
    'Value2': [5, np.nan, 9, 11, 13, 15]
})

# Calculate average, ignoring NaN values
avg_ignore_na = df_with_na.groupby('Category').mean()

# Calculate average, including NaN values (which will propagate)
avg_with_na = df_with_na.groupby('Category').mean(skipna=False)

print("Data from pandasdataframe.com (ignoring NaN):")
print(avg_ignore_na)
print("\nData from pandasdataframe.com (including NaN):")
print(avg_with_na)
This example illustrates how to handle missing values when using pandas groupby average all columns, either by ignoring them or including them in the calculation.
Best Practices for Using Pandas Groupby Average All Columns
To make the most of pandas groupby average all columns, consider the following best practices:
- Data Cleaning: Ensure your data is clean and properly formatted before applying groupby operations.
- Column Selection: Be mindful of which columns you include in your groupby operation, especially when dealing with mixed data types.
- Memory Management: For large datasets, consider using chunking or iterative processing to manage memory usage.
- Performance Optimization: Use appropriate data types and indexing to improve performance when working with large datasets.
Here’s an example that demonstrates some of these best practices:
import pandas as pd

# Create a sample large DataFrame
large_df = pd.DataFrame({
    'Category': ['A', 'B', 'C'] * 1000000,
    'Value1': range(3000000),
    'Value2': range(0, 6000000, 2)
})

# Optimize data types
large_df['Category'] = large_df['Category'].astype('category')
large_df['Value1'] = large_df['Value1'].astype('int32')
large_df['Value2'] = large_df['Value2'].astype('int32')

# Set index for faster groupby operation
large_df.set_index('Category', inplace=True)

# Perform groupby average on all columns
result = large_df.groupby(level=0).mean()

print("Data from pandasdataframe.com:")
print(result)
This example demonstrates how to optimize a large DataFrame for better performance when using pandas groupby average all columns.
Common Pitfalls and How to Avoid Them
When working with pandas groupby average all columns, be aware of these common pitfalls:
- Unintended Data Type Conversions: Groupby operations can sometimes change data types. Always check your output types.
- Memory Issues with Large Datasets: For very large datasets, consider using alternatives like Dask or Vaex for out-of-memory computations.
- Incorrect Handling of Missing Values: Be explicit about how you want to handle NaN values in your calculations.
Here’s an example that addresses these pitfalls:
import pandas as pd
import numpy as np

# Create a sample DataFrame with potential pitfalls
df_pitfalls = pd.DataFrame({
    'Category': ['A', 'B', 'A', 'B', 'A', 'B'],
    'Value1': [10, 15, np.nan, 25, 30, 35],
    'Value2': [5.5, 7.2, 9.1, 11.3, 13.7, 15.9]
})

# Perform groupby average, explicitly handling data types and NaN values
result = df_pitfalls.groupby('Category').agg({
    'Value1': lambda x: x.mean(skipna=True),
    'Value2': lambda x: x.astype(float).mean(skipna=True)
})

print("Data from pandasdataframe.com:")
print(result)
print(result.dtypes)
Output:
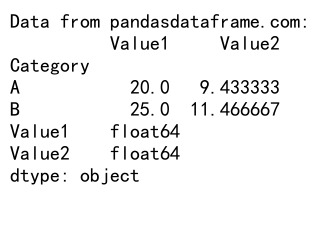
This example shows how to handle potential pitfalls by explicitly specifying data types and NaN handling in the groupby operation.
Comparing Pandas Groupby Average All Columns with Other Methods
While pandas groupby average all columns is a powerful tool, it’s worth comparing it with other methods to understand its strengths and limitations:
1. Pandas Groupby Average All Columns vs. Manual Column-by-Column Calculation
import pandas as pd

# Create a sample DataFrame
df = pd.DataFrame({
    'Category': ['A', 'B', 'A', 'B', 'A', 'B'],
    'Value1': [10, 15, 20, 25, 30, 35],
    'Value2': [5, 7, 9, 11, 13, 15]
})

# Using pandas groupby average all columns
result_groupby = df.groupby('Category').mean()

# Manual column-by-column calculation
result_manual = pd.DataFrame({
    'Value1': df.groupby('Category')['Value1'].mean(),
    'Value2': df.groupby('Category')['Value2'].mean()
})

print("Data from pandasdataframe.com (groupby method):")
print(result_groupby)
print("\nData from pandasdataframe.com (manual method):")
print(result_manual)
Output:
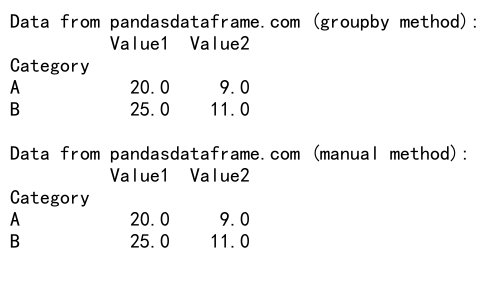
This example compares the concise pandas groupby average all columns method with a manual column-by-column calculation, highlighting the efficiency of the former.
2. Pandas Groupby Average All Columns vs. SQL Aggregation
While not a direct comparison in Python, it’s worth noting that pandas groupby average all columns is similar to SQL’s GROUP BY clause with AVG function. Here’s a conceptual comparison:
import pandas as pd
import sqlite3

# Create a sample DataFrame
df = pd.DataFrame({
    'Category': ['A', 'B', 'A', 'B', 'A', 'B'],
    'Value1': [10, 15, 20, 25, 30, 35],
    'Value2': [5, 7, 9, 11, 13, 15]
})

# Using pandas groupby average all columns
result_pandas = df.groupby('Category').mean()

# Using SQL-like operation (for demonstration, we'll use SQLite)
conn = sqlite3.connect(':memory:')
df.to_sql('data', conn, index=False)
cursor = conn.cursor()
cursor.execute('''
    SELECT Category, AVG(Value1) as Avg_Value1, AVG(Value2) as Avg_Value2
    FROM data
    GROUP BY Category
''')
result_sql = pd.DataFrame(cursor.fetchall(), columns=['Category', 'Avg_Value1', 'Avg_Value2'])
result_sql.set_index('Category', inplace=True)

print("Data from pandasdataframe.com (pandas method):")
print(result_pandas)
print("\nData from pandasdataframe.com (SQL-like method):")
print(result_sql)
Output:
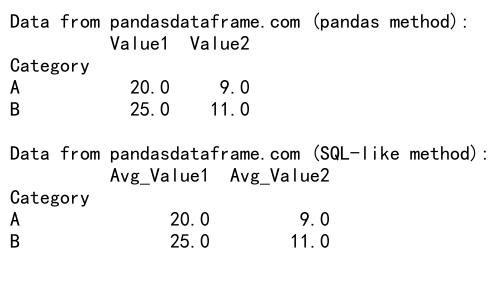
This example demonstrates the similarity between pandas groupby average all columns and SQL aggregation, showing how pandas provides a more integrated approach within Python.
Real-World Applications of Pandas Groupby Average All Columns
Pandas groupby average all columns has numerous real-world applications across various industries. Here are a few examples:
1. Customer Segmentation in Marketing
Marketers often need to segment customers based on average behavior across multiple metrics:
import pandas as pd
import numpy as np

# Create a sample customer DataFrame
np.random.seed(0)
customer_df = pd.DataFrame({
    'Customer_ID': range(1000),
    'Age': np.random.randint(18, 80, 1000),
    'Income': np.random.randint(20000, 200000, 1000),
    'Spending': np.random.randint(1000, 50000, 1000),
    'Loyalty_Score': np.random.randint(1, 11, 1000)
})

# Define age groups
customer_df['Age_Group'] = pd.cut(customer_df['Age'], bins=[0, 30, 50, 70, 100], labels=['18-30', '31-50', '51-70', '71+'])

# Calculate average metrics by age group
customer_segments = customer_df.groupby('Age_Group').mean()

print("Customer data from pandasdataframe.com:")
print(customer_segments)
This example shows how to use pandas groupby average all columns to segment customers based on age groups and calculate average metrics for each segment.
2. Stock Market Analysis
Financial analysts can use pandas groupby average all columns to analyze stock performance across different sectors:
import pandas as pd
import numpy as np

# Create a sample stock market DataFrame
np.random.seed(0)
stock_df = pd.DataFrame({
    'Date': pd.date_range(start='2022-01-01', periods=100),
    'Stock': np.random.choice(['AAPL', 'GOOGL', 'MSFT', 'AMZN'], 100),
    'Sector': np.random.choice(['Tech', 'Retail', 'Finance'], 100),
    'Price': np.random.uniform(100, 1000, 100),
    'Volume': np.random.randint(1000, 100000, 100)
})

# Calculate average price and volume by sector
sector_performance = stock_df.groupby('Sector')[['Price', 'Volume']].mean()

print("Stock market data from pandasdataframe.com:")
print(sector_performance)
Output:
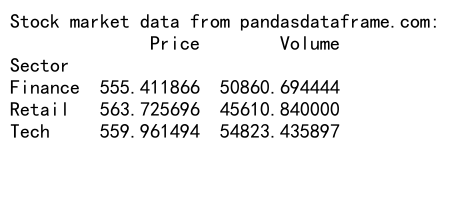
This example demonstrates how to use pandas groupby average all columns to analyze average stock prices and trading volumes across different market sectors.
Advanced Features and Extensions of Pandas Groupby Average All Columns
As you become more proficient with pandas groupby average all columns, you can explore more advanced features and extensions:
1. Using Custom Aggregation Functions
You can define custom aggregation functions to use with pandas groupby:
import pandas as pd
import numpy as np

# Create a sample DataFrame
df = pd.DataFrame({
    'Category': ['A', 'B', 'A', 'B', 'A', 'B'],
    'Value1': [10, 15, 20, 25, 30, 35],
    'Value2': [5, 7, 9, 11, 13, 15]
})

# Define a custom aggregation function
def weighted_average(group):
    return np.average(group['Value1'], weights=group['Value2'])

# Apply custom function along with standard aggregations
result = df.groupby('Category').agg({
    'Value1': ['mean', weighted_average],
    'Value2': ['mean', 'sum']
})

print("Data from pandasdataframe.com:")
print(result)
This example shows how to use a custom weighted average function alongside standard aggregations in pandas groupby average all columns.
2. Combining Groupby with Window Functions
You can combine groupby operations with window functions for more complex analyses:
import pandas as pd

# Create a sample DataFrame
df = pd.DataFrame({
    'Date': pd.date_range(start='2022-01-01', periods=10),
    'Category': ['A', 'B'] * 5,
    'Value': [10, 15, 20, 25, 30, 35, 40, 45, 50, 55]
})

# Calculate rolling average within each group
df['Rolling_Avg'] = df.groupby('Category')['Value'].transform(lambda x: x.rolling(window=3, min_periods=1).mean())

print("Data from pandasdataframe.com:")
print(df)
Output:
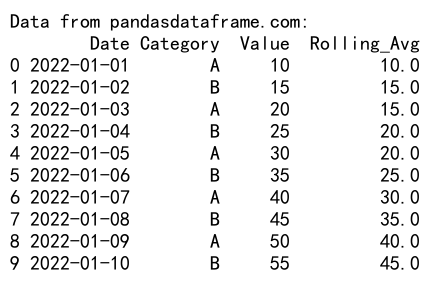
This example demonstrates how to calculate a rolling average within each category using pandas groupby combined with a window function.
Optimizing Performance with Pandas Groupby Average All Columns
When working with large datasets, optimizing the performance of pandas groupby average all columns becomes crucial. Here are some techniques to improve efficiency:
1. Using Categorical Data Types
Converting string columns to categorical data types can significantly improve groupby performance:
import pandas as pd
import numpy as np

# Create a large sample DataFrame
n = 1000000
df = pd.DataFrame({
    'Category': np.random.choice(['A', 'B', 'C', 'D'], n),
    'Value1': np.random.rand(n),
    'Value2': np.random.rand(n)
})

# Convert 'Category' to categorical
df['Category'] = df['Category'].astype('category')

# Perform groupby average
result = df.groupby('Category').mean()

print("Data from pandasdataframe.com:")
print(result)
This example shows how to convert a string column to categorical type for improved performance in pandas groupby average all columns operations.
2. Chunking Large Datasets
For very large datasets that don’t fit in memory, you can process the data in chunks:
import pandas as pd
import numpy as np

# Function to generate chunks of data
def data_generator(n_chunks, chunk_size):
    for _ in range(n_chunks):
        yield pd.DataFrame({
            'Category': np.random.choice(['A', 'B', 'C', 'D'], chunk_size),
            'Value1': np.random.rand(chunk_size),
            'Value2': np.random.rand(chunk_size)
        })

# Process data in chunks
result = pd.DataFrame()
for chunk in data_generator(n_chunks=10, chunk_size=100000):
    chunk_result = chunk.groupby('Category').mean()
    result = result.add(chunk_result, fill_value=0)

# Calculate final average
result = result / 10

print("Data from pandasdataframe.com:")
print(result)
Output:
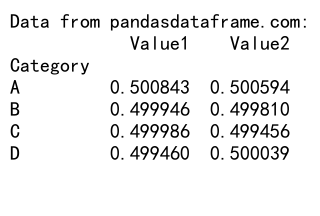
This example demonstrates how to process large datasets in chunks using pandas groupby average all columns, allowing for efficient memory usage.
Integrating Pandas Groupby Average All Columns with Other Libraries
Pandas groupby average all columns can be integrated with other popular data science libraries for more advanced analyses:
1. Visualization with Matplotlib
You can easily visualize the results of pandas groupby average all columns using Matplotlib:
import pandas as pd
import matplotlib.pyplot as plt

# Create a sample DataFrame
df = pd.DataFrame({
    'Category': ['A', 'B', 'C', 'A', 'B', 'C'],
    'Value1': [10, 15, 20, 25, 30, 35],
    'Value2': [5, 7, 9, 11, 13, 15]
})

# Perform groupby average
result = df.groupby('Category').mean()

# Create a bar plot
result.plot(kind='bar', figsize=(10, 6))
plt.title('Average Values by Category')
plt.xlabel('Category')
plt.ylabel('Average Value')
plt.legend(title='Metric')
plt.tight_layout()
plt.show()

print("Data from pandasdataframe.com visualized using Matplotlib")
Output:
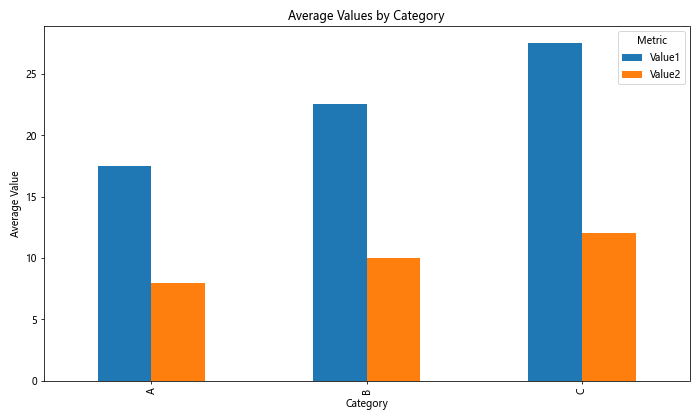
This example shows how to create a bar plot of the results from pandas groupby average all columns using Matplotlib.
2. Statistical Analysis with SciPy
You can combine pandas groupby average all columns with SciPy for more advanced statistical analyses:
import pandas as pd
import numpy as np
from scipy import stats

# Create a sample DataFrame
np.random.seed(0)
df = pd.DataFrame({
    'Group': np.repeat(['A', 'B'], 50),
    'Value': np.concatenate([np.random.normal(10, 2, 50), np.random.normal(12, 2, 50)])
})

# Perform groupby to get group means
group_means = df.groupby('Group')['Value'].mean()

# Perform t-test between groups
group_a = df[df['Group'] == 'A']['Value']
group_b = df[df['Group'] == 'B']['Value']
t_stat, p_value = stats.ttest_ind(group_a, group_b)

print("Data from pandasdataframe.com:")
print(group_means)
print(f"\nt-statistic: {t_stat}")
print(f"p-value: {p_value}")
Output:
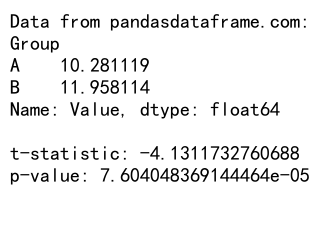
This example demonstrates how to combine pandas groupby average all columns with SciPy to perform a t-test between two groups.
Pandas groupby average all columns Conclusion
Pandas groupby average all columns is a powerful and versatile tool for data analysis, offering efficient ways to summarize and aggregate data across multiple dimensions. Throughout this article, we’ve explored various aspects of this technique, from basic usage to advanced applications and optimizations.
Key takeaways include:
1. The simplicity and efficiency of using pandas groupby average all columns for data summarization.
2. The flexibility to handle various data types and scenarios, including missing values and custom aggregations.
3. The importance of optimizing performance when working with large datasets.
4. The ability to integrate pandas groupby average all columns with other data science libraries for more comprehensive analyses.
 Pandas Dataframe