Mastering Pandas GroupBy and Agg: A Comprehensive Guide to Data Aggregation
Pandas groupby agg is a powerful combination of functions in the pandas library that allows for efficient and flexible data aggregation. This article will dive deep into the world of pandas groupby agg, exploring their functionalities, use cases, and best practices. We’ll cover everything from basic grouping operations to advanced aggregation techniques, providing you with the knowledge and tools to effectively analyze and summarize your data using pandas groupby agg.
Introduction to Pandas GroupBy and Agg
Pandas groupby agg is a fundamental concept in data analysis and manipulation. The groupby operation allows you to split your data into groups based on one or more columns, while the agg function enables you to perform various aggregation operations on these groups. Together, pandas groupby agg provides a powerful way to summarize and analyze your data efficiently.
Let’s start with a simple example to illustrate the basic usage of pandas groupby agg:
import pandas as pd

# Create a sample DataFrame
df = pd.DataFrame({
    'Name': ['John', 'Emma', 'John', 'Emma', 'Mike'],
    'Age': [25, 30, 25, 30, 35],
    'Score': [80, 85, 90, 95, 88]
})

# Group by 'Name' and calculate the mean 'Score'
result = df.groupby('Name')['Score'].agg('mean')

print(result)
Output:
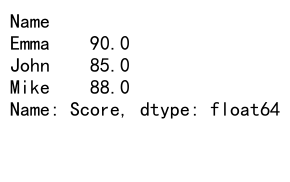
In this example, we create a DataFrame with information about students, including their names, ages, and scores. We then use pandas groupby agg to group the data by the ‘Name’ column and calculate the mean score for each student. The agg function is used to specify the aggregation operation, which in this case is ‘mean’.
Understanding the GroupBy Operation
The groupby operation in pandas is the first step in performing aggregations on grouped data. It allows you to split your DataFrame into groups based on one or more columns. Let’s explore the various ways to use groupby in pandas:
Single Column Grouping
Grouping by a single column is the most common use case for pandas groupby agg. Here’s an example:
import pandas as pd

# Create a sample DataFrame
df = pd.DataFrame({
    'Category': ['A', 'B', 'A', 'B', 'C'],
    'Value': [10, 20, 15, 25, 30]
})

# Group by 'Category' and calculate the sum of 'Value'
result = df.groupby('Category')['Value'].sum()

print(result)
Output:
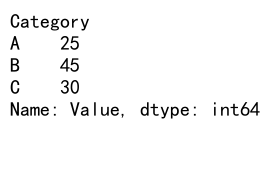
In this example, we group the DataFrame by the ‘Category’ column and calculate the sum of ‘Value’ for each category. The pandas groupby agg operation creates a new Series with the categories as the index and the sum of values as the data.
Multiple Column Grouping
Pandas groupby agg also supports grouping by multiple columns. This is useful when you want to create more specific groups based on multiple criteria. Here’s an example:
import pandas as pd

# Create a sample DataFrame
df = pd.DataFrame({
    'Category': ['A', 'B', 'A', 'B', 'C'],
    'Subcategory': ['X', 'Y', 'X', 'Z', 'Y'],
    'Value': [10, 20, 15, 25, 30]
})

# Group by 'Category' and 'Subcategory', then calculate the mean of 'Value'
result = df.groupby(['Category', 'Subcategory'])['Value'].mean()

print(result)
Output:
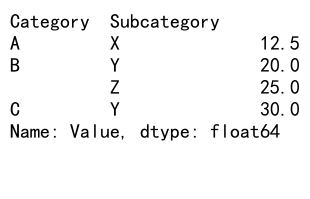
In this example, we use pandas groupby agg to group the DataFrame by both ‘Category’ and ‘Subcategory’ columns, then calculate the mean of ‘Value’ for each unique combination of category and subcategory.
Grouping with Custom Functions
Pandas groupby agg allows you to use custom functions for grouping. This is particularly useful when you need to group based on complex conditions. Here’s an example:
import pandas as pd

# Create a sample DataFrame
df = pd.DataFrame({
    'Name': ['John', 'Emma', 'Mike', 'Sarah'],
    'Age': [25, 30, 35, 28],
    'Score': [80, 85, 90, 88]
})

# Define a custom grouping function
def age_group(age):
    if age < 30:
        return 'Young'
    else:
        return 'Senior'

# Group by the custom age group and calculate the mean score
result = df.groupby(df['Age'].apply(age_group))['Score'].mean()

print(result)
Output:
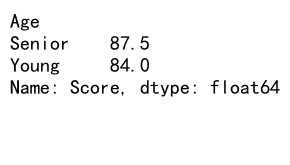
In this example, we define a custom function age_group that categorizes ages into ‘Young’ and ‘Senior’ groups. We then use pandas groupby agg with this custom function to group the data and calculate the mean score for each age group.
Exploring the Agg Function
The agg function in pandas is a versatile tool that allows you to apply multiple aggregation operations to grouped data. Let’s explore the various ways to use agg with pandas groupby:
Basic Aggregation
The most straightforward use of pandas groupby agg is to apply a single aggregation function to one or more columns. Here’s an example:
import pandas as pd

# Create a sample DataFrame
df = pd.DataFrame({
    'Category': ['A', 'B', 'A', 'B', 'C'],
    'Value1': [10, 20, 15, 25, 30],
    'Value2': [5, 10, 7, 12, 15]
})

# Group by 'Category' and calculate the sum of 'Value1' and 'Value2'
result = df.groupby('Category').agg('sum')

print(result)
Output:
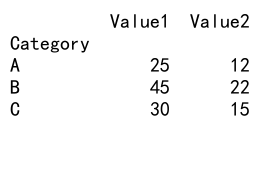
In this example, we use pandas groupby agg to group the DataFrame by ‘Category’ and calculate the sum of both ‘Value1’ and ‘Value2’ columns for each category.
Multiple Aggregations
Pandas groupby agg allows you to apply different aggregation functions to different columns. Here’s an example:
import pandas as pd

# Create a sample DataFrame
df = pd.DataFrame({
    'Category': ['A', 'B', 'A', 'B', 'C'],
    'Value1': [10, 20, 15, 25, 30],
    'Value2': [5, 10, 7, 12, 15]
})

# Group by 'Category' and apply different aggregations to each column
result = df.groupby('Category').agg({
    'Value1': 'mean',
    'Value2': ['min', 'max']
})

print(result)
Output:
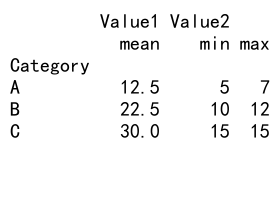
In this example, we use pandas groupby agg to group the DataFrame by ‘Category’ and apply different aggregations to each column. We calculate the mean of ‘Value1’ and both the minimum and maximum of ‘Value2’ for each category.
Custom Aggregation Functions
Pandas groupby agg supports custom aggregation functions, allowing you to define your own aggregation logic. Here’s an example:
import pandas as pd

# Create a sample DataFrame
df = pd.DataFrame({
    'Category': ['A', 'B', 'A', 'B', 'C'],
    'Value': [10, 20, 15, 25, 30]
})

# Define a custom aggregation function
def custom_agg(x):
    return x.max() - x.min()

# Group by 'Category' and apply the custom aggregation function
result = df.groupby('Category')['Value'].agg(custom_agg)

print(result)
Output:
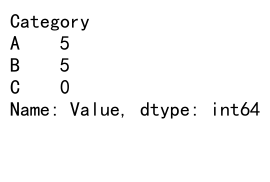
In this example, we define a custom aggregation function custom_agg that calculates the range (maximum minus minimum) of the values. We then use pandas groupby agg to apply this custom function to the ‘Value’ column for each category.
Advanced Techniques with Pandas GroupBy and Agg
Now that we’ve covered the basics of pandas groupby agg, let’s explore some advanced techniques and use cases:
Hierarchical Indexing
Pandas groupby agg can create hierarchical indexes when grouping by multiple columns. Here’s an example:
import pandas as pd

# Create a sample DataFrame
df = pd.DataFrame({
    'Category': ['A', 'B', 'A', 'B', 'C'],
    'Subcategory': ['X', 'Y', 'X', 'Z', 'Y'],
    'Value1': [10, 20, 15, 25, 30],
    'Value2': [5, 10, 7, 12, 15]
})

# Group by 'Category' and 'Subcategory', then apply multiple aggregations
result = df.groupby(['Category', 'Subcategory']).agg({
    'Value1': ['mean', 'sum'],
    'Value2': ['min', 'max']
})

print(result)
Output:
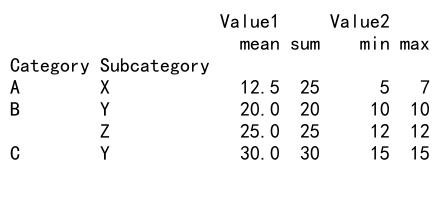
In this example, we use pandas groupby agg to group the DataFrame by both ‘Category’ and ‘Subcategory’, creating a hierarchical index. We then apply multiple aggregations to ‘Value1’ and ‘Value2’ columns.
Renaming Aggregation Results
When using pandas groupby agg with multiple aggregations, you may want to rename the resulting columns for clarity. Here’s how you can do that:
import pandas as pd

# Create a sample DataFrame
df = pd.DataFrame({
    'Category': ['A', 'B', 'A', 'B', 'C'],
    'Value1': [10, 20, 15, 25, 30],
    'Value2': [5, 10, 7, 12, 15]
})

# Group by 'Category' and apply multiple aggregations with custom names
result = df.groupby('Category').agg({
    'Value1': [('Average', 'mean'), ('Total', 'sum')],
    'Value2': [('Minimum', 'min'), ('Maximum', 'max')]
})

print(result)
Output:
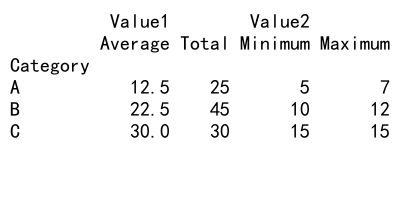
In this example, we use pandas groupby agg to apply multiple aggregations and provide custom names for the resulting columns. This makes the output more readable and easier to interpret.
Filtering Groups
Pandas groupby agg allows you to filter groups based on certain conditions. Here’s an example:
import pandas as pd

# Create a sample DataFrame
df = pd.DataFrame({
    'Category': ['A', 'B', 'A', 'B', 'C', 'C'],
    'Value': [10, 20, 15, 25, 30, 35]
})

# Group by 'Category', calculate the mean, and filter groups with mean > 20
result = df.groupby('Category').filter(lambda x: x['Value'].mean() > 20)

print(result)
Output:
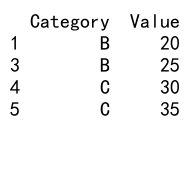
In this example, we use pandas groupby agg to group the DataFrame by ‘Category’ and then filter the groups to include only those with a mean ‘Value’ greater than 20.
Transforming Groups
Pandas groupby agg provides a transform method that allows you to apply a function to each group and broadcast the result back to the original DataFrame. Here’s an example:
import pandas as pd

# Create a sample DataFrame
df = pd.DataFrame({
    'Category': ['A', 'B', 'A', 'B', 'C'],
    'Value': [10, 20, 15, 25, 30]
})

# Group by 'Category' and calculate the percentage of each value within its group
result = df.groupby('Category')['Value'].transform(lambda x: x / x.sum() * 100)

df['Percentage'] = result
print(df)
Output:
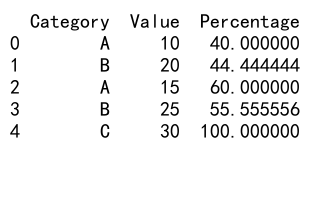
In this example, we use pandas groupby agg with the transform method to calculate the percentage of each ‘Value’ within its ‘Category’ group. The result is then added as a new column to the original DataFrame.
Real-World Applications of Pandas GroupBy and Agg
Pandas groupby agg has numerous real-world applications across various domains. Let’s explore some common use cases:
Financial Analysis
In financial analysis, pandas groupby agg is often used to analyze stock data, calculate portfolio performance, and generate financial reports. Here’s an example:
import pandas as pd
import numpy as np

# Create a sample DataFrame of stock data
dates = pd.date_range('2023-01-01', periods=100)
stocks = ['AAPL', 'GOOGL', 'MSFT', 'AMZN']
df = pd.DataFrame({
    'Date': np.repeat(dates, len(stocks)),
    'Stock': np.tile(stocks, len(dates)),
    'Price': np.random.rand(len(dates) * len(stocks)) * 1000 + 100
})

# Calculate monthly average price for each stock
monthly_avg = df.groupby([df['Date'].dt.to_period('M'), 'Stock'])['Price'].mean().unstack()

print(monthly_avg)
Output:
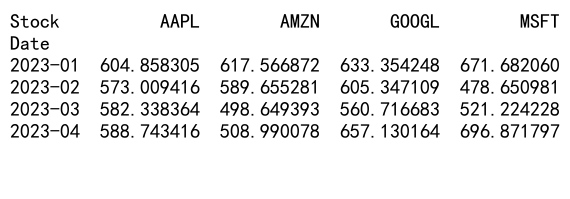
In this example, we use pandas groupby agg to calculate the monthly average price for each stock. This type of analysis is common in financial reporting and portfolio management.
Customer Segmentation
Pandas groupby agg is useful for customer segmentation in marketing and sales analytics. Here’s an example:
import pandas as pd
import numpy as np

# Create a sample DataFrame of customer data
n_customers = 1000
df = pd.DataFrame({
    'CustomerID': range(n_customers),
    'Age': np.random.randint(18, 80, n_customers),
    'Gender': np.random.choice(['M', 'F'], n_customers),
    'PurchaseAmount': np.random.rand(n_customers) * 1000
})

# Segment customers by age group and gender, calculate average purchase amount
def age_group(age):
    if age < 30:
        return 'Young'
    elif age < 60:
        return 'Middle-aged'
    else:
        return 'Senior'

result = df.groupby([df['Age'].apply(age_group), 'Gender'])['PurchaseAmount'].agg(['mean', 'count'])

print(result)
Output:
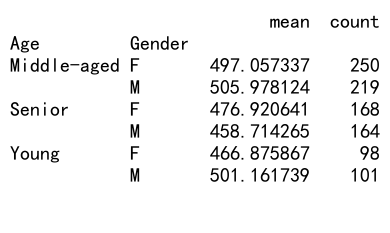
In this example, we use pandas groupby agg to segment customers by age group and gender, then calculate the average purchase amount and count for each segment. This type of analysis helps in targeted marketing and understanding customer behavior.
Advanced Aggregation Techniques
Let’s explore some advanced aggregation techniques using pandas groupby agg:
Rolling Window Aggregations
Pandas groupby agg can be combined with rolling window functions to perform moving aggregations within groups. Here’s an example:
import pandas as pd
import numpy as np

# Create a sample DataFrame
df = pd.DataFrame({
    'Date': pd.date_range('2023-01-01', periods=100),
    'Category': np.random.choice(['A', 'B', 'C'], 100),
    'Value': np.random.rand(100) * 100
})

# Calculate 7-day rolling average for each category
result = df.set_index('Date').groupby('Category')['Value'].rolling(window=7).mean().reset_index()

print(result)
Output:
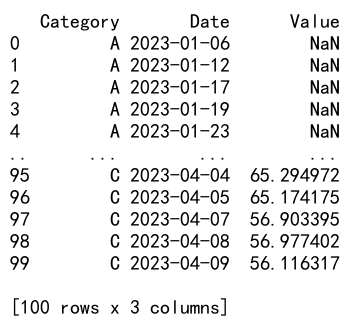
In this example, we use pandas groupby agg with a rolling window function to calculate the 7-day rolling average of ‘Value’ for each ‘Category’.
Expanding Window Aggregations
Similar to rolling windows, pandas groupby agg can be used with expanding windows to perform cumulative aggregations within groups. Here’s an example:
import pandas as pd
import numpy as np

# Create a sample DataFrame
df = pd.DataFrame({
    'Date': pd.date_range('2023-01-01', periods=100),
    'Category': np.random.choice(['A', 'B', 'C'], 100),
    'Value': np.random.rand(100) * 100
})

# Calculate cumulative sum for each category
result = df.set_index('Date').groupby('Category')['Value'].expanding().sum().reset_index()

print(result)
Output:
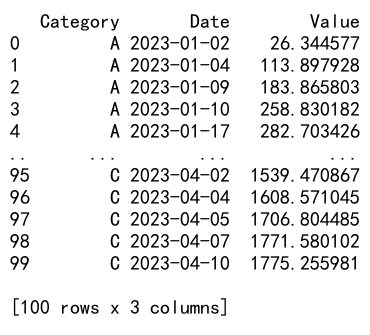
In this example, we use pandas groupby agg with an expanding window to calculate the cumulative sum of ‘Value’ for each ‘Category’.
Custom Aggregation with Lambda Functions
Pandas groupby agg allows you to use lambda functions for custom aggregations. This is useful for complex calculations that can’t be easily expressed with built-in aggregation functions. Here’s an example:
import pandas as pd
import numpy as np

# Create a sample DataFrame
df = pd.DataFrame({
    'Category': ['A', 'B', 'A', 'B', 'C'],
    'Value1': [10, 20, 15, 25, 30],
    'Value2': [5, 10, 7, 12, 15]
})

# Custom aggregation using lambda functions
result = df.groupby('Category').agg({
    'Value1': 'mean',
    'Value2': lambda x: np.percentile(x, 75)  # 75th percentile
})

print(result)
Output:
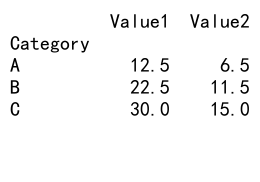
In this example, we use pandas groupby agg with a lambda function to calculate the 75th percentile of ‘Value2’ for each ‘Category’.
Handling Missing Data in GroupBy and Agg Operations
When working with real-world data, it’s common to encounter missing values. Pandas groupby agg provides several ways to handle missing data during aggregation:
Excluding Missing Values
By default, pandas groupby agg excludes missing values when performing aggregations. Here’s an example:
import pandas as pd
import numpy as np

# Create a sample DataFrame with missing values
df = pd.DataFrame({
    'Category': ['A', 'B', 'A', 'B', 'C'],
    'Value': [10, np.nan, 15, 25, 30]
})

# Calculate mean, excluding missing values
result = df.groupby('Category')['Value'].mean()

print(result)
Output:
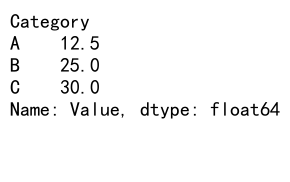
In this example, pandas groupby agg automatically excludes the NaN value when calculating the mean for category ‘B’.
Including Missing Values
If you want to include missing values in your aggregations, you can use the skipna=False parameter in some aggregation functions. Here’s an example:
import pandas as pd
import numpy as np

# Create a sample DataFrame with missing values
df = pd.DataFrame({
    'Category': ['A', 'B', 'A', 'B', 'C'],
    'Value': [10, np.nan, 15, 25, 30]
})

# Calculate mean, including missing values
result = df.groupby('Category')['Value'].agg(lambda x: x.mean(skipna=False))

print(result)
Output:
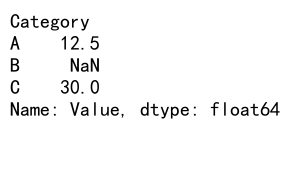
In this example, we use a lambda function with skipna=False to include the NaN value when calculating the mean for category ‘B’.
Filling Missing Values
You can also fill missing values before performing aggregations using pandas groupby agg. Here’s an example:
import pandas as pd
import numpy as np

# Create a sample DataFrame with missing values
df = pd.DataFrame({
    'Category': ['A', 'B', 'A', 'B', 'C'],
    'Value': [10, np.nan, 15, 25, 30]
})

# Fill missing values with the mean of each category, then calculate the sum
result = df.groupby('Category')['Value'].apply(lambda x: x.fillna(x.mean()).sum())

print(result)
Output:
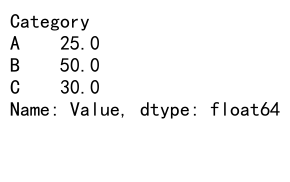
In this example, we use pandas groupby agg with a custom function to fill missing values with the mean of each category before calculating the sum.
Combining GroupBy and Agg with Other Pandas Operations
Pandas groupby agg can be combined with other pandas operations to perform more complex data manipulations. Here are some examples:
Merging After Aggregation
You can use the results of a groupby agg operation to merge with other DataFrames. Here’s an example:
import pandas as pd
import numpy as np

# Create sample DataFrames
df1 = pd.DataFrame({
    'Category': ['A', 'B', 'C', 'A', 'B'],
    'Value': [10, 20, 30, 15, 25]
})

df2 = pd.DataFrame({
    'Category': ['A', 'B', 'C'],
    'Multiplier': [2, 3, 4]
})

# Perform groupby and aggregation
agg_result = df1.groupby('Category')['Value'].mean().reset_index()

# Merge the aggregation result with df2
final_result = pd.merge(agg_result, df2, on='Category')

print(final_result)
Output:
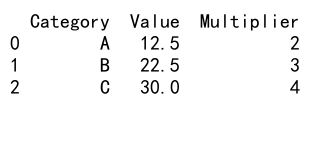
In this example, we first use pandas groupby agg to calculate the mean ‘Value’ for each ‘Category’, and then merge the result with another DataFrame containing additional information.
Applying Functions After Aggregation
You can apply additional functions to the result of a groupby agg operation. Here’s an example:
import pandas as pd
import numpy as np

# Create a sample DataFrame
df = pd.DataFrame({
    'Category': ['A', 'B', 'C', 'A', 'B'],
    'Value': [10, 20, 30, 15, 25]
})

# Perform groupby, aggregation, and then apply a function
result = df.groupby('Category')['Value'].agg(['mean', 'sum']).apply(lambda x: x['sum'] / x['mean'], axis=1)

print(result)
Output:
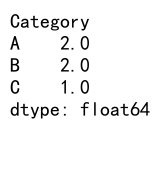
In this example, we use pandas groupby agg to calculate the mean and sum of ‘Value’ for each ‘Category’, and then apply a custom function to compute the ratio of sum to mean.
Pandas groupby agg Conclusion
Pandas groupby agg is a powerful tool for data analysis and manipulation in Python. Throughout this comprehensive guide, we’ve explored the various aspects of pandas groupby agg, from basic usage to advanced techniques and optimizations. We’ve seen how pandas groupby agg can be used to efficiently summarize and analyze data, handle missing values, improve performance, and combine with other pandas operations.
 Pandas Dataframe