Comprehensive Guide to Pandas GroupBy Aggregate Multiple Columns
Pandas groupby aggregate multiple columns is a powerful technique for data analysis and manipulation in Python. This article will dive deep into the intricacies of using pandas groupby to aggregate multiple columns, providing you with a comprehensive understanding of this essential data processing method. We’ll explore various aspects of pandas groupby aggregate multiple columns, including its syntax, common use cases, and advanced techniques.
Understanding Pandas GroupBy Aggregate Multiple Columns
Pandas groupby aggregate multiple columns is a process that allows you to group data based on one or more columns and then apply aggregate functions to multiple columns simultaneously. This technique is particularly useful when dealing with large datasets and performing complex data analysis tasks.
Let’s start with a simple example to illustrate the basic concept of pandas groupby aggregate multiple columns:
import pandas as pd

# Create a sample DataFrame
df = pd.DataFrame({
    'Name': ['John', 'Jane', 'John', 'Jane', 'Mike'],
    'City': ['New York', 'London', 'New York', 'Paris', 'Tokyo'],
    'Sales': [100, 150, 200, 300, 250],
    'Profit': [20, 30, 40, 60, 50]
})

# Perform groupby and aggregate multiple columns
result = df.groupby('Name').agg({
    'Sales': 'sum',
    'Profit': 'mean'
})

print(result)
Output:
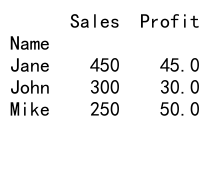
In this example, we group the data by the ‘Name’ column and then aggregate the ‘Sales’ column by summing its values and the ‘Profit’ column by calculating its mean. This demonstrates the basic usage of pandas groupby aggregate multiple columns.
Advanced Techniques for Pandas GroupBy Aggregate Multiple Columns
Now that we’ve covered the basics, let’s explore some more advanced techniques for pandas groupby aggregate multiple columns.
Multiple Aggregation Functions
One of the powerful features of pandas groupby aggregate multiple columns is the ability to apply multiple aggregation functions to the same column. Here’s an example:
import pandas as pd

# Create a sample DataFrame
df = pd.DataFrame({
    'Category': ['A', 'B', 'A', 'B', 'A'],
    'Value1': [10, 20, 30, 40, 50],
    'Value2': [100, 200, 300, 400, 500]
})

# Apply multiple aggregation functions
result = df.groupby('Category').agg({
    'Value1': ['sum', 'mean', 'max'],
    'Value2': ['min', 'std']
})

print(result)
Output:
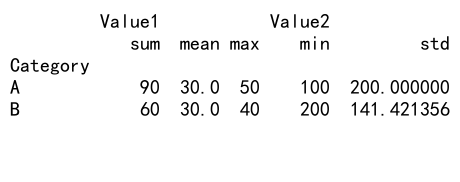
In this example, we apply multiple aggregation functions to different columns using pandas groupby aggregate multiple columns. The ‘Value1’ column is aggregated using sum, mean, and max functions, while the ‘Value2’ column is aggregated using min and std (standard deviation) functions.
Custom Aggregation Functions
Pandas groupby aggregate multiple columns also allows you to use custom aggregation functions. Here’s an example:
import pandas as pd
import numpy as np

# Create a sample DataFrame
df = pd.DataFrame({
    'Group': ['A', 'B', 'A', 'B', 'A'],
    'Value': [1, 2, 3, 4, 5]
})

# Define a custom aggregation function
def custom_agg(x):
    return np.sum(x) / np.max(x)

# Apply custom aggregation function
result = df.groupby('Group').agg({
    'Value': ['sum', 'mean', custom_agg]
})

print(result)
Output:
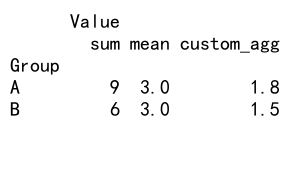
In this example, we define a custom aggregation function custom_agg and use it alongside built-in functions in our pandas groupby aggregate multiple columns operation.
Named Aggregations
Pandas groupby aggregate multiple columns supports named aggregations, which can make your code more readable and easier to maintain. Here’s an example:
import pandas as pd

# Create a sample DataFrame
df = pd.DataFrame({
    'Date': pd.date_range(start='2023-01-01', periods=5),
    'Product': ['A', 'B', 'A', 'B', 'A'],
    'Sales': [100, 150, 200, 250, 300],
    'Quantity': [10, 15, 20, 25, 30]
})

# Perform named aggregations
result = df.groupby('Product').agg(
    Total_Sales=('Sales', 'sum'),
    Avg_Quantity=('Quantity', 'mean'),
    Last_Sale_Date=('Date', 'max')
)

print(result)
Output:

In this example, we use named aggregations to specify the column names for our aggregated results, making the output more intuitive and easier to work with.
Handling Missing Values in Pandas GroupBy Aggregate Multiple Columns
When working with real-world data, you often encounter missing values. Let’s explore how to handle missing values when using pandas groupby aggregate multiple columns:
import pandas as pd
import numpy as np

# Create a sample DataFrame with missing values
df = pd.DataFrame({
    'Group': ['A', 'B', 'A', 'B', 'A'],
    'Value1': [1, np.nan, 3, 4, 5],
    'Value2': [10, 20, np.nan, 40, 50]
})

# Handle missing values during aggregation
result = df.groupby('Group').agg({
    'Value1': lambda x: x.fillna(x.mean()).sum(),
    'Value2': lambda x: x.dropna().prod()
})

print(result)
Output:
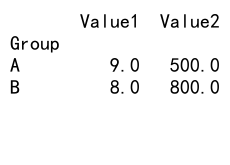
In this example, we use lambda functions to handle missing values differently for each column. For ‘Value1’, we fill missing values with the mean before summing, and for ‘Value2’, we drop missing values before calculating the product.
Combining Multiple DataFrames with Pandas GroupBy Aggregate Multiple Columns
Pandas groupby aggregate multiple columns can be particularly useful when working with multiple DataFrames. Let’s look at an example:
import pandas as pd

# Create two sample DataFrames
df1 = pd.DataFrame({
    'ID': [1, 2, 3, 4, 5],
    'Name': ['John', 'Jane', 'Mike', 'Emily', 'David'],
    'Department': ['Sales', 'HR', 'Sales', 'IT', 'HR']
})

df2 = pd.DataFrame({
    'ID': [1, 2, 3, 4, 5, 1, 2, 3, 4, 5],
    'Date': pd.date_range(start='2023-01-01', periods=10),
    'Sales': [100, 150, 200, 250, 300, 120, 180, 220, 270, 320]
})

# Merge DataFrames and perform groupby aggregate
merged_df = pd.merge(df1, df2, on='ID')
result = merged_df.groupby(['Department', 'Name']).agg({
    'Sales': ['sum', 'mean'],
    'Date': ['min', 'max']
})

print(result)
Output:
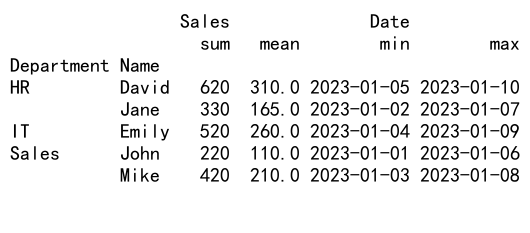
In this example, we merge two DataFrames and then use pandas groupby aggregate multiple columns to analyze the combined data, grouping by both ‘Department’ and ‘Name’.
Combining GroupBy with Transform in Pandas
The transform method can be powerful when used in combination with pandas groupby aggregate multiple columns. Here’s an example:
import pandas as pd

# Create a sample DataFrame
df = pd.DataFrame({
    'Group': ['A', 'B', 'A', 'B', 'A'],
    'Value': [1, 2, 3, 4, 5]
})

# Use transform with groupby
df['Group_Mean'] = df.groupby('Group')['Value'].transform('mean')
df['Normalized'] = df['Value'] / df['Group_Mean']

print(df)
Output:
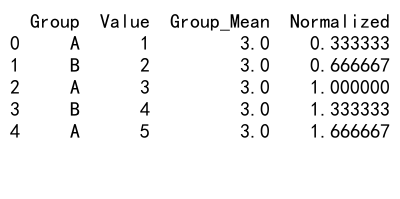
In this example, we use transform to calculate the mean value for each group and then use it to normalize the ‘Value’ column.
Handling Categorical Data with Pandas GroupBy Aggregate Multiple Columns
Categorical data requires special handling when using pandas groupby aggregate multiple columns. Let’s explore an example:
import pandas as pd

# Create a sample DataFrame with categorical data
df = pd.DataFrame({
    'Category': pd.Categorical(['A', 'B', 'C', 'A', 'B'], categories=['A', 'B', 'C', 'D']),
    'Value1': [1, 2, 3, 4, 5],
    'Value2': [10, 20, 30, 40, 50]
})

# Perform groupby aggregate on categorical data
result = df.groupby('Category', observed=True).agg({
    'Value1': 'sum',
    'Value2': 'mean'
})

print(result)
Output:
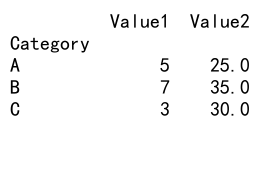
In this example, we use a categorical column for grouping and demonstrate how to handle unused categories in the groupby operation.
Conclusion
Pandas groupby aggregate multiple columns is a versatile and powerful tool for data analysis and manipulation. Throughout this article, we’ve explored various aspects of this technique, from basic usage to advanced applications. We’ve covered topics such as handling missing values, working with time-based data, dealing with hierarchical indexing, and efficiently processing large datasets.
By mastering pandas groupby aggregate multiple columns, you’ll be able to perform complex data analyses with ease, extract meaningful insights from your data, and streamline your data processing workflows. Remember to experiment with different aggregation functions, explore custom aggregations, and combine groupby operations with other pandas functionalities to unlock the full potential of your data analysis tasks.
 Pandas Dataframe