Mastering Pandas GroupBy: Combining Two Columns for Powerful Data Analysis
Pandas groupby combine two columns is a powerful technique in data analysis that allows you to aggregate and manipulate data based on multiple columns simultaneously. This article will explore the various aspects of using pandas groupby to combine two columns, providing detailed explanations and practical examples to help you master this essential skill.
Understanding Pandas GroupBy and Column Combination
Pandas groupby combine two columns is a fundamental concept in data manipulation and analysis. It allows you to group data based on multiple criteria and perform operations on the resulting groups. By combining two columns in a groupby operation, you can create more complex and meaningful aggregations that provide deeper insights into your data.
Let’s start with a basic example to illustrate how pandas groupby combine two columns works:
import pandas as pd

# Create a sample DataFrame
df = pd.DataFrame({
    'Name': ['John', 'Emma', 'John', 'Emma', 'Mike', 'Mike'],
    'City': ['New York', 'London', 'New York', 'Paris', 'Tokyo', 'Tokyo'],
    'Sales': [100, 200, 150, 300, 250, 180]
})

# Group by Name and City, then calculate the mean Sales
result = df.groupby(['Name', 'City'])['Sales'].mean()

print(result)
Output:
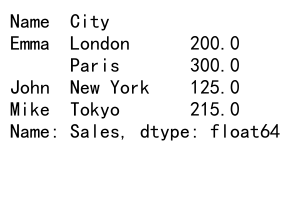
In this example, we use pandas groupby combine two columns (‘Name’ and ‘City’) to calculate the average sales for each unique combination of name and city. This demonstrates the basic concept of grouping by multiple columns and performing an aggregation.
Benefits of Using Pandas GroupBy with Multiple Columns
Pandas groupby combine two columns offers several advantages in data analysis:
- Increased granularity: By grouping on multiple columns, you can create more specific and detailed aggregations.
- Deeper insights: Combining columns allows you to uncover patterns and relationships that may not be apparent when grouping by a single column.
- Flexibility: You can easily add or remove columns from the groupby operation to adjust the level of detail in your analysis.
- Efficient data manipulation: Grouping by multiple columns enables you to perform complex operations on your data in a single step.
Common Use Cases for Pandas GroupBy Combine Two Columns
There are numerous scenarios where pandas groupby combine two columns can be particularly useful:
- Sales analysis by product and region
- Customer behavior analysis by demographic and purchase history
- Time series analysis by date and category
- Performance metrics by department and employee
- Financial analysis by account type and transaction date
Let’s explore some of these use cases with practical examples.
Sales Analysis by Product and Region
import pandas as pd

# Create a sample sales DataFrame
sales_df = pd.DataFrame({
    'Product': ['A', 'B', 'A', 'B', 'C', 'C'],
    'Region': ['East', 'West', 'East', 'East', 'West', 'West'],
    'Sales': [1000, 1500, 1200, 800, 2000, 1800]
})

# Group by Product and Region, then calculate total sales
result = sales_df.groupby(['Product', 'Region'])['Sales'].sum()

print(result)
Output:
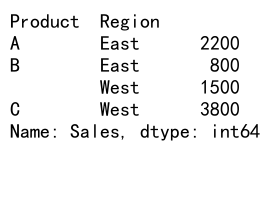
In this example, we use pandas groupby combine two columns (‘Product’ and ‘Region’) to calculate the total sales for each product in each region. This analysis helps identify which products perform best in different geographical areas.
Customer Behavior Analysis by Age Group and Purchase Category
import pandas as pd

# Create a sample customer purchase DataFrame
purchases_df = pd.DataFrame({
    'Customer': ['C1', 'C2', 'C3', 'C1', 'C2', 'C3'],
    'Age_Group': ['18-25', '26-35', '36-45', '18-25', '26-35', '36-45'],
    'Category': ['Electronics', 'Clothing', 'Home', 'Clothing', 'Electronics', 'Home'],
    'Amount': [500, 300, 800, 200, 600, 400]
})

# Group by Age_Group and Category, then calculate average purchase amount
result = purchases_df.groupby(['Age_Group', 'Category'])['Amount'].mean()

print(result)
Output:
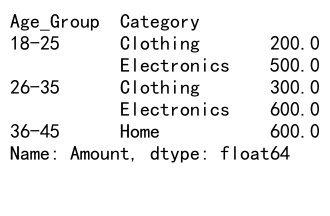
This example demonstrates how to use pandas groupby combine two columns (‘Age_Group’ and ‘Category’) to analyze average purchase amounts across different age groups and product categories. This information can be valuable for targeted marketing strategies.
Advanced Techniques for Pandas GroupBy Combine Two Columns
Now that we’ve covered the basics, let’s explore some more advanced techniques for using pandas groupby combine two columns.
Multiple Aggregations
You can perform multiple aggregations in a single groupby operation:
import pandas as pd

# Create a sample DataFrame
df = pd.DataFrame({
    'Name': ['John', 'Emma', 'John', 'Emma', 'Mike', 'Mike'],
    'City': ['New York', 'London', 'New York', 'Paris', 'Tokyo', 'Tokyo'],
    'Sales': [100, 200, 150, 300, 250, 180],
    'Units': [10, 15, 12, 20, 18, 14]
})

# Group by Name and City, then calculate multiple aggregations
result = df.groupby(['Name', 'City']).agg({
    'Sales': ['sum', 'mean'],
    'Units': ['sum', 'max']
})

print(result)
Output:
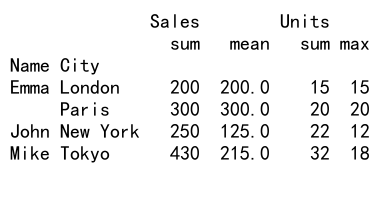
This example shows how to use pandas groupby combine two columns to perform multiple aggregations on different columns simultaneously. We calculate the sum and mean of ‘Sales’, and the sum and max of ‘Units’ for each unique combination of ‘Name’ and ‘City’.
Custom Aggregation Functions
You can also use custom functions with pandas groupby combine two columns:
import pandas as pd
import numpy as np

# Create a sample DataFrame
df = pd.DataFrame({
    'Product': ['A', 'B', 'A', 'B', 'C', 'C'],
    'Category': ['X', 'Y', 'X', 'Y', 'Z', 'Z'],
    'Price': [10, 15, 12, 18, 20, 22],
    'Quantity': [100, 80, 120, 90, 70, 60]
})

# Define a custom function to calculate revenue
def calculate_revenue(group):
    return (group['Price'] * group['Quantity']).sum()

# Group by Product and Category, then apply the custom function
result = df.groupby(['Product', 'Category']).apply(calculate_revenue)

print(result)
In this example, we use a custom function to calculate the total revenue for each combination of ‘Product’ and ‘Category’. This demonstrates the flexibility of pandas groupby combine two columns in handling complex calculations.
Filtering Groups
You can filter groups based on certain conditions after grouping:
import pandas as pd

# Create a sample DataFrame
df = pd.DataFrame({
    'Department': ['Sales', 'HR', 'Sales', 'HR', 'IT', 'IT'],
    'Location': ['New York', 'London', 'New York', 'Paris', 'Tokyo', 'Tokyo'],
    'Employees': [50, 30, 45, 25, 40, 35],
    'Budget': [100000, 80000, 90000, 70000, 120000, 110000]
})

# Group by Department and Location, then filter groups with more than 35 employees
result = df.groupby(['Department', 'Location']).filter(lambda x: x['Employees'].sum() > 35)

print(result)
Output:
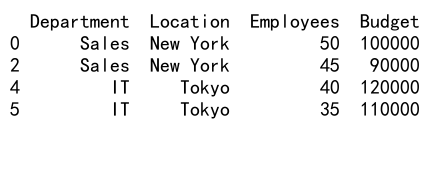
This example shows how to use pandas groupby combine two columns to filter groups based on a condition. We keep only the groups where the total number of employees is greater than 35.
Handling Missing Data in Pandas GroupBy Combine Two Columns
When working with real-world data, you may encounter missing values. Here’s how to handle missing data when using pandas groupby combine two columns:
import pandas as pd
import numpy as np

# Create a sample DataFrame with missing values
df = pd.DataFrame({
    'Product': ['A', 'B', 'A', 'B', 'C', 'C'],
    'Category': ['X', 'Y', 'X', np.nan, 'Z', 'Z'],
    'Sales': [100, 150, 120, 80, np.nan, 180]
})

# Group by Product and Category, handling missing values
result = df.groupby(['Product', 'Category'], dropna=False)['Sales'].sum()

print(result)
Output:
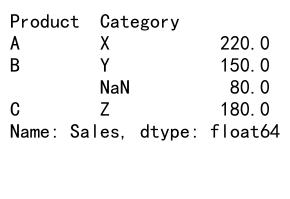
In this example, we use the dropna=False parameter to include groups with missing values in the result. This allows you to see how missing data affects your aggregations and make informed decisions about how to handle it.
Reshaping Data with Pandas GroupBy Combine Two Columns
Pandas groupby combine two columns can be powerful for reshaping data. Let’s look at an example of pivoting data:
import pandas as pd

# Create a sample DataFrame
df = pd.DataFrame({
    'Date': ['2023-01-01', '2023-01-01', '2023-01-02', '2023-01-02', '2023-01-03', '2023-01-03'],
    'Product': ['A', 'B', 'A', 'B', 'A', 'B'],
    'Sales': [100, 150, 120, 180, 110, 160]
})

# Convert Date to datetime
df['Date'] = pd.to_datetime(df['Date'])

# Pivot the data using groupby and unstack
result = df.groupby(['Date', 'Product'])['Sales'].sum().unstack()

print(result)
Output:
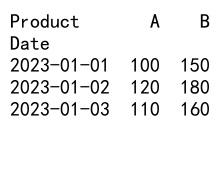
This example demonstrates how to use pandas groupby combine two columns to pivot the data, creating a new DataFrame with dates as the index and products as columns. This reshaping can be useful for time series analysis and visualization.
Optimizing Performance with Pandas GroupBy Combine Two Columns
When working with large datasets, performance can become a concern. Here are some tips to optimize the performance of pandas groupby combine two columns operations:
- Use categorical data types for grouping columns when possible
- Avoid using lambda functions in favor of built-in or vectorized operations
- Consider using the
aggmethod for multiple aggregations instead of chaining operations
Let’s look at an example of using categorical data types:
import pandas as pd

# Create a sample DataFrame
df = pd.DataFrame({
    'Product': ['A', 'B', 'A', 'B', 'C', 'C'] * 1000,
    'Category': ['X', 'Y', 'X', 'Y', 'Z', 'Z'] * 1000,
    'Sales': [100, 150, 120, 180, 110, 160] * 1000
})

# Convert Product and Category to categorical
df['Product'] = pd.Categorical(df['Product'])
df['Category'] = pd.Categorical(df['Category'])

# Perform groupby operation
result = df.groupby(['Product', 'Category'])['Sales'].sum()

print(result)
In this example, we convert the ‘Product’ and ‘Category’ columns to categorical data types before performing the groupby operation. This can significantly improve performance, especially for large datasets with many repeated values.
Visualizing Results from Pandas GroupBy Combine Two Columns
Visualizing the results of pandas groupby combine two columns operations can provide valuable insights. Here’s an example using matplotlib:
import pandas as pd
import matplotlib.pyplot as plt

# Create a sample DataFrame
df = pd.DataFrame({
    'Product': ['A', 'B', 'A', 'B', 'C', 'C'],
    'Category': ['X', 'Y', 'X', 'Y', 'Z', 'Z'],
    'Sales': [100, 150, 120, 180, 110, 160]
})

# Group by Product and Category, then calculate total sales
result = df.groupby(['Product', 'Category'])['Sales'].sum().unstack()

# Create a bar plot
result.plot(kind='bar', stacked=True)
plt.title('Sales by Product and Category')
plt.xlabel('Product')
plt.ylabel('Sales')
plt.legend(title='Category')
plt.tight_layout()
plt.show()
Output:
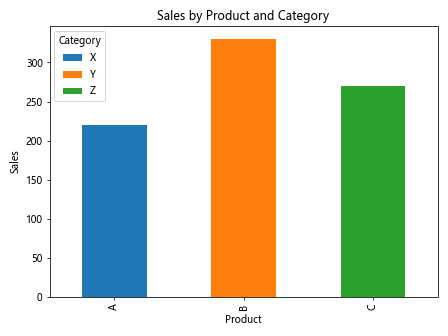
This example demonstrates how to create a stacked bar plot to visualize the sales data grouped by product and category. Visualizations like this can help identify patterns and trends in your data more easily.
Combining GroupBy Results with Other DataFrame Operations
Pandas groupby combine two columns can be used in conjunction with other DataFrame operations for more complex analyses. Here’s an example that combines groupby with merge:
import pandas as pd

# Create sample DataFrames
sales_df = pd.DataFrame({
    'Product': ['A', 'B', 'A', 'B', 'C', 'C'],
    'Region': ['East', 'West', 'East', 'East', 'West', 'West'],
    'Sales': [1000, 1500, 1200, 800, 2000, 1800]
})

costs_df = pd.DataFrame({
    'Product': ['A', 'B', 'C'],
    'Cost': [500, 600, 800]
})

# Group sales by Product and calculate total sales
sales_grouped = sales_df.groupby('Product')['Sales'].sum().reset_index()

# Merge sales_grouped with costs_df
result = pd.merge(sales_grouped, costs_df, on='Product')

# Calculate profit
result['Profit'] = result['Sales'] - result['Cost']

print(result)
Output:
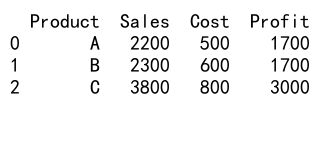
In this example, we first use pandas groupby combine two columns to calculate total sales by product, then merge the result with a cost DataFrame to calculate profits. This demonstrates how groupby operations can be integrated into more complex data analysis workflows.
Handling Time Series Data with Pandas GroupBy Combine Two Columns
Pandas groupby combine two columns is particularly useful for time series analysis. Here’s an example of grouping time series data by multiple time periods:
import pandas as pd

# Create a sample time series DataFrame
dates = pd.date_range(start='2023-01-01', end='2023-12-31', freq='D')
df = pd.DataFrame({
    'Date': dates,
    'Sales': [100 + i % 50 for i in range(len(dates))]
})

# Extract year and month from the Date column
df['Year'] = df['Date'].dt.year
df['Month'] = df['Date'].dt.month

# Group by Year and Month, then calculate total sales
result = df.groupby(['Year', 'Month'])['Sales'].sum().reset_index()

print(result)
Output:
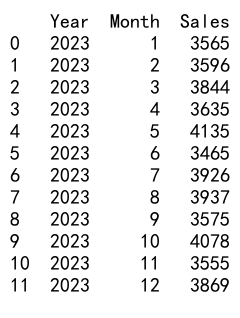
This example shows how to use pandas groupby combine two columns to aggregate time series data by year and month. This type of analysis is useful for identifying seasonal patterns or trends over time.
Best Practices for Using Pandas GroupBy Combine Two Columns
To make the most of pandas groupby combine two columns, consider the following best practices:
- Choose appropriate columns for grouping based on your analysis goals
- Use meaningful column names and aggregation functions
- Handle missing data appropriately
- Consider the memory implications of your groupby operations, especially with large datasets
- Use the
aggmethod for multiple aggregations to improve readability and performance - Leverage the power of custom functions when built-in aggregations are not sufficient
- Always verify your results, especially when working with complex groupby operations
Here’s an example that incorporates some of these best practices:
import pandas as pd

# Create a sample DataFrame
df = pd.DataFrame({
    'Customer_ID': ['C1', 'C2', 'C1', 'C3', 'C2', 'C3'],
    'Product_Category': ['Electronics', 'Clothing', 'Home', 'Electronics', 'Home', 'Clothing'],
    'Purchase_Date': ['2023-01-15', '2023-02-01', '2023-01-20', '2023-02-10', '2023-02-05', '2023-02-15'],
    'Amount': [500, 150, 300, 800, 400, 200]
})

# Convert Purchase_Date to datetime
df['Purchase_Date'] = pd.to_datetime(df['Purchase_Date'])

# Group by Customer_ID and Product_Category, then perform multiple aggregations
result = df.groupby(['Customer_ID', 'Product_Category']).agg({
    'Amount': ['sum', 'mean', 'count'],
    'Purchase_Date': ['min', 'max']
}).reset_index()

# Rename columns for clarity
result.columns = ['Customer_ID', 'Product_Category', 'Total_Amount', 'Avg_Amount', 'Purchase_Count', 'First_Purchase', 'Last_Purchase']

print(result)
Output:
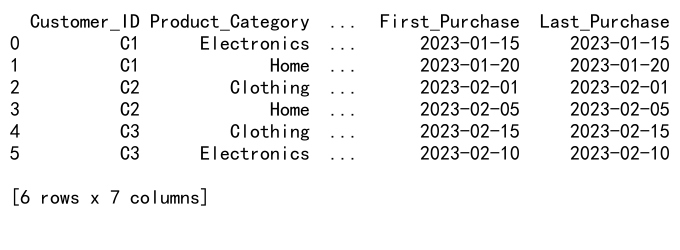
This example demonstrates several best practices, including meaningful column names, handling of date data, and the use of multiple aggregations with clear naming conventions.
Common Pitfalls and How to Avoid Them
When using pandas groupby combine two columns, there are some common pitfalls to be aware of:
- Forgetting to reset the index after groupby operations
- Mishandling missing data
- Incorrect column selection for aggregation
- Performance issues with large datasets
Let’s look at an example that addresses these pitfalls:
import pandas as pd
import numpy as np

# Create a sample DataFrame with missing values
df = pd.DataFrame({
    'Customer': ['A', 'B', 'A', 'B', 'C', 'C'],
    'Product': ['X', 'Y', 'X', 'Y', 'Z', np.nan],
    'Sales': [100, 150, np.nan, 180, 110, 160]
})

# Correct way to handle groupby with missing data and reset index
result = df.groupby(['Customer', 'Product'], dropna=False)['Sales'].agg(['sum', 'count', 'mean']).reset_index()

# Rename columns for clarity
result.columns = ['Customer', 'Product', 'Total_Sales', 'Transaction_Count', 'Average_Sale']

print(result)
Output:

This example demonstrates how to properly handle missing data, reset the index after groupby, and use clear column names to avoid confusion.
Advanced Applications of Pandas GroupBy Combine Two Columns
Let’s explore some advanced applications of pandas groupby combine two columns:
Rolling Window Calculations
import pandas as pd

# Create a sample time series DataFrame
dates = pd.date_range(start='2023-01-01', end='2023-12-31', freq='D')
df = pd.DataFrame({
    'Date': dates,
    'Product': ['A', 'B'] * (len(dates) // 2),
    'Sales': [100 + i % 50 for i in range(len(dates))]
})

# Set Date as index
df.set_index('Date', inplace=True)

# Perform rolling window calculation for each product
result = df.groupby('Product')['Sales'].rolling(window=7).mean().reset_index()

print(result)
This example demonstrates how to use pandas groupby combine two columns with rolling window calculations, which can be useful for time series analysis and smoothing data.
Hierarchical Indexing
import pandas as pd

# Create a sample DataFrame with hierarchical data
df = pd.DataFrame({
    'Region': ['North', 'North', 'South', 'South', 'East', 'East'],
    'City': ['New York', 'Boston', 'Miami', 'Atlanta', 'Chicago', 'Detroit'],
    'Product': ['A', 'B', 'A', 'B', 'A', 'B'],
    'Sales': [1000, 1200, 800, 900, 1100, 1300]
})

# Create a hierarchical index using Region and City
df.set_index(['Region', 'City'], inplace=True)

# Group by the hierarchical index and Product
result = df.groupby(level=[0, 1, 'Product'])['Sales'].sum().unstack(level='Product')

print(result)
This example shows how to use pandas groupby combine two columns with hierarchical indexing, which can be useful for analyzing data with multiple levels of categorization.
Integrating Pandas GroupBy Combine Two Columns with Other Libraries
Pandas groupby combine two columns can be integrated with other popular data science libraries for more advanced analysis:
Scikit-learn for Machine Learning
import pandas as pd
from sklearn.preprocessing import StandardScaler

# Create a sample DataFrame
df = pd.DataFrame({
    'Category': ['A', 'B', 'A', 'B', 'C', 'C'],
    'SubCategory': ['X', 'Y', 'X', 'Y', 'Z', 'Z'],
    'Value1': [10, 15, 12, 18, 20, 22],
    'Value2': [100, 80, 120, 90, 70, 60]
})

# Group by Category and SubCategory, then apply StandardScaler
def scale_group(group):
    scaler = StandardScaler()
    return pd.DataFrame(scaler.fit_transform(group), columns=group.columns, index=group.index)

result = df.groupby(['Category', 'SubCategory']).apply(scale_group)

print(result)
This example demonstrates how to use pandas groupby combine two columns with scikit-learn’s StandardScaler to normalize data within each group.
Plotly for Interactive Visualizations
import pandas as pd
import plotly.express as px

# Create a sample DataFrame
df = pd.DataFrame({
    'Product': ['A', 'B', 'A', 'B', 'C', 'C'],
    'Category': ['X', 'Y', 'X', 'Y', 'Z', 'Z'],
    'Sales': [100, 150, 120, 180, 110, 160]
})

# Group by Product and Category, then calculate total sales
result = df.groupby(['Product', 'Category'])['Sales'].sum().reset_index()

# Create an interactive bar plot
fig = px.bar(result, x='Product', y='Sales', color='Category', barmode='group',
             title='Sales by Product and Category')
fig.show()
This example shows how to use pandas groupby combine two columns with Plotly to create interactive visualizations of grouped data.
Conclusion
Pandas groupby combine two columns is a powerful technique that allows for complex data analysis and manipulation. By grouping data based on multiple criteria, you can uncover deeper insights and patterns in your datasets. Throughout this article, we’ve explored various aspects of using pandas groupby combine two columns, including basic concepts, advanced techniques, performance optimization, and integration with other libraries.
Some key takeaways include:
- Pandas groupby combine two columns provides increased granularity and flexibility in data analysis.
- It’s essential to handle missing data and choose appropriate aggregation functions.
- Performance can be optimized by using categorical data types and vectorized operations.
- Visualizing grouped data can provide valuable insights and make patterns more apparent.
- Pandas groupby combine two columns can be integrated with other data science libraries for more advanced analysis.
 Pandas Dataframe