Mastering Pandas GroupBy Count Distinct
Pandas groupby count distinct is a powerful technique for data analysis and manipulation in Python. This article will dive deep into the intricacies of using pandas groupby count distinct operations, providing detailed explanations and practical examples to help you master this essential tool in data science.
Understanding Pandas GroupBy Count Distinct
Pandas groupby count distinct is a combination of several operations in the pandas library. It involves grouping data based on one or more columns, then counting the unique values within each group. This technique is particularly useful when you need to analyze the distribution of distinct values across different categories in your dataset.
Let’s start with a simple example to illustrate the concept:
import pandas as pd

# Create a sample DataFrame
df = pd.DataFrame({
    'Category': ['A', 'B', 'A', 'B', 'A', 'C'],
    'Product': ['X', 'Y', 'X', 'Z', 'Y', 'X'],
    'Sales': [100, 200, 150, 300, 250, 175]
})

# Perform groupby count distinct
result = df.groupby('Category')['Product'].nunique()

print("Pandas GroupBy Count Distinct Result:")
print(result)
Output:
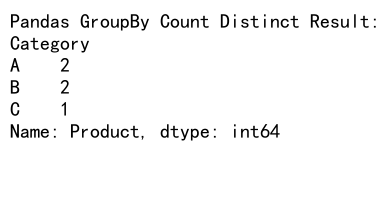
In this example, we create a DataFrame with categories, products, and sales data. We then use pandas groupby count distinct to count the number of unique products in each category. The nunique() function is used to count distinct values.
The Power of Pandas GroupBy
Before we delve deeper into count distinct operations, let’s explore the pandas groupby functionality in more detail. The groupby() function is a versatile tool that allows you to split your data into groups based on one or more columns.
Here’s an example of a simple groupby operation:
import pandas as pd

# Create a sample DataFrame
df = pd.DataFrame({
    'City': ['New York', 'London', 'New York', 'Paris', 'London'],
    'Product': ['Laptop', 'Phone', 'Tablet', 'Phone', 'Laptop'],
    'Sales': [1000, 1500, 800, 1200, 2000]
})

# Group by City and calculate mean sales
result = df.groupby('City')['Sales'].mean()

print("Pandas GroupBy Mean Sales:")
print(result)
Output:
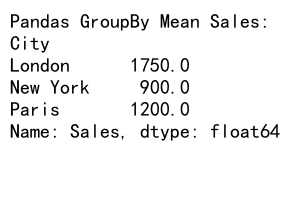
In this example, we group the data by city and calculate the mean sales for each city. The groupby() function creates groups based on the ‘City’ column, and then we apply the mean() function to the ‘Sales’ column within each group.
Combining GroupBy with Count Distinct
Now that we understand the basics of groupby, let’s explore how to combine it with count distinct operations. The pandas groupby count distinct technique is particularly useful when you want to analyze the diversity of values within each group.
Here’s an example that demonstrates this concept:
import pandas as pd

# Create a sample DataFrame
df = pd.DataFrame({
    'Department': ['HR', 'IT', 'HR', 'Finance', 'IT', 'HR'],
    'Employee': ['John', 'Alice', 'Emma', 'Bob', 'Charlie', 'David'],
    'Project': ['A', 'B', 'A', 'C', 'B', 'D']
})

# Perform groupby count distinct
result = df.groupby('Department')['Project'].nunique()

print("Pandas GroupBy Count Distinct Projects per Department:")
print(result)
Output:
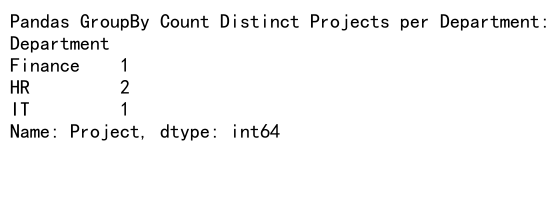
In this example, we count the number of distinct projects in each department. The nunique() function is used to count the unique values in the ‘Project’ column for each department group.
Advanced Pandas GroupBy Count Distinct Techniques
Let’s explore some more advanced techniques for pandas groupby count distinct operations.
Multiple Grouping Columns
You can group by multiple columns to get more granular results:
import pandas as pd

# Create a sample DataFrame
df = pd.DataFrame({
    'Region': ['East', 'West', 'East', 'West', 'East', 'West'],
    'Category': ['A', 'B', 'A', 'B', 'C', 'C'],
    'Product': ['X', 'Y', 'Z', 'X', 'Y', 'Z'],
    'Sales': [100, 200, 150, 300, 250, 175]
})

# Perform groupby count distinct with multiple columns
result = df.groupby(['Region', 'Category'])['Product'].nunique()

print("Pandas GroupBy Count Distinct with Multiple Columns:")
print(result)
Output:
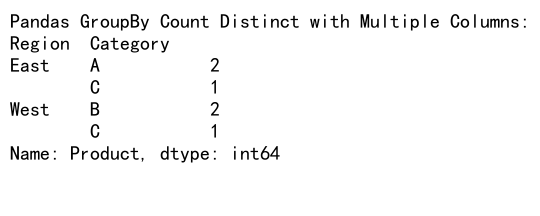
This example groups the data by both ‘Region’ and ‘Category’, then counts the distinct products in each group.
Using agg() for Multiple Aggregations
The agg() function allows you to perform multiple aggregations in a single operation:
import pandas as pd

# Create a sample DataFrame
df = pd.DataFrame({
    'Store': ['S1', 'S2', 'S1', 'S2', 'S1', 'S2'],
    'Product': ['A', 'B', 'A', 'C', 'B', 'C'],
    'Sales': [100, 200, 150, 300, 250, 175]
})

# Perform multiple aggregations
result = df.groupby('Store').agg({
    'Product': 'nunique',
    'Sales': ['sum', 'mean']
})

print("Pandas GroupBy with Multiple Aggregations:")
print(result)
Output:
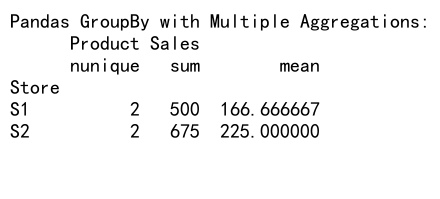
In this example, we count the distinct products and calculate the sum and mean of sales for each store.
Handling Missing Values in Pandas GroupBy Count Distinct
When working with real-world data, you often encounter missing values. Let’s explore how to handle these in pandas groupby count distinct operations.
import pandas as pd
import numpy as np

# Create a sample DataFrame with missing values
df = pd.DataFrame({
    'Category': ['A', 'B', 'A', 'B', 'A', np.nan],
    'Product': ['X', 'Y', 'X', np.nan, 'Y', 'Z'],
    'Sales': [100, 200, 150, 300, 250, 175]
})

# Perform groupby count distinct, excluding NaN values
result = df.groupby('Category', dropna=False)['Product'].nunique()

print("Pandas GroupBy Count Distinct with Missing Values:")
print(result)
Output:
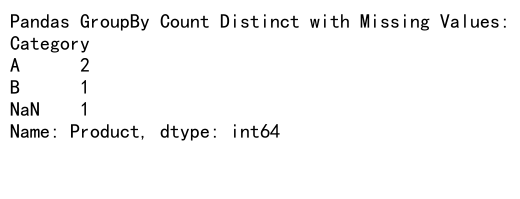
In this example, we use the dropna=False parameter in the groupby() function to include groups with missing values. The nunique() function automatically excludes NaN values when counting distinct values.
Pandas GroupBy Count Distinct with Time Series Data
Time series data is common in many data analysis scenarios. Let’s see how to use pandas groupby count distinct with datetime information.
import pandas as pd

# Create a sample DataFrame with datetime index
df = pd.DataFrame({
    'Date': pd.date_range(start='2023-01-01', periods=6),
    'Category': ['A', 'B', 'A', 'B', 'A', 'B'],
    'Product': ['X', 'Y', 'X', 'Z', 'Y', 'X']
})
df.set_index('Date', inplace=True)

# Perform groupby count distinct by month
result = df.groupby(df.index.to_period('M'))['Product'].nunique()

print("Pandas GroupBy Count Distinct with Time Series Data:")
print(result)
Output:

This example groups the data by month and counts the distinct products in each month.
Optimizing Pandas GroupBy Count Distinct for Large Datasets
When working with large datasets, performance becomes crucial. Here are some tips to optimize pandas groupby count distinct operations:
- Use categorical data types for grouping columns:
import pandas as pd

# Create a large sample DataFrame
df = pd.DataFrame({
    'Category': ['A', 'B', 'C'] * 1000000,
    'Product': ['X', 'Y', 'Z'] * 1000000
})

# Convert Category to categorical
df['Category'] = df['Category'].astype('category')

# Perform groupby count distinct
result = df.groupby('Category')['Product'].nunique()

print("Pandas GroupBy Count Distinct with Categorical Data:")
print(result)
Using categorical data types can significantly improve performance for large datasets.
- Use the
sort=Falseparameter to avoid unnecessary sorting:
import pandas as pd

# Create a sample DataFrame
df = pd.DataFrame({
    'Category': ['A', 'B', 'A', 'B', 'A', 'C'],
    'Product': ['X', 'Y', 'X', 'Z', 'Y', 'X']
})

# Perform groupby count distinct without sorting
result = df.groupby('Category', sort=False)['Product'].nunique()

print("Pandas GroupBy Count Distinct without Sorting:")
print(result)
Output:
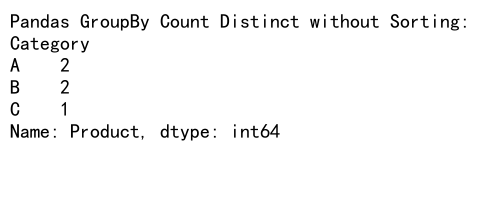
This can improve performance, especially for large datasets with many groups.
Visualizing Pandas GroupBy Count Distinct Results
Visualizing the results of pandas groupby count distinct operations can provide valuable insights. Let’s explore how to create simple visualizations using matplotlib.
import pandas as pd
import matplotlib.pyplot as plt

# Create a sample DataFrame
df = pd.DataFrame({
    'Category': ['A', 'B', 'A', 'B', 'A', 'C', 'C', 'D'],
    'Product': ['X', 'Y', 'X', 'Z', 'Y', 'X', 'Y', 'Z']
})

# Perform groupby count distinct
result = df.groupby('Category')['Product'].nunique()

# Create a bar plot
result.plot(kind='bar')
plt.title('Distinct Products per Category')
plt.xlabel('Category')
plt.ylabel('Number of Distinct Products')
plt.show()
Output:
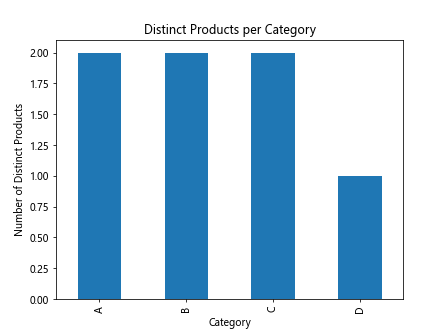
This example creates a bar plot showing the number of distinct products in each category.
Combining Pandas GroupBy Count Distinct with Other Operations
Pandas groupby count distinct can be combined with other operations to perform more complex analyses. Let’s explore some examples:
- Filtering groups based on count distinct results:
import pandas as pd

# Create a sample DataFrame
df = pd.DataFrame({
    'Category': ['A', 'B', 'A', 'B', 'A', 'C', 'C', 'D'],
    'Product': ['X', 'Y', 'X', 'Z', 'Y', 'X', 'Y', 'Z'],
    'Sales': [100, 200, 150, 300, 250, 175, 225, 350]
})

# Perform groupby count distinct and filter groups
result = df.groupby('Category').filter(lambda x: x['Product'].nunique() > 1)

print("Filtered DataFrame:")
print(result)
Output:
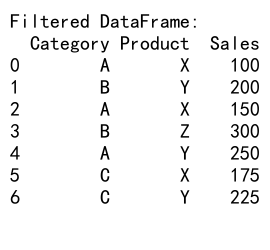
This example filters out categories that have only one distinct product.
- Combining count distinct with other aggregations:
import pandas as pd

# Create a sample DataFrame
df = pd.DataFrame({
    'Category': ['A', 'B', 'A', 'B', 'A', 'C'],
    'Product': ['X', 'Y', 'X', 'Z', 'Y', 'X'],
    'Sales': [100, 200, 150, 300, 250, 175]
})

# Perform multiple aggregations including count distinct
result = df.groupby('Category').agg({
    'Product': 'nunique',
    'Sales': ['sum', 'mean']
})

print("Multiple Aggregations including Count Distinct:")
print(result)
Output:
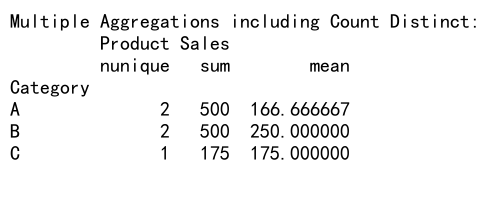
This example combines count distinct of products with sum and mean of sales for each category.
Handling Duplicates in Pandas GroupBy Count Distinct
When working with real-world data, you may encounter duplicate rows that can affect your count distinct results. Let’s explore how to handle these situations:
import pandas as pd

# Create a sample DataFrame with duplicates
df = pd.DataFrame({
    'Category': ['A', 'B', 'A', 'B', 'A', 'B'],
    'Product': ['X', 'Y', 'X', 'Y', 'X', 'Y'],
    'Sales': [100, 200, 100, 200, 150, 250]
})

# Remove duplicates before groupby count distinct
df_deduped = df.drop_duplicates()
result = df_deduped.groupby('Category')['Product'].nunique()

print("Pandas GroupBy Count Distinct after Removing Duplicates:")
print(result)
Output:

In this example, we remove duplicate rows before performing the groupby count distinct operation to ensure accurate results.
Using Pandas GroupBy Count Distinct with Multi-Index DataFrames
Multi-index DataFrames, also known as hierarchical indexes, can add complexity to your data analysis. Let’s see how to use pandas groupby count distinct with such structures:
import pandas as pd

# Create a sample multi-index DataFrame
index = pd.MultiIndex.from_product([['A', 'B'], ['X', 'Y', 'Z']], names=['Category', 'SubCategory'])
df = pd.DataFrame({
    'Product': ['P1', 'P2', 'P1', 'P3', 'P2', 'P4'],
    'Sales': [100, 200, 150, 300, 250, 175]
}, index=index)

# Perform groupby count distinct on multi-index DataFrame
result = df.groupby(level='Category')['Product'].nunique()

print("Pandas GroupBy Count Distinct with Multi-Index DataFrame:")
print(result)
Output:

This example demonstrates how to perform groupby count distinct operations on a multi-index DataFrame, grouping by one level of the index.
Pandas GroupBy Count Distinct with Custom Functions
Sometimes, you may need to apply custom logic to your groupby count distinct operations. Pandas allows you to use custom functions with the apply() method:
import pandas as pd

# Create a sample DataFrame
df = pd.DataFrame({
    'Category': ['A', 'B', 'A', 'B', 'A', 'C'],
    'Product': ['X', 'Y', 'X', 'Z', 'Y', 'X'],
    'Sales': [100, 200, 150, 300, 250, 175]
})

# Define a custom function
def custom_count_distinct(group):
    return pd.Series({
        'Distinct_Products': group['Product'].nunique(),
        'Total_Sales': group['Sales'].sum()
    })

# Apply the custom function
result = df.groupby('Category').apply(custom_count_distinct)

print("Pandas GroupBy Count Distinct with Custom Function:")
print(result)
This example uses a custom function to count distinct products and calculate total sales for each category.
Handling Large Datasets with Chunking in Pandas GroupBy Count Distinct
When dealing with extremely large datasets that don’t fit into memory, you can use chunking to process the data in smaller pieces:
import pandas as pd

# Simulate reading a large CSV file in chunks
chunk_size = 1000
result = pd.Series(dtype=int)

for chunk in pd.read_csv('pandasdataframe.com/large_dataset.csv', chunksize=chunk_size):
    chunk_result = chunk.groupby('Category')['Product'].nunique()
    result = result.add(chunk_result, fill_value=0)

print("Pandas GroupBy Count Distinct with Chunking:")
print(result)
This example demonstrates how to process a large CSV file in chunks, performing groupby count distinct operations on each chunk and aggregating the results.
Conclusion
Pandas groupby count distinct is a powerful technique for data analysis that allows you to gain insights into the distribution of unique values across different categories in your dataset. By mastering this technique, you can efficiently analyze complex datasets and extract valuable information.
Throughout this article, we’ve explored various aspects of pandas groupby count distinct, including:
- Basic usage and syntax
- Advanced techniques with multiple grouping columns and aggregations
- Handling missing values and time series data
- Optimizing performance for large datasets
5.5. Visualizing results - Combining with other operations
- Handling duplicates and multi-index DataFrames
- Using custom functions
- Processing large datasets with chunking
 Pandas Dataframe