Mastering Pandas GroupBy Average
Pandas groupby average is a powerful technique for analyzing and summarizing data in Python. This article will explore the various aspects of using pandas groupby average, providing detailed explanations and practical examples to help you master this essential data analysis tool.
Introduction to Pandas GroupBy Average
Pandas groupby average is a combination of two key operations in the pandas library: groupby and average (mean). The groupby operation allows you to split your data into groups based on one or more columns, while the average function calculates the mean of numeric columns within each group. This powerful combination enables data analysts and scientists to quickly summarize large datasets and extract meaningful insights.
Let’s start with a simple example to illustrate the basic concept of pandas groupby average:
import pandas as pd

# Create a sample DataFrame
df = pd.DataFrame({
    'Category': ['A', 'B', 'A', 'B', 'A', 'B'],
    'Value': [10, 20, 15, 25, 12, 18],
    'Website': ['pandasdataframe.com'] * 6
})

# Calculate the average value for each category
result = df.groupby('Category')['Value'].mean()

print(result)
Output:
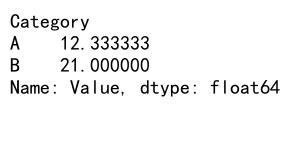
In this example, we create a simple DataFrame with a ‘Category’ column and a ‘Value’ column. We then use pandas groupby average to calculate the mean value for each category. The result will show the average value for categories A and B.
Understanding the Pandas GroupBy Operation
Before diving deeper into pandas groupby average, it’s essential to understand the groupby operation itself. The groupby function in pandas allows you to split your data into groups based on one or more columns. This operation creates a GroupBy object, which you can then apply various aggregation functions to, including average.
Here’s an example that demonstrates the groupby operation:
import pandas as pd

# Create a sample DataFrame
df = pd.DataFrame({
    'Category': ['A', 'B', 'A', 'B', 'A', 'B'],
    'Value1': [10, 20, 15, 25, 12, 18],
    'Value2': [5, 8, 6, 9, 7, 10],
    'Website': ['pandasdataframe.com'] * 6
})

# Group the DataFrame by 'Category'
grouped = df.groupby('Category')

# Print the groups
for name, group in grouped:
    print(f"Group: {name}")
    print(group)
    print()
Output:
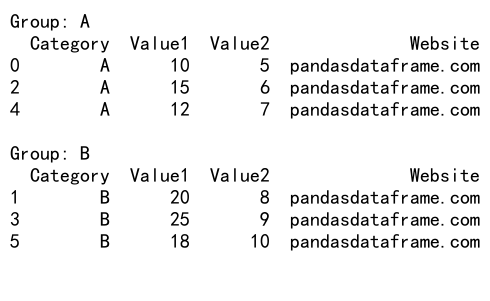
This example shows how the groupby operation splits the DataFrame into groups based on the ‘Category’ column. You can then iterate through these groups to perform further analysis or apply aggregation functions.
Calculating Average with Pandas GroupBy
Now that we understand the groupby operation, let’s focus on calculating averages using pandas groupby average. The most common way to calculate the average is by using the mean() function after grouping the data.
Here’s an example that demonstrates how to calculate the average of multiple columns:
import pandas as pd

# Create a sample DataFrame
df = pd.DataFrame({
    'Category': ['A', 'B', 'A', 'B', 'A', 'B'],
    'Value1': [10, 20, 15, 25, 12, 18],
    'Value2': [5, 8, 6, 9, 7, 10],
    'Website': ['pandasdataframe.com'] * 6
})

# Calculate the average of Value1 and Value2 for each category
result = df.groupby('Category')[['Value1', 'Value2']].mean()

print(result)
Output:
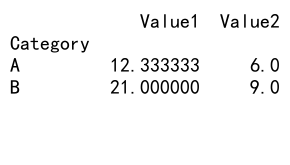
In this example, we calculate the average of both ‘Value1’ and ‘Value2’ columns for each category. The result will show the mean values for both columns, grouped by category.
Handling Missing Values in Pandas GroupBy Average
When working with real-world data, you may encounter missing values (NaN) in your DataFrame. Pandas groupby average provides options to handle these missing values when calculating averages.
Here’s an example that demonstrates how to handle missing values:
import pandas as pd
import numpy as np

# Create a sample DataFrame with missing values
df = pd.DataFrame({
    'Category': ['A', 'B', 'A', 'B', 'A', 'B'],
    'Value': [10, np.nan, 15, 25, np.nan, 18],
    'Website': ['pandasdataframe.com'] * 6
})

# Calculate the average, ignoring NaN values
result_ignore_nan = df.groupby('Category')['Value'].mean()

# Calculate the average, including NaN values
result_include_nan = df.groupby('Category')['Value'].mean(skipna=False)

print("Ignoring NaN values:")
print(result_ignore_nan)
print("\nIncluding NaN values:")
print(result_include_nan)
This example shows how to calculate the average with and without including NaN values. By default, pandas groupby average ignores NaN values, but you can change this behavior using the skipna parameter.
Multiple Group Keys in Pandas GroupBy Average
Pandas groupby average allows you to group your data by multiple columns, providing more granular insights into your dataset. This is particularly useful when dealing with hierarchical or multi-dimensional data.
Here’s an example that demonstrates grouping by multiple columns:
import pandas as pd

# Create a sample DataFrame
df = pd.DataFrame({
    'Category': ['A', 'B', 'A', 'B', 'A', 'B'],
    'Subcategory': ['X', 'Y', 'X', 'Y', 'Y', 'X'],
    'Value': [10, 20, 15, 25, 12, 18],
    'Website': ['pandasdataframe.com'] * 6
})

# Calculate the average value for each combination of Category and Subcategory
result = df.groupby(['Category', 'Subcategory'])['Value'].mean()

print(result)
Output:
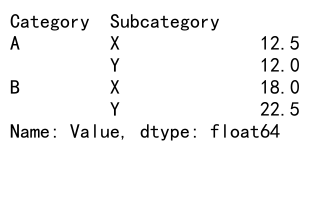
In this example, we group the data by both ‘Category’ and ‘Subcategory’ columns before calculating the average value. The result will show the mean value for each unique combination of Category and Subcategory.
Applying Multiple Aggregation Functions
While pandas groupby average focuses on calculating the mean, you can apply multiple aggregation functions simultaneously to get a more comprehensive summary of your data.
Here’s an example that demonstrates using multiple aggregation functions:
import pandas as pd

# Create a sample DataFrame
df = pd.DataFrame({
    'Category': ['A', 'B', 'A', 'B', 'A', 'B'],
    'Value': [10, 20, 15, 25, 12, 18],
    'Website': ['pandasdataframe.com'] * 6
})

# Apply multiple aggregation functions
result = df.groupby('Category')['Value'].agg(['mean', 'min', 'max', 'count'])

print(result)
Output:
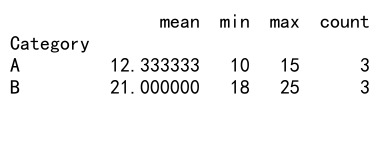
This example shows how to apply multiple aggregation functions (mean, min, max, and count) to the ‘Value’ column for each category. The result will display a summary table with all these statistics for each group.
Weighted Average with Pandas GroupBy
In some cases, you may need to calculate a weighted average instead of a simple average. Pandas groupby average can be combined with other operations to achieve this.
Here’s an example of calculating a weighted average:
import pandas as pd

# Create a sample DataFrame
df = pd.DataFrame({
    'Category': ['A', 'B', 'A', 'B', 'A', 'B'],
    'Value': [10, 20, 15, 25, 12, 18],
    'Weight': [1, 2, 1.5, 2.5, 1.2, 1.8],
    'Website': ['pandasdataframe.com'] * 6
})

# Calculate the weighted average
result = df.groupby('Category').apply(lambda x: np.average(x['Value'], weights=x['Weight']))

print(result)
In this example, we use the apply method with a lambda function to calculate the weighted average of the ‘Value’ column, using the ‘Weight’ column as weights. The result will show the weighted average for each category.
Handling Time Series Data with Pandas GroupBy Average
Pandas groupby average is particularly useful when working with time series data. You can group data by various time periods (e.g., day, week, month) and calculate averages to identify trends and patterns.
Here’s an example of using pandas groupby average with time series data:
import pandas as pd

# Create a sample DataFrame with date information
df = pd.DataFrame({
    'Date': pd.date_range(start='2023-01-01', end='2023-12-31', freq='D'),
    'Value': np.random.randint(1, 100, 365),
    'Website': ['pandasdataframe.com'] * 365
})

# Set the Date column as the index
df.set_index('Date', inplace=True)

# Calculate monthly averages
monthly_avg = df.groupby(pd.Grouper(freq='M'))['Value'].mean()

print(monthly_avg)
This example demonstrates how to use pandas groupby average to calculate monthly averages from daily data. We use the pd.Grouper function to group the data by month, then calculate the mean value for each month.
Customizing Pandas GroupBy Average Output
You can customize the output of pandas groupby average to make it more readable or to fit specific requirements. This includes renaming columns, resetting the index, and formatting the results.
Here’s an example that demonstrates customizing the output:
import pandas as pd

# Create a sample DataFrame
df = pd.DataFrame({
    'Category': ['A', 'B', 'A', 'B', 'A', 'B'],
    'Value1': [10, 20, 15, 25, 12, 18],
    'Value2': [5, 8, 6, 9, 7, 10],
    'Website': ['pandasdataframe.com'] * 6
})

# Calculate averages and customize output
result = df.groupby('Category').agg({
    'Value1': 'mean',
    'Value2': 'mean'
}).reset_index()

# Rename columns
result.columns = ['Category', 'Average Value 1', 'Average Value 2']

# Format decimal places
result['Average Value 1'] = result['Average Value 1'].round(2)
result['Average Value 2'] = result['Average Value 2'].round(2)

print(result)
Output:

This example shows how to calculate averages, reset the index, rename columns, and format decimal places to create a more presentable output.
Handling Large Datasets with Pandas GroupBy Average
When working with large datasets, pandas groupby average can be computationally intensive. Here are some tips to improve performance when dealing with big data:
- Use appropriate data types to reduce memory usage.
- Consider using the
chunksizeparameter when reading large CSV files. - Use the
as_index=Falseparameter in groupby to avoid creating a MultiIndex.
Here’s an example that demonstrates these techniques:
import pandas as pd

# Read a large CSV file in chunks
chunk_size = 100000
result = pd.DataFrame()

for chunk in pd.read_csv('large_dataset.csv', chunksize=chunk_size):
    # Ensure proper data types
    chunk['Category'] = chunk['Category'].astype('category')
    chunk['Value'] = chunk['Value'].astype('float32')

    # Calculate average for each chunk
    chunk_result = chunk.groupby('Category', as_index=False)['Value'].mean()

    # Append chunk result to the final result
    result = result.append(chunk_result)

# Calculate the final average
final_result = result.groupby('Category', as_index=False)['Value'].mean()

print(final_result)
This example demonstrates how to process a large CSV file in chunks, use appropriate data types, and avoid creating a MultiIndex to improve performance when working with big data.
Advanced Pandas GroupBy Average Techniques
As you become more comfortable with pandas groupby average, you can explore more advanced techniques to extract deeper insights from your data. Here are some advanced techniques:
1. Using Transform for Group-wise Operations
The transform method allows you to perform group-wise operations while maintaining the original DataFrame’s shape. This is useful for creating new columns based on group averages.
import pandas as pd

# Create a sample DataFrame
df = pd.DataFrame({
    'Category': ['A', 'B', 'A', 'B', 'A', 'B'],
    'Value': [10, 20, 15, 25, 12, 18],
    'Website': ['pandasdataframe.com'] * 6
})

# Add a new column with the group average
df['Group_Average'] = df.groupby('Category')['Value'].transform('mean')

print(df)
Output:
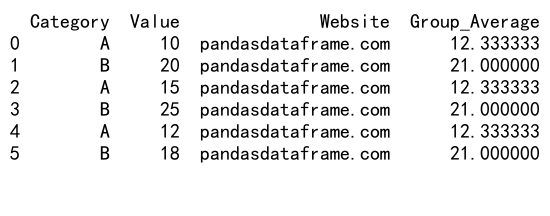
This example adds a new column ‘Group_Average’ to the DataFrame, containing the average value for each category.
2. Combining GroupBy with Window Functions
You can combine pandas groupby average with window functions to perform more complex calculations, such as rolling averages within groups.
import pandas as pd

# Create a sample DataFrame with date information
df = pd.DataFrame({
    'Date': pd.date_range(start='2023-01-01', end='2023-12-31', freq='D'),
    'Category': ['A', 'B'] * 183,
    'Value': np.random.randint(1, 100, 365),
    'Website': ['pandasdataframe.com'] * 365
})

# Calculate 7-day rolling average for each category
df['Rolling_Avg'] = df.groupby('Category')['Value'].transform(lambda x: x.rolling(window=7).mean())

print(df.head(10))
This example calculates a 7-day rolling average for each category, demonstrating how to combine groupby with window functions.
3. Using GroupBy with Custom Aggregation Functions
You can create custom aggregation functions to use with pandas groupby average, allowing for more flexibility in your data analysis.
import pandas as pd

# Create a sample DataFrame
df = pd.DataFrame({
    'Category': ['A', 'B', 'A', 'B', 'A', 'B'],
    'Value': [10, 20, 15, 25, 12, 18],
    'Website': ['pandasdataframe.com'] * 6
})

# Define a custom aggregation function
def weighted_avg(group):
    weights = [1, 2, 3]  # Example weights
    return np.average(group, weights=weights[:len(group)])

# Apply the custom function
result = df.groupby('Category')['Value'].agg(weighted_avg)

print(result)
This example demonstrates how to create and apply a custom aggregation function (weighted average) with pandas groupby.
Common Pitfalls and How to Avoid Them
When working with pandas groupby average, there are some common pitfalls that you should be aware of:
- Forgetting to handle missing values
- Incorrect data types leading to unexpected results
- Misinterpreting results when grouping by multiple columns
- Performance issues with large datasets
To avoid these pitfalls, always check your data types, handle missing values explicitly, and be mindful of the structure of your grouped data. Here’s an example that demonstrates good practices:
import pandas as pd
import numpy as np

# Create a sample DataFrame with potential issues
df = pd.DataFrame({
    'Category': ['A', 'B', 'A', 'B', 'A', 'B'],
    'Subcategory': ['X', 'Y', 'X', 'Y', 'Y', 'X'],
    'Value': [10, np.nan, 15, '25', 12, 18],
    'Website': ['pandasdataframe.com'] * 6
})

# Check data types
print(df.dtypes)

# Convert 'Value' to numeric, coercing errors to NaN
df['Value'] = pd.to_numeric(df['Value'], errors='coerce')

# Handle missingvalues
df['Value'] = df['Value'].fillna(df['Value'].mean())

# Calculate average, grouping by multiple columns
result = df.groupby(['Category', 'Subcategory'])['Value'].mean().reset_index()

print(result)
Output:
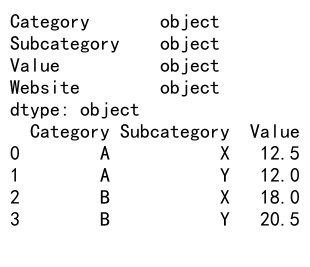
This example demonstrates how to check data types, convert columns to the correct type, handle missing values, and correctly group by multiple columns.
Comparing Pandas GroupBy Average with Other Aggregation Methods
While pandas groupby average is a powerful tool, it’s essential to understand how it compares to other aggregation methods. Let’s compare it with some alternatives:
1. Pandas GroupBy Average vs. Pivot Tables
Pivot tables can provide similar functionality to pandas groupby average but with a different structure:
import pandas as pd

# Create a sample DataFrame
df = pd.DataFrame({
    'Category': ['A', 'B', 'A', 'B', 'A', 'B'],
    'Subcategory': ['X', 'Y', 'X', 'Y', 'Y', 'X'],
    'Value': [10, 20, 15, 25, 12, 18],
    'Website': ['pandasdataframe.com'] * 6
})

# Using groupby average
groupby_result = df.groupby(['Category', 'Subcategory'])['Value'].mean().reset_index()

# Using pivot table
pivot_result = pd.pivot_table(df, values='Value', index='Category', columns='Subcategory', aggfunc='mean')

print("GroupBy Result:")
print(groupby_result)
print("\nPivot Table Result:")
print(pivot_result)
Output:
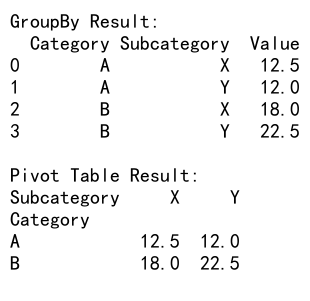
This example shows how to achieve similar results using both pandas groupby average and pivot tables.
2. Pandas GroupBy Average vs. SQL Aggregation
If you’re coming from a SQL background, you might be interested in how pandas groupby average compares to SQL aggregation:
import pandas as pd
import sqlite3

# Create a sample DataFrame
df = pd.DataFrame({
    'Category': ['A', 'B', 'A', 'B', 'A', 'B'],
    'Value': [10, 20, 15, 25, 12, 18],
    'Website': ['pandasdataframe.com'] * 6
})

# Using pandas groupby average
pandas_result = df.groupby('Category')['Value'].mean().reset_index()

# Using SQL-like aggregation
conn = sqlite3.connect(':memory:')
df.to_sql('data', conn, index=False)
sql_result = pd.read_sql_query("SELECT Category, AVG(Value) as Value FROM data GROUP BY Category", conn)

print("Pandas Result:")
print(pandas_result)
print("\nSQL Result:")
print(sql_result)
Output:
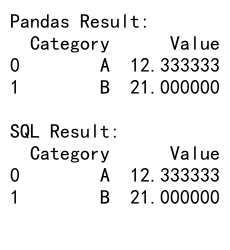
This example demonstrates how to achieve the same result using both pandas groupby average and SQL-like aggregation.
Real-world Applications of Pandas GroupBy Average
Pandas groupby average has numerous real-world applications across various industries. Here are some examples:
1. Financial Analysis
In financial analysis, pandas groupby average can be used to calculate average stock prices, trading volumes, or returns by sector, time period, or other categories.
import pandas as pd
import numpy as np

# Create a sample stock data DataFrame
df = pd.DataFrame({
    'Date': pd.date_range(start='2023-01-01', end='2023-12-31', freq='D'),
    'Stock': np.random.choice(['AAPL', 'GOOGL', 'MSFT', 'AMZN'], 365),
    'Price': np.random.uniform(100, 1000, 365),
    'Volume': np.random.randint(1000, 100000, 365),
    'Website': ['pandasdataframe.com'] * 365
})

# Calculate average price and volume by stock
result = df.groupby('Stock').agg({
    'Price': 'mean',
    'Volume': 'mean'
}).reset_index()

print(result)
Output:
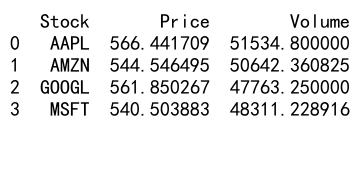
This example demonstrates how to calculate average stock prices and trading volumes for different stocks.
2. Customer Analytics
In customer analytics, pandas groupby average can be used to analyze average purchase amounts, frequency of purchases, or customer lifetime value by various customer segments.
import pandas as pd
import numpy as np

# Create a sample customer data DataFrame
df = pd.DataFrame({
    'Customer_ID': np.repeat(range(1, 101), 5),
    'Purchase_Date': pd.date_range(start='2023-01-01', end='2023-12-31', periods=500),
    'Purchase_Amount': np.random.uniform(10, 1000, 500),
    'Category': np.random.choice(['Electronics', 'Clothing', 'Books', 'Home'], 500),
    'Website': ['pandasdataframe.com'] * 500
})

# Calculate average purchase amount and frequency by customer
result = df.groupby('Customer_ID').agg({
    'Purchase_Amount': 'mean',
    'Purchase_Date': 'count'
}).reset_index()

result.columns = ['Customer_ID', 'Avg_Purchase_Amount', 'Purchase_Frequency']

print(result.head())
Output:
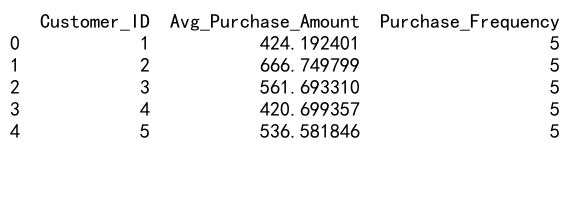
This example shows how to calculate average purchase amounts and purchase frequency for each customer.
3. Weather Data Analysis
In meteorology, pandas groupby average can be used to analyze average temperatures, precipitation, or other weather metrics by location, season, or year.
import pandas as pd
import numpy as np

# Create a sample weather data DataFrame
df = pd.DataFrame({
    'Date': pd.date_range(start='2023-01-01', end='2023-12-31', freq='D'),
    'City': np.random.choice(['New York', 'Los Angeles', 'Chicago', 'Houston'], 365),
    'Temperature': np.random.uniform(0, 100, 365),
    'Precipitation': np.random.uniform(0, 5, 365),
    'Website': ['pandasdataframe.com'] * 365
})

# Calculate average temperature and precipitation by city and month
df['Month'] = df['Date'].dt.to_period('M')
result = df.groupby(['City', 'Month']).agg({
    'Temperature': 'mean',
    'Precipitation': 'mean'
}).reset_index()

print(result.head(10))
Output:
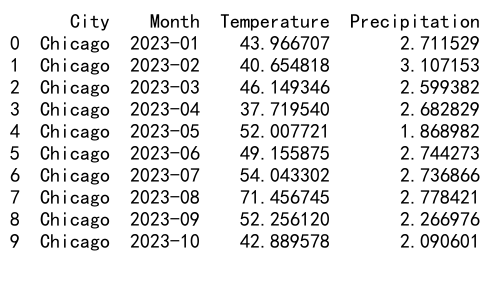
This example demonstrates how to calculate average temperature and precipitation by city and month.
Best Practices for Using Pandas GroupBy Average
To make the most of pandas groupby average in your data analysis projects, consider the following best practices:
- Always check your data types before performing groupby operations.
- Handle missing values explicitly to avoid unexpected results.
- Use appropriate column names and index labels for clarity.
- Consider performance implications when working with large datasets.
- Combine groupby average with other pandas functions for more complex analyses.
- Document your code and explain the reasoning behind your grouping choices.
Here’s an example that incorporates these best practices:
import pandas as pd
import numpy as np

def analyze_sales_data(df):
    """
    Analyze sales data by calculating average sales and quantity by product category and month.

    Parameters:
    df (pandas.DataFrame): Input DataFrame containing sales data

    Returns:
    pandas.DataFrame: Aggregated sales data
    """
    # Check data types
    print("Data types:")
    print(df.dtypes)

    # Handle missing values
    df['Sales'] = df['Sales'].fillna(0)
    df['Quantity'] = df['Quantity'].fillna(0)

    # Convert date to month period
    df['Month'] = pd.to_datetime(df['Date']).dt.to_period('M')

    # Perform groupby average
    result = df.groupby(['Product_Category', 'Month']).agg({
        'Sales': 'mean',
        'Quantity': 'mean'
    }).reset_index()

    # Rename columns for clarity
    result.columns = ['Product_Category', 'Month', 'Avg_Sales', 'Avg_Quantity']

    # Round results to two decimal places
    result['Avg_Sales'] = result['Avg_Sales'].round(2)
    result['Avg_Quantity'] = result['Avg_Quantity'].round(2)

    return result

# Create a sample sales DataFrame
df = pd.DataFrame({
    'Date': pd.date_range(start='2023-01-01', end='2023-12-31', freq='D'),
    'Product_Category': np.random.choice(['Electronics', 'Clothing', 'Books', 'Home'], 365),
    'Sales': np.random.uniform(100, 1000, 365),
    'Quantity': np.random.randint(1, 50, 365),
    'Website': ['pandasdataframe.com'] * 365
})

# Analyze sales data
result = analyze_sales_data(df)

print(result.head(10))
Output:
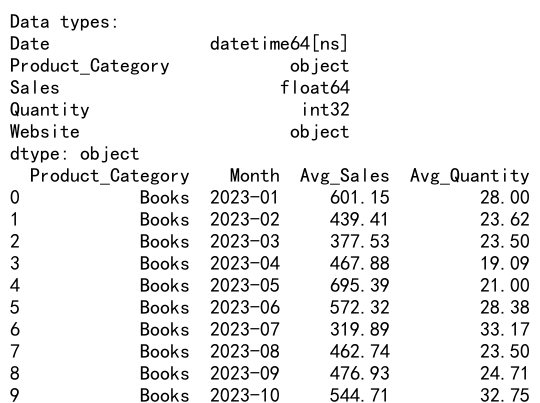
This example demonstrates best practices for using pandas groupby average, including data type checking, missing value handling, clear column naming, and proper documentation.
Conclusion
Pandas groupby average is a powerful tool for data analysis that allows you to efficiently summarize and aggregate large datasets. By grouping data based on one or more columns and calculating averages, you can uncover valuable insights and patterns in your data.
 Pandas Dataframe