Mastering Pandas GroupBy Count Unique
Pandas groupby count unique is a powerful technique for data analysis and manipulation in Python. This article will dive deep into the intricacies of using pandas groupby count unique operations to extract valuable insights from your data. We’ll explore various methods, provide numerous examples, and offer practical tips to help you become proficient in utilizing this essential pandas functionality.
Understanding Pandas GroupBy Count Unique
Pandas groupby count unique is a combination of three key concepts in pandas: groupby, count, and unique. Let’s break down each component:
- GroupBy: This operation allows you to split your data into groups based on one or more columns.
- Count: This function counts the number of non-null values in each group.
- Unique: This method helps identify distinct values within a group.
When combined, pandas groupby count unique enables you to count the number of unique values within each group, providing valuable insights into your data’s distribution and characteristics.
Let’s start with a simple example to illustrate the basic concept of pandas groupby count unique:
import pandas as pd

# Create a sample DataFrame
df = pd.DataFrame({
    'Category': ['A', 'B', 'A', 'B', 'A', 'C'],
    'Product': ['X', 'Y', 'X', 'Z', 'Y', 'X'],
    'Sales': [100, 200, 150, 300, 250, 175]
})

# Perform pandas groupby count unique
result = df.groupby('Category')['Product'].nunique()

print("Pandas GroupBy Count Unique Result:")
print(result)
Output:
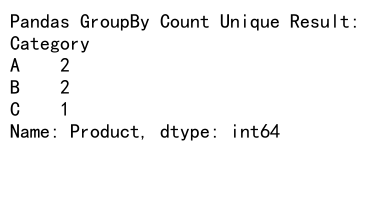
In this example, we create a DataFrame with categories, products, and sales data. We then use pandas groupby count unique to count the number of unique products in each category. The nunique() method is a convenient way to perform this operation.
Advanced Techniques for Pandas GroupBy Count Unique
Now that we’ve covered the basics, let’s explore more advanced techniques for using pandas groupby count unique:
Multiple Grouping Columns
You can group by multiple columns to get a more granular view of your data:
import pandas as pd

# Create a sample DataFrame
df = pd.DataFrame({
    'Category': ['A', 'B', 'A', 'B', 'A', 'C'],
    'Region': ['East', 'West', 'East', 'East', 'West', 'West'],
    'Product': ['X', 'Y', 'X', 'Z', 'Y', 'X'],
    'Sales': [100, 200, 150, 300, 250, 175]
})

# Perform pandas groupby count unique with multiple grouping columns
result = df.groupby(['Category', 'Region'])['Product'].nunique()

print("Pandas GroupBy Count Unique with Multiple Columns:")
print(result)
Output:
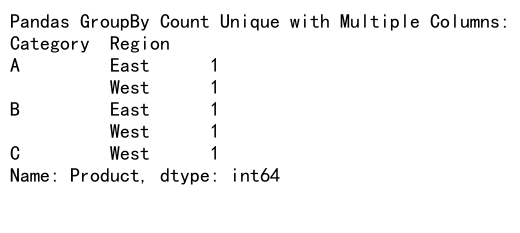
This example demonstrates how to use pandas groupby count unique with multiple grouping columns. We group by both ‘Category’ and ‘Region’ to count unique products in each combination.
Using agg() for Multiple Aggregations
The agg() function allows you to perform multiple aggregations simultaneously:
import pandas as pd

# Create a sample DataFrame
df = pd.DataFrame({
    'Category': ['A', 'B', 'A', 'B', 'A', 'C'],
    'Product': ['X', 'Y', 'X', 'Z', 'Y', 'X'],
    'Sales': [100, 200, 150, 300, 250, 175]
})

# Perform multiple aggregations including pandas groupby count unique
result = df.groupby('Category').agg({
    'Product': 'nunique',
    'Sales': ['sum', 'mean']
})

print("Multiple Aggregations with Pandas GroupBy Count Unique:")
print(result)
Output:
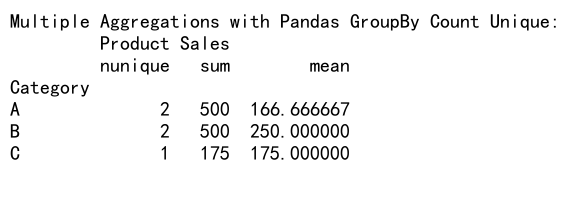
In this example, we use agg() to perform multiple aggregations, including pandas groupby count unique on the ‘Product’ column and sum and mean calculations on the ‘Sales’ column.
Handling Missing Values
When dealing with missing values in your data, you may want to exclude them from your pandas groupby count unique calculations:
import pandas as pd
import numpy as np

# Create a sample DataFrame with missing values
df = pd.DataFrame({
    'Category': ['A', 'B', 'A', 'B', 'A', 'C'],
    'Product': ['X', 'Y', np.nan, 'Z', 'Y', 'X'],
    'Sales': [100, 200, 150, 300, 250, 175]
})

# Perform pandas groupby count unique excluding missing values
result = df.groupby('Category')['Product'].nunique(dropna=True)

print("Pandas GroupBy Count Unique Excluding Missing Values:")
print(result)
Output:
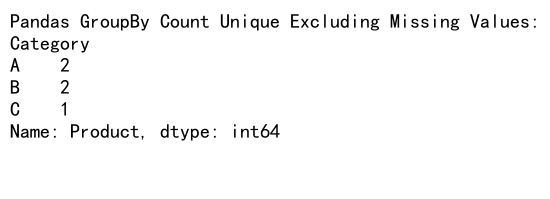
This example shows how to use the dropna=True parameter in the nunique() method to exclude missing values from the pandas groupby count unique operation.
Resetting the Index
After performing a pandas groupby count unique operation, you might want to reset the index for easier manipulation:
import pandas as pd

# Create a sample DataFrame
df = pd.DataFrame({
    'Category': ['A', 'B', 'A', 'B', 'A', 'C'],
    'Product': ['X', 'Y', 'X', 'Z', 'Y', 'X'],
    'Sales': [100, 200, 150, 300, 250, 175]
})

# Perform pandas groupby count unique and reset the index
result = df.groupby('Category')['Product'].nunique().reset_index(name='Unique_Products')

print("Pandas GroupBy Count Unique with Reset Index:")
print(result)
Output:
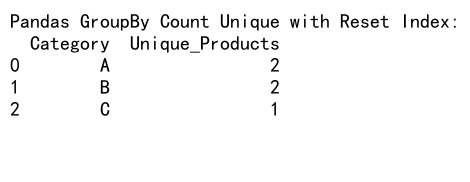
This example demonstrates how to reset the index after a pandas groupby count unique operation, making it easier to work with the resulting DataFrame.
Practical Applications of Pandas GroupBy Count Unique
Let’s explore some practical applications of pandas groupby count unique in real-world scenarios:
Analyzing Customer Behavior
Suppose you have a dataset of customer purchases and want to analyze their buying patterns:
import pandas as pd

# Create a sample DataFrame of customer purchases
df = pd.DataFrame({
    'Customer_ID': [1, 1, 2, 2, 3, 3, 3],
    'Product_Category': ['Electronics', 'Clothing', 'Electronics', 'Books', 'Clothing', 'Books', 'Electronics'],
    'Purchase_Date': pd.date_range(start='2023-01-01', periods=7)
})

# Count unique product categories purchased by each customer
result = df.groupby('Customer_ID')['Product_Category'].nunique().reset_index(name='Unique_Categories')

print("Unique Product Categories Purchased by Each Customer:")
print(result)
Output:

This example uses pandas groupby count unique to analyze the number of unique product categories each customer has purchased.
Identifying Popular Items
Let’s say you want to identify the most popular items in different store locations:
import pandas as pd

# Create a sample DataFrame of store sales
df = pd.DataFrame({
    'Store_Location': ['New York', 'Los Angeles', 'Chicago', 'New York', 'Los Angeles', 'Chicago'],
    'Item': ['A', 'B', 'C', 'A', 'C', 'B'],
    'Sales_Count': [10, 15, 8, 12, 9, 11]
})

# Count unique items sold in each store location
result = df.groupby('Store_Location')['Item'].nunique().reset_index(name='Unique_Items')

print("Number of Unique Items Sold in Each Store Location:")
print(result)
Output:
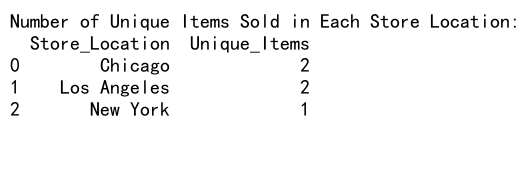
This example demonstrates how to use pandas groupby count unique to identify the number of unique items sold in different store locations.
Analyzing Website Traffic
Suppose you have website traffic data and want to analyze unique visitors:
import pandas as pd

# Create a sample DataFrame of website traffic
df = pd.DataFrame({
    'Date': pd.date_range(start='2023-01-01', periods=10),
    'Page': ['Home', 'Products', 'About', 'Home', 'Products', 'Contact', 'Home', 'Products', 'About', 'Contact'],
    'Visitor_ID': [1, 1, 2, 3, 4, 2, 5, 3, 6, 4]
})

# Count unique visitors for each page
result = df.groupby('Page')['Visitor_ID'].nunique().reset_index(name='Unique_Visitors')

print("Unique Visitors for Each Page:")
print(result)
Output:

This example uses pandas groupby count unique to analyze the number of unique visitors for each page on a website.
Advanced Pandas GroupBy Count Unique Techniques
Let’s explore some more advanced techniques for using pandas groupby count unique:
Conditional Grouping
You can use conditional statements to create groups dynamically:
import pandas as pd

# Create a sample DataFrame
df = pd.DataFrame({
    'Product': ['A', 'B', 'C', 'A', 'B', 'C'],
    'Price': [10, 15, 20, 12, 18, 22],
    'Category': ['X', 'Y', 'X', 'Y', 'X', 'Y']
})

# Perform conditional grouping and count unique
result = df.groupby(df['Price'] > 15)['Product'].nunique()

print("Pandas GroupBy Count Unique with Conditional Grouping:")
print(result)
Output:

This example demonstrates how to use a conditional statement to group data based on a price threshold and then perform a pandas groupby count unique operation.
Using Transform for Grouped Calculations
The transform() method allows you to perform grouped calculations while maintaining the original DataFrame structure:
import pandas as pd

# Create a sample DataFrame
df = pd.DataFrame({
    'Category': ['A', 'B', 'A', 'B', 'A', 'C'],
    'Product': ['X', 'Y', 'X', 'Z', 'Y', 'X'],
    'Sales': [100, 200, 150, 300, 250, 175]
})

# Use transform to add a column with unique product counts
df['Unique_Products_Count'] = df.groupby('Category')['Product'].transform('nunique')

print("DataFrame with Unique Product Counts:")
print(df)
Output:
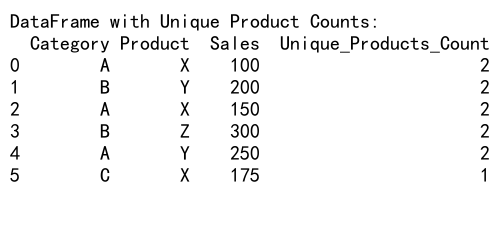
This example shows how to use transform() to add a new column to the DataFrame containing the count of unique products for each category.
Handling Time Series Data
When working with time series data, you might want to group by time intervals:
import pandas as pd

# Create a sample DataFrame with time series data
df = pd.DataFrame({
    'Timestamp': pd.date_range(start='2023-01-01', periods=10, freq='H'),
    'Product': ['A', 'B', 'A', 'C', 'B', 'A', 'C', 'B', 'A', 'C'],
    'Sales': [100, 150, 200, 120, 180, 220, 130, 190, 210, 140]
})

# Group by hour and count unique products
result = df.groupby(df['Timestamp'].dt.hour)['Product'].nunique()

print("Unique Products Sold by Hour:")
print(result)
This example demonstrates how to use pandas groupby count unique with time series data, grouping by hour and counting unique products sold.
Optimizing Pandas GroupBy Count Unique Operations
When working with large datasets, optimizing your pandas groupby count unique operations becomes crucial. Here are some tips to improve performance:
Using Categorical Data Types
Converting string columns to categorical data types can significantly improve performance:
import pandas as pd

# Create a sample DataFrame
df = pd.DataFrame({
    'Category': ['A', 'B', 'A', 'B', 'A', 'C'] * 1000,
    'Product': ['X', 'Y', 'X', 'Z', 'Y', 'X'] * 1000,
    'Sales': [100, 200, 150, 300, 250, 175] * 1000
})

# Convert 'Category' and 'Product' columns to categorical
df['Category'] = df['Category'].astype('category')
df['Product'] = df['Product'].astype('category')

# Perform pandas groupby count unique
result = df.groupby('Category')['Product'].nunique()

print("Pandas GroupBy Count Unique with Categorical Data Types:")
print(result)
This example shows how to convert string columns to categorical data types before performing a pandas groupby count unique operation, which can improve performance for large datasets.
Common Pitfalls and How to Avoid Them
When working with pandas groupby count unique, there are some common pitfalls you should be aware of:
Handling Case Sensitivity
By default, pandas groupby count unique is case-sensitive. If you want to ignore case, you need to convert the values to lowercase:
import pandas as pd

# Create a sample DataFrame with mixed case
df = pd.DataFrame({
    'Category': ['A', 'B', 'A', 'B', 'A', 'C'],
    'Product': ['X', 'Y', 'x', 'Z', 'Y', 'X']
})

# Perform case-insensitive pandas groupby count unique
result = df.groupby('Category')['Product'].apply(lambda x: x.str.lower().nunique())

print("Case-Insensitive Pandas GroupBy Count Unique:")
print(result)
Output:
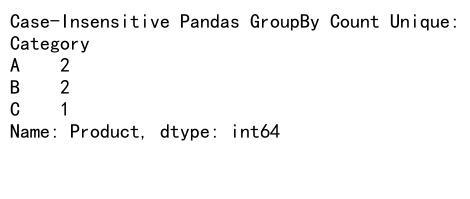
This example shows how to perform a case-insensitive pandas groupby count unique operation by converting the values to lowercase before counting.
Dealing with Duplicate Index Values
After a groupby operation, you might end up with duplicate index values. Here’s how to handle them:
import pandas as pd

# Create a sample DataFrame with duplicate index values
df = pd.DataFrame({
    'Category': ['A', 'B', 'A', 'B', 'A', 'C'],
    'Product': ['X', 'Y', 'X', 'Z', 'Y', 'X'],
    'Sales': [100, 200, 150, 300, 250, 175]
})

# Perform pandas groupby count unique and handle duplicate index values
result = df.groupby(['Category', 'Product']).size().unstack(fill_value=0)

print("Pandas GroupBy Count Unique with Duplicate Index Handling:")
print(result)
Output:

This example demonstrates how to handle duplicate index values when performing a pandas groupby count unique operation by using unstack() to create a pivot table-like result.
Combining Pandas GroupBy Count Unique with Other Operations
Pandas groupby count unique can be combined with other pandas operations to perform more complex analyses:
Filtering Based on Unique Counts
You can use the results of a pandas groupby count unique operation to filter your data:
import pandas as pd

# Create a sample DataFrame
df = pd.DataFrame({
    'Category': ['A', 'B', 'A', 'B', 'A', 'C', 'C', 'D'],
    'Product': ['X', 'Y', 'X', 'Z', 'Y', 'X', 'Y', 'Z'],
    'Sales': [100, 200, 150, 300, 250, 175, 225, 350]
})

# Count unique products per category
unique_counts = df.groupby('Category')['Product'].nunique()

# Filter categories with more than one unique product
categories_to_keep = unique_counts[unique_counts > 1].index

# Filter the original DataFrame
filtered_df = df[df['Category'].isin(categories_to_keep)]

print("Filtered DataFrame based on Unique Product Counts:")
print(filtered_df)
Output:
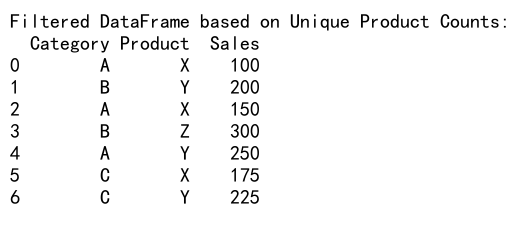
This example demonstrates how to use the results of a pandas groupby count unique operation to filter the original DataFrame, keeping only categories with more than one unique product.
Combining with Aggregate Functions
You can combine pandas groupby count unique with other aggregate functions for more comprehensive analysis:
import pandas as pd

# Create a sample DataFrame
df = pd.DataFrame({
    'Category': ['A', 'B', 'A', 'B', 'A', 'C'],
    'Product': ['X', 'Y', 'X', 'Z', 'Y', 'X'],
    'Sales': [100, 200, 150, 300, 250, 175]
})

# Combine count unique with other aggregate functions
result = df.groupby('Category').agg({
    'Product': 'nunique',
    'Sales': ['sum', 'mean', 'max']
})

print("Combined Pandas GroupBy Count Unique with Other Aggregations:")
print(result)
Output:
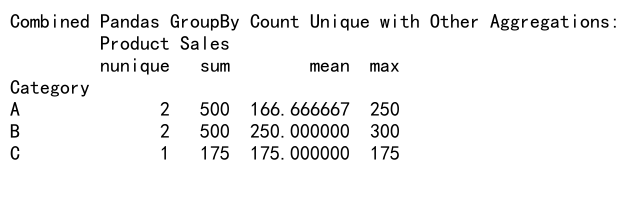
This example shows how to combine pandas groupby count unique with other aggregate functions like sum, mean, and max to get a more comprehensive view of the data.
Advanced Data Analysis with Pandas GroupBy Count Unique
Let’s explore some advanced data analysis techniques using pandas groupby count unique:
Analyzing Time-based Patterns
You can use pandas groupby count unique to analyze patterns over time:
import pandas as pd

# Create a sample DataFrame with time-based data
df = pd.DataFrame({
    'Date': pd.date_range(start='2023-01-01', periods=100),
    'Product': ['A', 'B', 'C'] * 33 + ['A'],
    'Sales': [100, 200, 150] * 33 + [100]
})

# Analyze unique products sold by month
result = df.groupby(df['Date'].dt.to_period('M'))['Product'].nunique()

print("Unique Products Sold by Month:")
print(result)
Output:
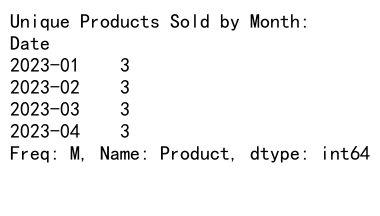
This example demonstrates how to use pandas groupby count unique to analyze the number of unique products sold each month.
Hierarchical Grouping
You can perform hierarchical grouping to get more detailed insights:
import pandas as pd

# Create a sample DataFrame with hierarchical data
df = pd.DataFrame({
    'Region': ['East', 'West', 'East', 'West', 'East', 'West'],
    'Category': ['A', 'B', 'A', 'B', 'C', 'C'],
    'Product': ['X', 'Y', 'Z', 'X', 'Y', 'Z'],
    'Sales': [100, 200, 150, 300, 250, 175]
})

# Perform hierarchical grouping and count unique products
result = df.groupby(['Region', 'Category'])['Product'].nunique().unstack(fill_value=0)

print("Hierarchical Grouping with Pandas GroupBy Count Unique:")
print(result)
Output:

This example shows how to use hierarchical grouping with pandas groupby count unique to analyze the number of unique products in each category across different regions.
Best Practices for Using Pandas GroupBy Count Unique
To make the most of pandas groupby count unique, consider the following best practices:
- Clean your data: Remove duplicates and handle missing values before performing groupby operations.
- Use appropriate data types: Convert string columns to categorical types for better performance.
- Consider memory usage: For large datasets, use chunking or parallel processing techniques.
- Combine with other operations: Leverage the full power of pandas by combining groupby count unique with other aggregations and transformations.
- Visualize results: Use matplotlib or seaborn to create visualizations of your pandas groupby count unique results.
Here’s an example that incorporates some of these best practices:
import pandas as pd
import matplotlib.pyplot as plt

# Create a sample DataFrame
df = pd.DataFrame({
    'Category': ['A', 'B', 'A', 'B', 'A', 'C'] * 1000,
    'Product': ['X', 'Y', 'X', 'Z', 'Y', 'X'] * 1000,
    'Sales': [100, 200, 150, 300, 250, 175] * 1000
})

# Clean data and optimize data types
df = df.drop_duplicates()
df['Category'] = df['Category'].astype('category')
df['Product'] = df['Product'].astype('category')

# Perform pandas groupby count unique
result = df.groupby('Category').agg({
    'Product': 'nunique',
    'Sales': 'sum'
}).reset_index()

# Visualize the results
fig, ax1 = plt.subplots(figsize=(10, 6))

ax1.bar(result['Category'], result['Product'], color='b', alpha=0.7, label='Unique Products')
ax1.set_xlabel('Category')
ax1.set_ylabel('Unique Products Count', color='b')
ax1.tick_params(axis='y', labelcolor='b')

ax2 = ax1.twinx()
ax2.plot(result['Category'], result['Sales'], color='r', marker='o', label='Total Sales')
ax2.set_ylabel('Total Sales', color='r')
ax2.tick_params(axis='y', labelcolor='r')

plt.title('Unique Products and Total Sales by Category')
fig.legend(loc='upper right', bbox_to_anchor=(1, 1), bbox_transform=ax1.transAxes)

plt.tight_layout()
plt.show()
Output:
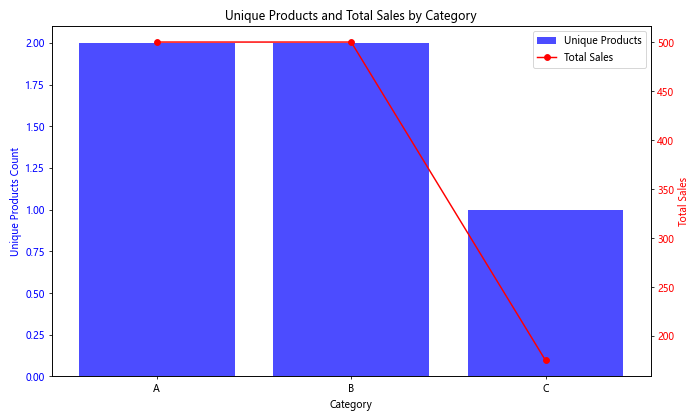
This example demonstrates best practices such as data cleaning, optimizing data types, combining aggregations, and visualizing the results of a pandas groupby count unique operation.
Conclusion
Pandas groupby count unique is a powerful tool for data analysis and manipulation. By mastering this technique, you can gain valuable insights from your data, identify patterns, and make informed decisions. Throughout this article, we’ve explored various aspects of pandas groupby count unique, from basic concepts to advanced techniques and best practices.
 Pandas Dataframe