Mastering Pandas GroupBy Count
Pandas groupby count is a powerful technique for data analysis and aggregation in Python. This article will explore the various aspects of using pandas groupby count to summarize and analyze data efficiently. We’ll cover the basics, advanced techniques, and practical examples to help you master this essential pandas functionality.
Introduction to Pandas GroupBy Count
Pandas groupby count is a method that allows you to group data based on specific columns and count the occurrences of values within those groups. This operation is particularly useful when dealing with large datasets and trying to understand the distribution of data across different categories.
Let’s start with a simple example to illustrate the basic usage of pandas groupby count:
import pandas as pd

# Create a sample DataFrame
df = pd.DataFrame({
    'Category': ['A', 'B', 'A', 'C', 'B', 'A'],
    'Value': [1, 2, 3, 4, 5, 6]
})

# Perform groupby count
result = df.groupby('Category').count()

print("Pandas GroupBy Count Result:")
print(result)
Output:
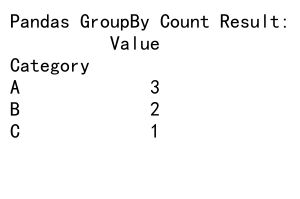
In this example, we create a DataFrame with two columns: ‘Category’ and ‘Value’. We then use the groupby() method to group the data by the ‘Category’ column and apply the count() function. The result shows the count of occurrences for each category.
Understanding the Basics of Pandas GroupBy
Before diving deeper into pandas groupby count, it’s essential to understand the fundamentals of the groupby() operation in pandas. The groupby() method allows you to split the data into groups based on one or more columns, apply a function to each group, and combine the results.
Here’s an example that demonstrates the basic groupby operation:
import pandas as pd

# Create a sample DataFrame
df = pd.DataFrame({
    'Name': ['John', 'Emma', 'John', 'Emma', 'Mike'],
    'Age': [25, 30, 25, 30, 35],
    'City': ['New York', 'London', 'New York', 'Paris', 'Tokyo']
})

# Group by 'Name' and calculate the mean age
result = df.groupby('Name')['Age'].mean()

print("Pandas GroupBy Mean Age:")
print(result)
Output:
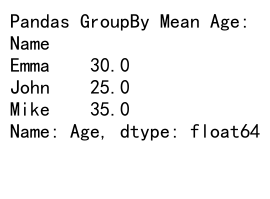
In this example, we group the data by the ‘Name’ column and calculate the mean age for each person. The groupby() method creates groups based on unique values in the ‘Name’ column, and the mean() function is applied to the ‘Age’ column for each group.
Applying Count to Grouped Data
Now that we understand the basics of groupby, let’s focus on using the count function with grouped data. The count() method is particularly useful when you want to determine the number of occurrences or non-null values in each group.
Here’s an example that demonstrates how to use pandas groupby count:
import pandas as pd

# Create a sample DataFrame
df = pd.DataFrame({
    'Product': ['A', 'B', 'A', 'C', 'B', 'A'],
    'Category': ['Electronics', 'Clothing', 'Electronics', 'Home', 'Clothing', 'Electronics'],
    'Sales': [100, 150, 200, 300, 250, 180]
})

# Perform groupby count
result = df.groupby('Product').count()

print("Pandas GroupBy Count Result:")
print(result)
Output:
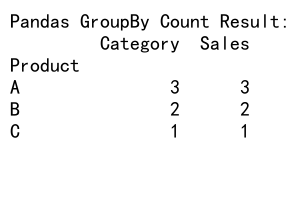
In this example, we group the data by the ‘Product’ column and apply the count() function. The result shows the count of non-null values for each product across all columns.
Counting Specific Columns
Sometimes, you may want to count occurrences in specific columns rather than all columns. Pandas groupby count allows you to specify which columns to count after grouping the data.
Here’s an example that demonstrates counting specific columns:
import pandas as pd

# Create a sample DataFrame
df = pd.DataFrame({
    'Category': ['A', 'B', 'A', 'C', 'B', 'A'],
    'SubCategory': ['X', 'Y', 'X', 'Z', 'Y', 'Z'],
    'Value': [1, 2, 3, 4, 5, 6]
})

# Count occurrences of 'SubCategory' for each 'Category'
result = df.groupby('Category')['SubCategory'].count()

print("Pandas GroupBy Count Specific Column:")
print(result)
Output:
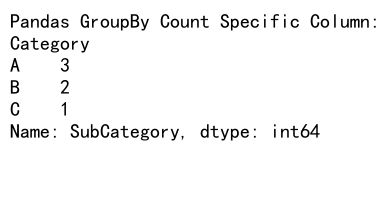
In this example, we group the data by the ‘Category’ column and count the occurrences of ‘SubCategory’ within each group. This approach allows you to focus on specific columns of interest when performing the count operation.
Multiple Column Grouping
Pandas groupby count supports grouping by multiple columns, allowing for more complex aggregations. This is particularly useful when you want to analyze data across multiple dimensions.
Here’s an example of grouping by multiple columns:
import pandas as pd

# Create a sample DataFrame
df = pd.DataFrame({
    'Region': ['East', 'West', 'East', 'West', 'East'],
    'Product': ['A', 'B', 'A', 'C', 'B'],
    'Sales': [100, 150, 200, 300, 250]
})

# Group by multiple columns and count
result = df.groupby(['Region', 'Product']).count()

print("Pandas GroupBy Count with Multiple Columns:")
print(result)
Output:
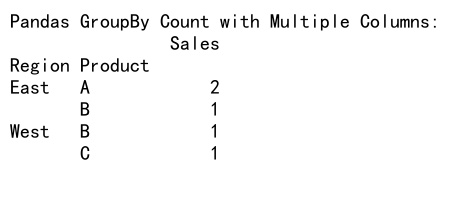
In this example, we group the data by both ‘Region’ and ‘Product’ columns, then apply the count function. The result shows the count of occurrences for each unique combination of region and product.
Handling Missing Values
When working with real-world data, it’s common to encounter missing values. Pandas groupby count provides options to handle missing values during the aggregation process.
Here’s an example that demonstrates how to handle missing values:
import pandas as pd
import numpy as np

# Create a sample DataFrame with missing values
df = pd.DataFrame({
    'Category': ['A', 'B', 'A', 'C', 'B', 'A'],
    'Value': [1, np.nan, 3, 4, 5, np.nan]
})

# Count non-null values
result_count = df.groupby('Category').count()

# Count including null values
result_size = df.groupby('Category').size()

print("Pandas GroupBy Count (Non-null values):")
print(result_count)
print("\nPandas GroupBy Size (Including null values):")
print(result_size)
Output:
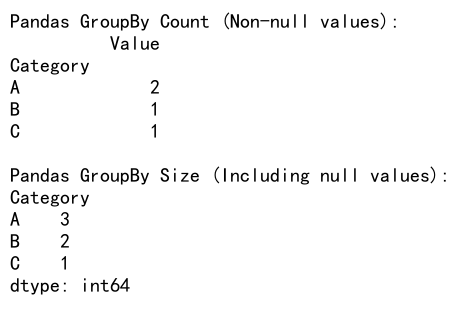
In this example, we use both count() and size() methods to demonstrate the difference in handling missing values. The count() method excludes null values, while size() includes them in the count.
Customizing the Count Operation
Pandas groupby count allows for customization of the count operation to suit specific needs. You can use custom aggregation functions or combine multiple aggregations in a single operation.
Here’s an example of customizing the count operation:
import pandas as pd

# Create a sample DataFrame
df = pd.DataFrame({
    'Category': ['A', 'B', 'A', 'C', 'B', 'A'],
    'Value': [1, 2, 3, 4, 5, 6]
})

# Custom count function
def custom_count(x):
    return len(x[x > 2])

# Apply custom count function
result = df.groupby('Category')['Value'].agg(custom_count)

print("Pandas GroupBy Custom Count:")
print(result)
Output:
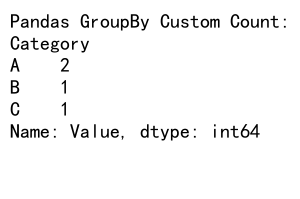
In this example, we define a custom count function that counts values greater than 2. We then apply this custom function to the grouped data using the agg() method.
Combining Count with Other Aggregations
Pandas groupby count can be combined with other aggregation functions to perform multiple calculations in a single operation. This is particularly useful when you need to compute various statistics for grouped data.
Here’s an example that combines count with other aggregations:
import pandas as pd

# Create a sample DataFrame
df = pd.DataFrame({
    'Category': ['A', 'B', 'A', 'C', 'B', 'A'],
    'Value': [1, 2, 3, 4, 5, 6]
})

# Combine count with other aggregations
result = df.groupby('Category').agg({
    'Value': ['count', 'sum', 'mean']
})

print("Pandas GroupBy Count with Other Aggregations:")
print(result)
Output:
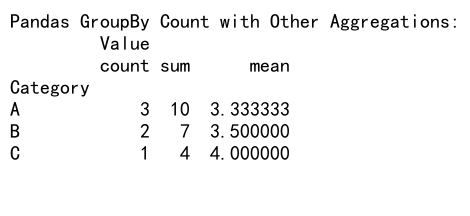
In this example, we use the agg() method to apply multiple aggregation functions, including count, sum, and mean, to the ‘Value’ column for each category.
Handling Large Datasets
When working with large datasets, pandas groupby count operations can become computationally expensive. It’s important to optimize your code and use efficient techniques to handle large-scale data.
Here’s an example of using pandas groupby count with a larger dataset:
import pandas as pd
import numpy as np

# Create a larger sample DataFrame
np.random.seed(42)
df = pd.DataFrame({
    'Category': np.random.choice(['A', 'B', 'C'], size=1000000),
    'Value': np.random.randint(1, 100, size=1000000)
})

# Perform groupby count
result = df.groupby('Category').count()

print("Pandas GroupBy Count on Large Dataset:")
print(result)
Output:
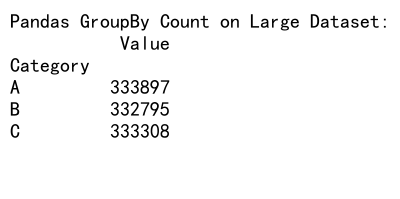
In this example, we create a DataFrame with 1 million rows and perform a groupby count operation. When working with large datasets, consider using techniques like chunking or distributed computing to improve performance.
Visualizing GroupBy Count Results
Visualizing the results of pandas groupby count operations can provide valuable insights into your data. You can use various plotting libraries, such as Matplotlib or Seaborn, to create informative visualizations.
Here’s an example of visualizing groupby count results:
import pandas as pd
import matplotlib.pyplot as plt

# Create a sample DataFrame
df = pd.DataFrame({
    'Category': ['A', 'B', 'A', 'C', 'B', 'A', 'C', 'B', 'A'],
    'Value': [1, 2, 3, 4, 5, 6, 7, 8, 9]
})

# Perform groupby count
result = df.groupby('Category').count()

# Create a bar plot
result.plot(kind='bar')
plt.title('Count by Category')
plt.xlabel('Category')
plt.ylabel('Count')
plt.show()
Output:
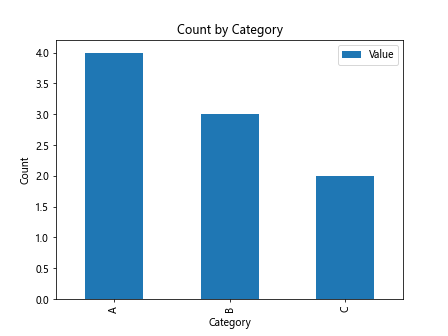
In this example, we create a bar plot to visualize the count of occurrences for each category. Visualizations can help you quickly identify patterns and trends in your grouped data.
Advanced GroupBy Count Techniques
As you become more proficient with pandas groupby count, you can explore advanced techniques to handle more complex scenarios. These techniques include using multi-level indexing, applying filters, and working with time series data.
Here’s an example of an advanced groupby count technique using multi-level indexing:
import pandas as pd

# Create a sample DataFrame with multi-level columns
df = pd.DataFrame({
    ('Sales', 'Q1'): [100, 150, 200],
    ('Sales', 'Q2'): [120, 180, 220],
    ('Expenses', 'Q1'): [80, 100, 150],
    ('Expenses', 'Q2'): [90, 110, 160]
})
df.index = ['A', 'B', 'C']

# Perform groupby count on multi-level columns
result = df.groupby(level=0, axis=1).count()

print("Pandas GroupBy Count with Multi-level Columns:")
print(result)
In this example, we use multi-level columns to represent sales and expenses for different quarters. We then perform a groupby count operation on the column level to count the number of non-null values for each category.
Handling Time Series Data
Pandas groupby count is particularly useful when working with time series data. You can group data by time intervals and perform count operations to analyze trends over time.
Here’s an example of using pandas groupby count with time series data:
import pandas as pd

# Create a sample time series DataFrame
dates = pd.date_range(start='2023-01-01', end='2023-12-31', freq='D')
df = pd.DataFrame({
    'Date': dates,
    'Category': pd.np.random.choice(['A', 'B', 'C'], size=len(dates)),
    'Value': pd.np.random.randint(1, 100, size=len(dates))
})

# Group by month and category, then count
result = df.groupby([df['Date'].dt.to_period('M'), 'Category']).count()

print("Pandas GroupBy Count with Time Series Data:")
print(result)
In this example, we create a time series DataFrame with daily data for a year. We then group the data by month and category, performing a count operation to analyze the distribution of data points across different time periods and categories.
Optimizing GroupBy Count Performance
When working with large datasets, optimizing the performance of pandas groupby count operations becomes crucial. There are several techniques you can use to improve the efficiency of your groupby count operations.
Here’s an example of optimizing groupby count performance:
import pandas as pd
import numpy as np

# Create a large sample DataFrame
np.random.seed(42)
df = pd.DataFrame({
    'Category': np.random.choice(['A', 'B', 'C'], size=1000000),
    'SubCategory': np.random.choice(['X', 'Y', 'Z'], size=1000000),
    'Value': np.random.randint(1, 100, size=1000000)
})

# Optimize memory usage
df['Category'] = df['Category'].astype('category')
df['SubCategory'] = df['SubCategory'].astype('category')

# Perform groupby count
result = df.groupby(['Category', 'SubCategory']).size().unstack(fill_value=0)

print("Optimized Pandas GroupBy Count:")
print(result)
In this example, we use the astype('category') method to convert string columns to categorical data types, which can significantly reduce memory usage and improve performance. We also use the size() method instead of count() for faster counting, and unstack() to reshape the result into a more readable format.
Handling Hierarchical Data
Pandas groupby count can be used effectively with hierarchical data structures, such as nested categories or multi-level indexes. This allows for more complex aggregations and analysis of data with multiple levels of organization.
Here’s an example of using pandas groupby count with hierarchical data:
import pandas as pd

# Create a sample DataFrame with hierarchical index
df = pd.DataFrame({
    'Region': ['North', 'North', 'South', 'South', 'East', 'East'],
    'Country': ['USA', 'Canada', 'Brazil', 'Argentina', 'China', 'Japan'],
    'Sales': [100, 90, 80, 70, 120, 110],
    'Expenses': [60, 50, 40, 30, 70, 60]
})
df.set_index(['Region', 'Country'], inplace=True)

# Perform groupby count on hierarchical index
result = df.groupby(level=['Region', 'Country']).count()

print("Pandas GroupBy Count with Hierarchical Data:")
print(result)
Output:
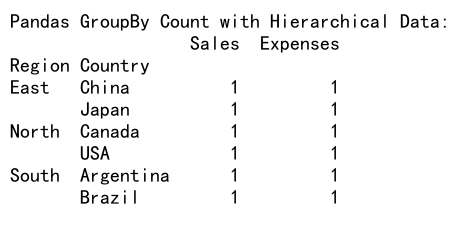
In this example, we create a DataFrame with a hierarchical index using ‘Region’ and ‘Country’ columns. We then perform a groupby count operation on both levels of the index, allowing us to analyze the data at different levels of granularity.
Combining GroupBy Count with Window Functions
Pandas groupby count can be combined with window functions to perform more advanced analyses, such as calculating running totals or moving averages within groups.
Here’s an example of combining groupby count with a window function:
import pandas as pd

# Create a sample DataFrame
df = pd.DataFrame({
    'Category': ['A', 'B', 'A', 'C', 'B', 'A', 'C', 'B', 'A'],
    'Value': [1, 2, 3, 4, 5, 6, 7, 8, 9]
})

# Perform groupby count and calculate cumulative sum
result = df.groupby('Category').agg({
    'Value': ['count', 'cumsum']
})

print("Pandas GroupBy Count with Window Function:")
print(result)
Output:
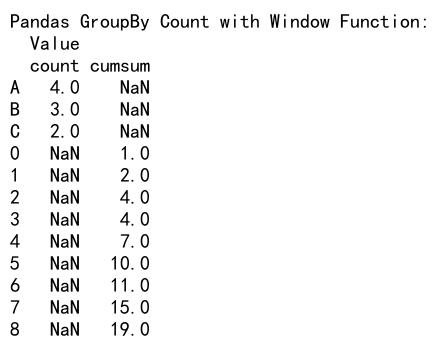
In this example, we combine the groupby count operation with the cumulative sum window function. This allows us to see both the count of occurrences and the running total for each category.
Handling Duplicate Data
When working with real-world datasets, you may encounter duplicate entries that can affect your groupby count results. Pandas provides methods to handle duplicates effectively.
Here’s an example of handling duplicate data in pandas groupby count:
import pandas as pd

# Create a sample DataFrame with duplicates
df = pd.DataFrame({
    'Category': ['A', 'B', 'A', 'C', 'B', 'A', 'C', 'B', 'A'],
    'Value': [1, 2, 1, 4, 2, 6, 4, 8, 1]
})

# Remove duplicates and perform groupby count
result_unique = df.drop_duplicates().groupby('Category').count()

# Count all occurrences including duplicates
result_all = df.groupby('Category').count()

print("Pandas GroupBy Count (Unique Values):")
print(result_unique)
print("\nPandas GroupBy Count (All Values):")
print(result_all)
Output:
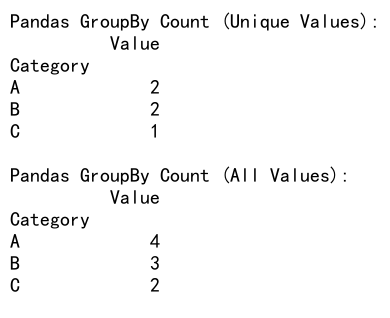
In this example, we demonstrate two approaches: one that removes duplicates before counting, and another that counts all occurrences including duplicates. This allows you to choose the appropriate method based on your specific data analysis requirements.
Applying Custom Functions with GroupBy Count
Pandas groupby count allows you to apply custom functions to your grouped data, enabling more complex and tailored analyses.
Here’s an example of applying a custom function with pandas groupby count:
import pandas as pd

# Create a sample DataFrame
df = pd.DataFrame({
    'Category': ['A', 'B', 'A', 'C', 'B', 'A'],
    'Value': [1, 2, 3, 4, 5, 6]
})

# Define a custom function
def custom_count(group):
    return pd.Series({
        'count': len(group),
        'count_even': len(group[group['Value'] % 2 == 0]),
        'count_odd': len(group[group['Value'] % 2 != 0])
    })

# Apply custom function with groupby
result = df.groupby('Category').apply(custom_count)

print("Pandas GroupBy Count with Custom Function:")
print(result)
In this example, we define a custom function that counts the total number of items, the number of even values, and the number of odd values within each group. We then apply this custom function to our grouped data using the apply() method.
Handling Missing Data in GroupBy Count
When dealing with real-world datasets, missing data is a common issue that can affect your groupby count results. Pandas provides various methods to handle missing data effectively.
Here’s an example of handling missing data in pandas groupby count:
import pandas as pd
import numpy as np

# Create a sample DataFrame with missing data
df = pd.DataFrame({
    'Category': ['A', 'B', 'A', 'C', 'B', 'A'],
    'Value': [1, np.nan, 3, 4, 5, np.nan]
})

# Count non-null values
result_count = df.groupby('Category').count()

# Count all values including null
result_size = df.groupby('Category').size()

# Fill missing values before counting
df_filled = df.fillna(0)
result_filled = df_filled.groupby('Category').count()

print("Pandas GroupBy Count (Non-null values):")
print(result_count)
print("\nPandas GroupBy Size (Including null values):")
print(result_size)
print("\nPandas GroupBy Count (After filling missing values):")
print(result_filled)
Output:
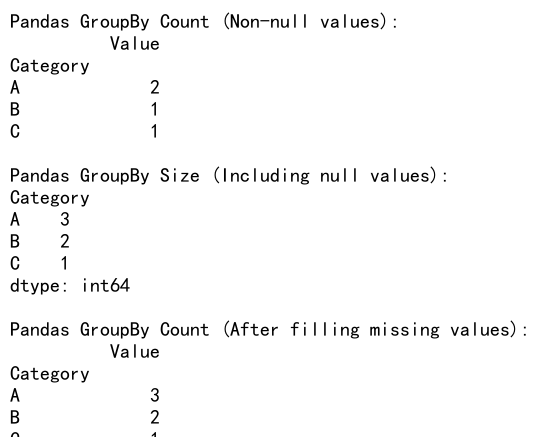
In this example, we demonstrate three approaches to handling missing data: counting only non-null values, counting all values including null, and filling missing values before counting. Each method provides different insights into your data, allowing you to choose the most appropriate approach for your analysis.
Combining GroupBy Count with Other Pandas Functions
Pandas groupby count can be combined with other pandas functions to perform more complex data manipulations and analyses.
Here’s an example of combining groupby count with other pandas functions:
import pandas as pd

# Create a sample DataFrame
df = pd.DataFrame({
    'Category': ['A', 'B', 'A', 'C', 'B', 'A'],
    'SubCategory': ['X', 'Y', 'X', 'Z', 'Y', 'Z'],
    'Value': [1, 2, 3, 4, 5, 6]
})

# Perform groupby count and pivot the result
result = df.groupby(['Category', 'SubCategory']).size().unstack(fill_value=0)

# Calculate percentage distribution
result_percentage = result.div(result.sum(axis=1), axis=0) * 100

print("Pandas GroupBy Count with Pivot:")
print(result)
print("\nPercentage Distribution:")
print(result_percentage)
Output:
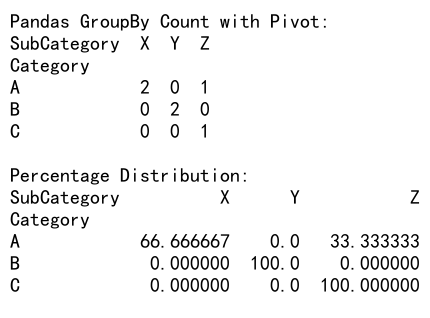
In this example, we combine groupby count with the unstack() function to create a pivot table of counts. We then use the div() function to calculate the percentage distribution of subcategories within each category.
Best Practices for Using Pandas GroupBy Count
To make the most of pandas groupby count in your data analysis projects, consider the following best practices:
- Understand your data: Before applying groupby count, thoroughly explore your dataset to identify appropriate grouping columns and potential issues like missing values or duplicates.
-
Choose the right aggregation method: Depending on your analysis goals, select the appropriate method (e.g.,
count(),size(), or custom functions) to get the desired results. -
Handle missing data appropriately: Decide how to treat missing values based on your analysis requirements, whether to exclude them, include them, or fill them with specific values.
-
Optimize for performance: When working with large datasets, use techniques like categorical data types, chunking, or more efficient counting methods to improve performance.
-
Combine with other pandas functions: Leverage the full power of pandas by combining groupby count with other functions like pivot tables, window functions, or custom aggregations.
-
Visualize results: Use appropriate visualizations to present your groupby count results effectively, making it easier to identify patterns and trends in your data.
-
Document your analysis: Clearly document your groupby count operations, including any data preprocessing steps, to ensure reproducibility and ease of understanding for yourself and others.
Conclusion
Pandas groupby count is a powerful tool for data analysis and aggregation in Python. By mastering this functionality, you can efficiently summarize and analyze large datasets, uncover patterns, and gain valuable insights from your data. From basic counting operations to advanced techniques like handling hierarchical data and applying custom functions, pandas groupby count offers a wide range of capabilities to support your data analysis needs.
 Pandas Dataframe