Mastering Pandas GroupBy: Creating New Columns with Advanced Techniques
Pandas groupby create new column is a powerful technique that allows data scientists and analysts to transform and enrich their datasets efficiently. This article will dive deep into the various methods and applications of using pandas groupby to create new columns, providing comprehensive examples and explanations along the way.
Understanding Pandas GroupBy and Column Creation
Pandas groupby create new column operations are essential for data manipulation and analysis. The groupby function in pandas allows you to split your data into groups based on specific criteria, while creating new columns enables you to add derived or aggregated information to your dataset. Combining these two concepts opens up a world of possibilities for data transformation and insights generation.
Let’s start with a basic example of how to use pandas groupby create new column:
import pandas as pd

# Create a sample DataFrame
df = pd.DataFrame({
    'Name': ['John', 'Emma', 'Alex', 'John', 'Emma'],
    'City': ['New York', 'London', 'Paris', 'New York', 'London'],
    'Sales': [100, 200, 150, 300, 250]
})

# Group by 'Name' and create a new column with the average sales
df['Avg_Sales'] = df.groupby('Name')['Sales'].transform('mean')

print(df)
Output:
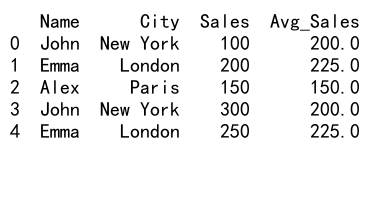
In this example, we use pandas groupby create new column to calculate the average sales for each person across different cities. The transform function applies the mean calculation to each group and returns a Series with the same index as the original DataFrame.
Advanced Techniques for Pandas GroupBy Create New Column
1. Using Aggregate Functions
Pandas groupby create new column operations often involve aggregate functions to summarize data within groups. Let’s explore how to use various aggregate functions to create new columns:
import pandas as pd

# Create a sample DataFrame
df = pd.DataFrame({
    'Product': ['A', 'B', 'A', 'B', 'A', 'B'],
    'Category': ['X', 'X', 'Y', 'Y', 'Z', 'Z'],
    'Sales': [100, 200, 150, 300, 250, 400]
})

# Group by 'Product' and create new columns with different aggregations
df['Total_Sales'] = df.groupby('Product')['Sales'].transform('sum')
df['Max_Sales'] = df.groupby('Product')['Sales'].transform('max')
df['Min_Sales'] = df.groupby('Product')['Sales'].transform('min')
df['Sales_Count'] = df.groupby('Product')['Sales'].transform('count')

print(df)
Output:

This example demonstrates how to use pandas groupby create new column with different aggregate functions like sum, max, min, and count. These new columns provide valuable insights into the sales performance of each product across categories.
2. Custom Aggregation Functions
Sometimes, built-in aggregate functions may not be sufficient for your pandas groupby create new column needs. In such cases, you can define custom aggregation functions:
import pandas as pd
import numpy as np

# Create a sample DataFrame
df = pd.DataFrame({
    'Customer': ['A', 'B', 'A', 'B', 'A', 'B'],
    'Order_Date': pd.to_datetime(['2023-01-01', '2023-01-02', '2023-02-01', '2023-02-02', '2023-03-01', '2023-03-02']),
    'Amount': [100, 200, 150, 300, 250, 400]
})

# Custom function to calculate the number of months between first and last order
def order_duration(dates):
    return (dates.max() - dates.min()).days / 30.44  # Average days in a month

# Group by 'Customer' and create a new column with the order duration
df['Order_Duration_Months'] = df.groupby('Customer')['Order_Date'].transform(order_duration)

print(df)
Output:
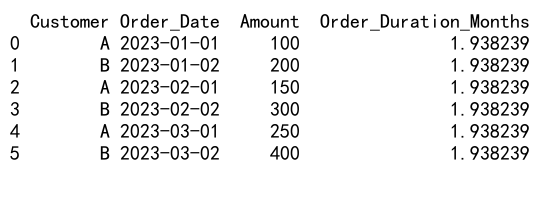
In this example, we use pandas groupby create new column with a custom function to calculate the duration between a customer’s first and last order in months. This showcases the flexibility of pandas in handling complex calculations within groups.
3. Multiple Group Keys
Pandas groupby create new column operations can involve multiple group keys for more granular analysis:
import pandas as pd

# Create a sample DataFrame
df = pd.DataFrame({
    'Store': ['A', 'A', 'B', 'B', 'A', 'B'],
    'Product': ['X', 'Y', 'X', 'Y', 'X', 'Y'],
    'Sales': [100, 200, 150, 300, 250, 400]
})

# Group by 'Store' and 'Product', then create a new column with the average sales
df['Avg_Sales'] = df.groupby(['Store', 'Product'])['Sales'].transform('mean')

print(df)
Output:
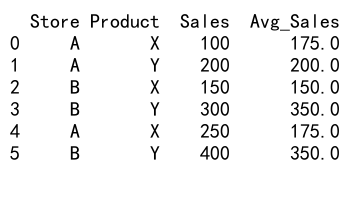
This example demonstrates how to use pandas groupby create new column with multiple group keys. By grouping on both ‘Store’ and ‘Product’, we can calculate the average sales for each unique combination of store and product.
4. Ranking Within Groups
Pandas groupby create new column can be used to rank values within groups:
import pandas as pd

# Create a sample DataFrame
df = pd.DataFrame({
    'Team': ['A', 'A', 'B', 'B', 'A', 'B'],
    'Player': ['John', 'Emma', 'Alex', 'Sarah', 'Mike', 'Tom'],
    'Score': [80, 90, 75, 85, 95, 70]
})

# Group by 'Team' and create a new column with the rank of scores within each team
df['Score_Rank'] = df.groupby('Team')['Score'].rank(ascending=False, method='dense')

print(df)
Output:
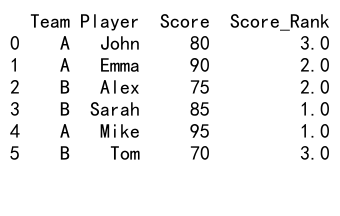
In this example, we use pandas groupby create new column to rank players’ scores within their respective teams. The rank function is applied to each group, creating a new column with the rankings.
5. Cumulative Calculations
Pandas groupby create new column operations can involve cumulative calculations within groups:
import pandas as pd

# Create a sample DataFrame
df = pd.DataFrame({
    'Date': pd.date_range(start='2023-01-01', periods=6),
    'Product': ['A', 'B', 'A', 'B', 'A', 'B'],
    'Sales': [100, 200, 150, 300, 250, 400]
})

# Group by 'Product' and create a new column with cumulative sales
df['Cumulative_Sales'] = df.groupby('Product')['Sales'].cumsum()

print(df)
Output:
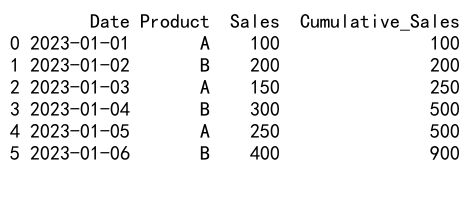
This example shows how to use pandas groupby create new column for cumulative calculations. The cumsum function is applied to each group, creating a new column with the running total of sales for each product.
6. Percentage of Group Total
Pandas groupby create new column can be used to calculate percentages within groups:
import pandas as pd

# Create a sample DataFrame
df = pd.DataFrame({
    'Department': ['HR', 'IT', 'HR', 'IT', 'HR', 'IT'],
    'Employee': ['John', 'Emma', 'Alex', 'Sarah', 'Mike', 'Tom'],
    'Salary': [50000, 80000, 55000, 85000, 52000, 82000]
})

# Group by 'Department' and create a new column with the percentage of total department salary
df['Salary_Pct'] = df.groupby('Department')['Salary'].transform(lambda x: x / x.sum() * 100)

print(df)
Output:
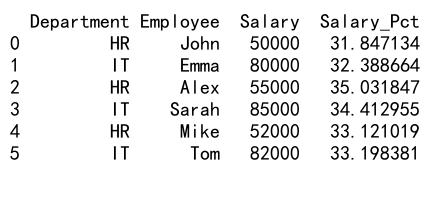
In this example, we use pandas groupby create new column to calculate each employee’s salary as a percentage of their department’s total salary. The lambda function applies the percentage calculation to each group.
7. Rolling Window Calculations
Pandas groupby create new column operations can incorporate rolling window calculations within groups:
import pandas as pd

# Create a sample DataFrame
df = pd.DataFrame({
    'Date': pd.date_range(start='2023-01-01', periods=10),
    'Stock': ['AAPL', 'GOOGL', 'AAPL', 'GOOGL', 'AAPL', 'GOOGL', 'AAPL', 'GOOGL', 'AAPL', 'GOOGL'],
    'Price': [150, 2800, 152, 2850, 155, 2900, 153, 2950, 158, 3000]
})

# Group by 'Stock' and create a new column with the 3-day moving average
df['MA_3'] = df.groupby('Stock')['Price'].transform(lambda x: x.rolling(window=3, min_periods=1).mean())

print(df)
Output:
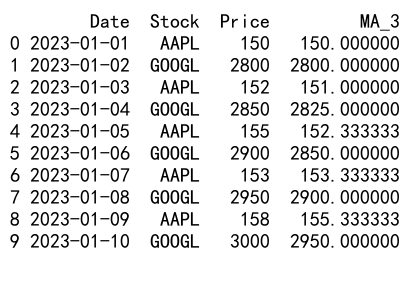
This example demonstrates how to use pandas groupby create new column with rolling window calculations. We calculate a 3-day moving average of stock prices within each stock group.
8. Applying Multiple Aggregations
Pandas groupby create new column can involve applying multiple aggregations simultaneously:
import pandas as pd

# Create a sample DataFrame
df = pd.DataFrame({
    'Category': ['A', 'B', 'A', 'B', 'A', 'B'],
    'Product': ['X', 'Y', 'Z', 'X', 'Y', 'Z'],
    'Sales': [100, 200, 150, 300, 250, 400],
    'Quantity': [10, 15, 12, 20, 18, 25]
})

# Group by 'Category' and create new columns with multiple aggregations
agg_funcs = {
    'Sales': ['sum', 'mean'],
    'Quantity': ['max', 'min']
}
result = df.groupby('Category').agg(agg_funcs)
result.columns = ['_'.join(col).strip() for col in result.columns.values]
df = df.merge(result, left_on='Category', right_index=True)

print(df)
Output:
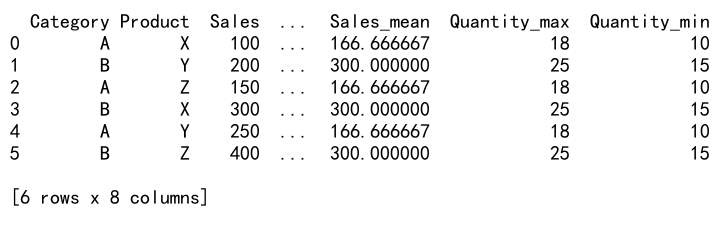
In this example, we use pandas groupby create new column to apply multiple aggregations to different columns within each category. The resulting columns are then merged back into the original DataFrame.
9. Grouping by Time Periods
Pandas groupby create new column operations can be particularly useful when working with time series data:
import pandas as pd

# Create a sample DataFrame
df = pd.DataFrame({
    'Date': pd.date_range(start='2023-01-01', periods=10),
    'Sales': [100, 150, 200, 180, 220, 250, 300, 280, 320, 350]
})

# Group by month and create a new column with monthly average sales
df['Month'] = df['Date'].dt.to_period('M')
df['Monthly_Avg_Sales'] = df.groupby('Month')['Sales'].transform('mean')

print(df)
Output:
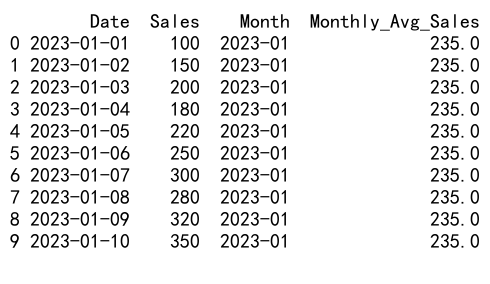
This example shows how to use pandas groupby create new column with time-based grouping. We group the data by month and calculate the average sales for each month.
10. Conditional Grouping
Pandas groupby create new column can involve conditional logic within groups:
import pandas as pd

# Create a sample DataFrame
df = pd.DataFrame({
    'Product': ['A', 'B', 'A', 'B', 'A', 'B'],
    'Sales': [100, 200, 150, 300, 250, 400],
    'Promotion': [True, False, True, True, False, False]
})

# Group by 'Product' and create a new column with the average sales during promotions
df['Promo_Avg_Sales'] = df.groupby('Product').apply(lambda x: x.loc[x['Promotion'], 'Sales'].mean())

print(df)
In this example, we use pandas groupby create new column with conditional logic to calculate the average sales during promotions for each product. The apply function allows us to use complex logic within each group.
Best Practices for Pandas GroupBy Create New Column
When using pandas groupby create new column operations, keep the following best practices in mind:
- Choose appropriate group keys: Select group keys that are relevant to your analysis and provide meaningful insights.
-
Use efficient aggregation functions: Built-in aggregation functions are generally faster than custom functions. Use them when possible.
-
Handle missing values: Consider how you want to handle missing values within groups. You may need to fill or drop them before grouping.
-
Be mindful of memory usage: Groupby operations can be memory-intensive, especially with large datasets. Monitor your memory usage and consider chunking data if necessary.
-
Use meaningful column names: When creating new columns, use descriptive names that clearly indicate the content and purpose of the column.
-
Leverage vectorized operations: Whenever possible, use vectorized operations instead of apply functions for better performance.
-
Combine multiple operations: If you need to perform multiple groupby operations, try to combine them into a single operation to improve efficiency.
Advanced Applications of Pandas GroupBy Create New Column
1. Time-based Analysis
Pandas groupby create new column is particularly useful for time-based analysis:
import pandas as pd

# Create a sample DataFrame
df = pd.DataFrame({
    'Date': pd.date_range(start='2023-01-01', periods=100),
    'Sales': np.random.randint(100, 1000, 100)
})

# Group by week and create new columns with weekly statistics
df['Week'] = df['Date'].dt.to_period('W')
df['Weekly_Avg'] = df.groupby('Week')['Sales'].transform('mean')
df['Weekly_Max'] = df.groupby('Week')['Sales'].transform('max')
df['Weekly_Min'] = df.groupby('Week')['Sales'].transform('min')

print(df)
This example demonstrates how to use pandas groupby create new column for weekly sales analysis, creating new columns for average, maximum, and minimum weekly sales.
2. Hierarchical Grouping
Pandas groupby create new column can handle hierarchical grouping:
import pandas as pd

# Create a sample DataFrame
df = pd.DataFrame({
    'Region': ['East', 'West', 'East', 'West', 'East', 'West'],
    'State': ['NY', 'CA', 'MA', 'OR', 'NY', 'CA'],
    'City': ['NYC', 'LA', 'Boston', 'Portland', 'Buffalo', 'SF'],
    'Sales': [1000, 1500, 800, 1200, 900, 1300]
})

# Group by Region and State, then create new columns with hierarchical statistics
df['Region_Avg'] = df.groupby('Region')['Sales'].transform('mean')
df['State_Avg'] = df.groupby(['Region', 'State'])['Sales'].transform('mean')
df['City_Pct_of_State'] = df.groupby(['Region', 'State'])['Sales'].transform(lambda x: x / x.sum() * 100)

print(df)
Output:

This example shows how to use pandas groupby create new column with hierarchical grouping, calculating statistics at different levels of granularity.
3. Pivot-like Operations
Pandas groupby create new column can be used to perform pivot-like operations:
import pandas as pd

# Create a sample DataFrame
df = pd.DataFrame({
    'Date': pd.date_range(start='2023-01-01', periods=12),
    'Product': ['A', 'B', 'C'] * 4,
    'Sales': np.random.randint(100, 1000, 12)
})

# Group by Date and Product, then create new columns for each product's sales
pivot_df = df.pivot(index='Date', columns='Product', values='Sales').reset_index()
pivot_df.columns.name = None
df = df.merge(pivot_df, on='Date')

print(df)
This example demonstrates how to use pandas groupby create new column to achieve a pivot-like result, creating separate columns for each product’s sales.
4. Percentile Calculations
Pandas groupby create new column can be used for percentile calculations within groups:
import pandas as pd
import numpy as np

# Create a sample DataFrame
df = pd.DataFrame({
    'Department': ['HR', 'IT', 'HR', 'IT', 'HR', 'IT'] * 5,
    'Employee': [f'Emp_{i}' for i in range(30)],
    'Salary': np.random.randint(30000, 100000, 30)
})

# Group by Department and create new columns with salary percentiles
for percentile in [25, 50, 75]:
    df[f'Salary_{percentile}th_Percentile'] = df.groupby('Department')['Salary'].transform(
        lambda x: np.percentile(x, percentile)
    )

print(df)
Output:
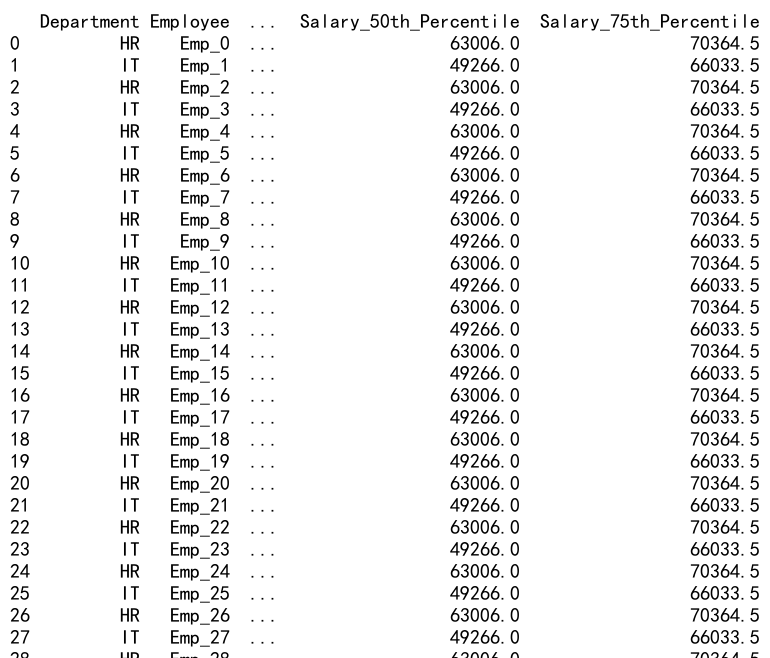
This example shows how to use pandas groupby create new column to calculate various percentiles of salaries within each department. This can be useful for understanding salary distributions and identifying outliers.
5. Moving Correlation
Pandas groupby create new column can be used to calculate moving correlations between variables:
import pandas as pd
import numpy as np

# Create a sample DataFrame
df = pd.DataFrame({
    'Date': pd.date_range(start='2023-01-01', periods=100),
    'Stock_A': np.random.randn(100).cumsum(),
    'Stock_B': np.random.randn(100).cumsum()
})

# Calculate 30-day moving correlation between Stock_A and Stock_B
df['Moving_Correlation'] = df.groupby(df.index // 30).apply(
    lambda x: x['Stock_A'].rolling(window=30, min_periods=1).corr(x['Stock_B'])
).reset_index(level=0, drop=True)

print(df)
Output:
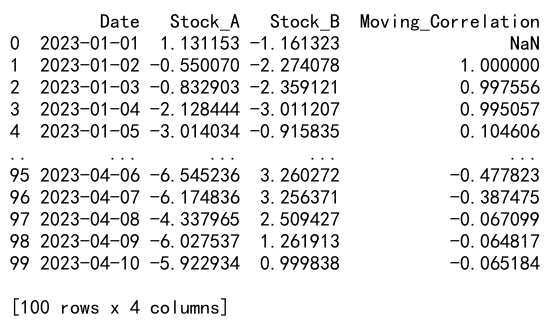
This example demonstrates how to use pandas groupby create new column to calculate a moving correlation between two stocks over a 30-day window. This technique can be useful in financial analysis to identify changing relationships between variables over time.
Common Challenges and Solutions in Pandas GroupBy Create New Column
1. Handling Large Datasets
When working with large datasets, pandas groupby create new column operations can be memory-intensive. Here’s a solution using chunking:
import pandas as pd
import numpy as np

# Create a large sample DataFrame
df = pd.DataFrame({
    'ID': np.repeat(range(1000), 1000),
    'Value': np.random.randn(1000000)
})

# Function to process chunks
def process_chunk(chunk):
    chunk['Group_Mean'] = chunk.groupby('ID')['Value'].transform('mean')
    return chunk

# Process the DataFrame in chunks
chunk_size = 100000
result = pd.concat(df.groupby(df.index // chunk_size).apply(process_chunk))

print(result.head())
This example shows how to use pandas groupby create new column with large datasets by processing the data in chunks. This approach helps manage memory usage for very large datasets.
2. Dealing with Missing Values
Missing values can cause issues in pandas groupby create new column operations. Here’s how to handle them:
import pandas as pd
import numpy as np

# Create a sample DataFrame with missing values
df = pd.DataFrame({
    'Group': ['A', 'A', 'B', 'B', 'A', 'B'],
    'Value': [1, np.nan, 3, 4, 5, np.nan]
})

# Group by 'Group' and create a new column with mean, handling missing values
df['Group_Mean'] = df.groupby('Group')['Value'].transform(lambda x: x.fillna(x.mean()))

print(df)
Output:
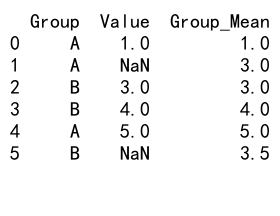
This example demonstrates how to use pandas groupby create new column while handling missing values. The fillna method is used within the transformation to replace missing values with the group mean.
3. Handling Categorical Data
When using pandas groupby create new column with categorical data, you may need to handle the ordering of categories:
import pandas as pd

# Create a sample DataFrame with categorical data
df = pd.DataFrame({
    'Category': pd.Categorical(['Low', 'Medium', 'High', 'Low', 'High', 'Medium'],
                               categories=['Low', 'Medium', 'High'],
                               ordered=True),
    'Value': [10, 20, 30, 15, 35, 25]
})

# Group by 'Category' and create a new column with the mean value for each category
df['Category_Mean'] = df.groupby('Category')['Value'].transform('mean')

print(df)
This example shows how to use pandas groupby create new column with ordered categorical data. The ordering of categories is preserved in the groupby operation.
Advanced Optimization Techniques for Pandas GroupBy Create New Column
1. Using Numba for Custom Aggregations
For complex custom aggregations, using Numba can significantly speed up pandas groupby create new column operations:
import pandas as pd
import numpy as np
from numba import jit

# Create a sample DataFrame
df = pd.DataFrame({
    'Group': np.random.choice(['A', 'B', 'C'], 1000000),
    'Value': np.random.randn(1000000)
})

@jit(nopython=True)
def custom_agg(values):
    return np.mean(values) * np.median(values)

# Group by 'Group' and create a new column with the custom aggregation
df['Custom_Agg'] = df.groupby('Group')['Value'].transform(custom_agg)

print(df.head())
This example demonstrates how to use Numba to optimize a custom aggregation function in pandas groupby create new column operations. Numba compiles the Python function to machine code, which can result in significant performance improvements for large datasets.
2. Using Cython for Complex Calculations
For even more complex calculations, Cython can be used to optimize pandas groupby create new column operations:
%%cython
import pandas as pd
import numpy as np
cimport numpy as np

def cython_custom_agg(np.ndarray[double] values):
    cdef int i
    cdef double sum_values = 0
    cdef int n = len(values)

    for i in range(n):
        sum_values += values[i]

    return sum_values / n * np.median(values)

# Create a sample DataFrame
df = pd.DataFrame({
    'Group': np.random.choice(['A', 'B', 'C'], 1000000),
    'Value': np.random.randn(1000000)
})

# Group by 'Group' and create a new column with the Cython custom aggregation
df['Cython_Custom_Agg'] = df.groupby('Group')['Value'].transform(cython_custom_agg)

print(df.head())
This example shows how to use Cython to create a highly optimized custom aggregation function for pandas groupby create new column operations. Cython allows you to write C-extensions for Python, which can provide significant performance improvements for computationally intensive tasks.
Conclusion
Pandas groupby create new column is a powerful technique that allows for complex data transformations and analysis. Throughout this article, we’ve explored various methods and applications of this technique, from basic aggregations to advanced time-series analysis and optimization strategies.
Key takeaways include:
-
Pandas groupby create new column operations can be used for a wide range of data manipulation tasks, including aggregations, rankings, cumulative calculations, and more.
-
Custom functions can be applied to groups using the
transformmethod, allowing for complex calculations within each group. -
Multiple group keys can be used for more granular analysis, and hierarchical grouping is possible for nested data structures.
-
Time-based grouping is particularly useful for analyzing trends and patterns in time-series data.
-
Optimization techniques like chunking, Numba, and Cython can be employed for handling large datasets and complex calculations efficiently.
 Pandas Dataframe