Mastering Pandas GroupBy Filter: A Comprehensive Guide to Efficient Data Analysis
Pandas groupby filter is a powerful technique for data manipulation and analysis in Python. This article will explore the various aspects of using pandas groupby filter to efficiently process and analyze data. We’ll cover everything from basic concepts to advanced applications, providing numerous examples along the way.
Understanding Pandas GroupBy Filter
Pandas groupby filter is a combination of two essential operations in data analysis: grouping and filtering. The groupby operation allows you to split your data into groups based on one or more columns, while the filter operation enables you to select specific groups based on certain conditions. When combined, these operations provide a powerful tool for data manipulation and analysis.
Let’s start with a simple example to illustrate the basic concept of pandas groupby filter:
import pandas as pd

# Create a sample DataFrame
df = pd.DataFrame({
    'name': ['Alice', 'Bob', 'Charlie', 'David', 'Eve'],
    'age': [25, 30, 35, 28, 32],
    'city': ['New York', 'London', 'Paris', 'New York', 'London'],
    'salary': [50000, 60000, 70000, 55000, 65000]
})

# Group by city and filter groups with more than one person
filtered_df = df.groupby('city').filter(lambda x: len(x) > 1)

print(filtered_df)
Output:
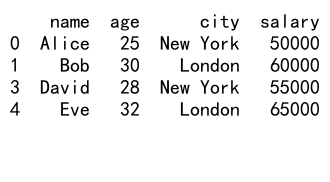
In this example, we use pandas groupby filter to select only the cities with more than one person. The groupby('city') operation groups the data by city, and the filter(lambda x: len(x) > 1) condition selects groups with more than one row.
Benefits of Using Pandas GroupBy Filter
Pandas groupby filter offers several advantages for data analysis:
- Efficient data processing: By combining grouping and filtering operations, you can perform complex data manipulations with minimal code.
- Flexibility: You can apply custom filtering conditions based on group-level statistics or properties.
- Improved readability: The groupby filter syntax is often more intuitive and easier to understand than equivalent operations using other methods.
- Performance: Pandas optimizes groupby operations for large datasets, making it efficient for handling big data.
Let’s look at another example to demonstrate these benefits:
import pandas as pd

# Create a sample DataFrame
df = pd.DataFrame({
    'product': ['A', 'B', 'C', 'A', 'B', 'C', 'A', 'B', 'C'],
    'sales': [100, 200, 150, 120, 180, 160, 90, 210, 140],
    'region': ['East', 'West', 'North', 'East', 'West', 'South', 'West', 'North', 'East']
})

# Group by product and filter groups with average sales greater than 150
high_performing_products = df.groupby('product').filter(lambda x: x['sales'].mean() > 150)

print(high_performing_products)
Output:
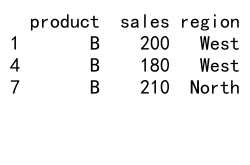
In this example, we use pandas groupby filter to identify high-performing products based on their average sales. This operation would be more complex and less readable if implemented without the groupby filter functionality.
Key Components of Pandas GroupBy Filter
To effectively use pandas groupby filter, it’s important to understand its key components:
- GroupBy object: Created by calling
groupby()on a DataFrame, it represents grouped data. - Filter function: A lambda function or user-defined function that specifies the filtering condition.
- Aggregation: Often used in combination with filtering to compute group-level statistics.
Let’s examine each component in more detail:
GroupBy Object
The GroupBy object is the foundation of pandas groupby filter operations. It’s created by calling the groupby() method on a DataFrame, specifying one or more columns to group by.
import pandas as pd

# Create a sample DataFrame
df = pd.DataFrame({
    'category': ['A', 'B', 'A', 'B', 'A', 'B'],
    'value': [10, 20, 15, 25, 12, 18]
})

# Create a GroupBy object
grouped = df.groupby('category')

# Apply a filter to select groups with a sum of values greater than 30
filtered = grouped.filter(lambda x: x['value'].sum() > 30)

print(filtered)
Output:
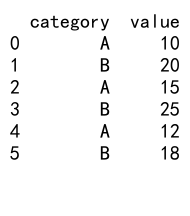
In this example, we create a GroupBy object by grouping the DataFrame by the ‘category’ column. We then apply a filter to select only the groups where the sum of ‘value’ is greater than 30.
Filter Function
The filter function is a crucial component of pandas groupby filter operations. It defines the condition that each group must satisfy to be included in the result. The filter function can be a lambda function or a user-defined function.
import pandas as pd

# Create a sample DataFrame
df = pd.DataFrame({
    'name': ['Alice', 'Bob', 'Charlie', 'David', 'Eve'],
    'score': [85, 92, 78, 95, 88],
    'subject': ['Math', 'Science', 'Math', 'Science', 'Math']
})

# Define a custom filter function
def high_average(group):
    return group['score'].mean() > 85

# Apply the filter function to select subjects with high average scores
high_performing_subjects = df.groupby('subject').filter(high_average)

print(high_performing_subjects)
Output:
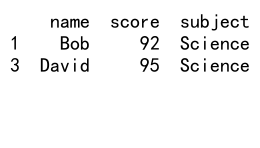
In this example, we define a custom filter function high_average that checks if the mean score of a group is greater than 85. We then use this function to filter the subjects with high average scores.
Aggregation
Aggregation is often used in combination with pandas groupby filter to compute group-level statistics. Common aggregation functions include sum(), mean(), count(), and max().
import pandas as pd

# Create a sample DataFrame
df = pd.DataFrame({
    'department': ['Sales', 'HR', 'Sales', 'IT', 'HR', 'IT'],
    'employee': ['John', 'Alice', 'Bob', 'Charlie', 'David', 'Eve'],
    'salary': [50000, 60000, 55000, 70000, 58000, 72000]
})

# Group by department, calculate average salary, and filter departments with avg salary > 60000
high_paying_departments = df.groupby('department').filter(lambda x: x['salary'].mean() > 60000)

print(high_paying_departments)
Output:
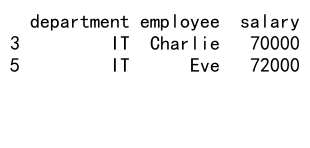
In this example, we use aggregation (calculating the mean salary) within the filter function to select departments with an average salary greater than 60000.
Advanced Techniques with Pandas GroupBy Filter
Now that we’ve covered the basics, let’s explore some advanced techniques using pandas groupby filter:
Multi-column Grouping
You can group by multiple columns to create more specific groups:
import pandas as pd

# Create a sample DataFrame
df = pd.DataFrame({
    'category': ['A', 'A', 'B', 'B', 'A', 'B'],
    'subcategory': ['X', 'Y', 'X', 'Y', 'X', 'Y'],
    'value': [10, 15, 20, 25, 12, 18]
})

# Group by multiple columns and filter groups with a sum of values greater than 20
filtered = df.groupby(['category', 'subcategory']).filter(lambda x: x['value'].sum() > 20)

print(filtered)
Output:
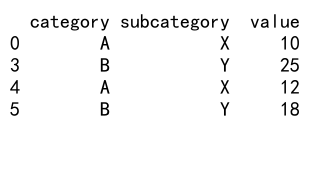
This example demonstrates grouping by both ‘category’ and ‘subcategory’ columns before applying the filter.
Combining Multiple Conditions
You can use multiple conditions in your filter function:
import pandas as pd

# Create a sample DataFrame
df = pd.DataFrame({
    'product': ['A', 'B', 'C', 'A', 'B', 'C'],
    'sales': [100, 200, 150, 120, 180, 160],
    'returns': [5, 10, 8, 6, 9, 7]
})

# Filter groups with average sales > 150 and total returns < 20
filtered = df.groupby('product').filter(lambda x: (x['sales'].mean() > 150) & (x['returns'].sum() < 20))

print(filtered)
Output:
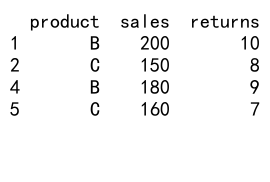
This example filters products based on both average sales and total returns.
Using Named Aggregation
Named aggregation can make your code more readable when dealing with complex aggregations:
import pandas as pd

# Create a sample DataFrame
df = pd.DataFrame({
    'store': ['S1', 'S1', 'S2', 'S2', 'S3', 'S3'],
    'product': ['A', 'B', 'A', 'B', 'A', 'B'],
    'sales': [100, 150, 200, 250, 300, 350],
    'returns': [5, 8, 10, 12, 15, 18]
})

# Use named aggregation and filter
filtered = df.groupby('store').filter(
    lambda x: x.agg(
        avg_sales=('sales', 'mean'),
        total_returns=('returns', 'sum')
    )['avg_sales'] > 200 and x.agg(
        avg_sales=('sales', 'mean'),
        total_returns=('returns', 'sum')
    )['total_returns'] < 30
)

print(filtered)
This example uses named aggregation to calculate average sales and total returns, then applies a filter based on these aggregated values.
Common Use Cases for Pandas GroupBy Filter
Pandas groupby filter is versatile and can be applied to various data analysis scenarios. Here are some common use cases:
Identifying High-Performing Groups
import pandas as pd

# Create a sample DataFrame
df = pd.DataFrame({
    'team': ['A', 'B', 'C', 'A', 'B', 'C', 'A', 'B', 'C'],
    'score': [85, 92, 78, 90, 88, 82, 95, 86, 80]
})

# Identify teams with an average score above 85
high_performing_teams = df.groupby('team').filter(lambda x: x['score'].mean() > 85)

print(high_performing_teams)
Output:
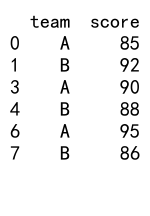
This example identifies high-performing teams based on their average scores.
Removing Outliers
import pandas as pd
import numpy as np

# Create a sample DataFrame
df = pd.DataFrame({
    'group': ['A', 'A', 'A', 'B', 'B', 'B', 'C', 'C', 'C'],
    'value': [10, 12, 100, 20, 22, 200, 30, 32, 300]
})

# Remove groups with outliers (defined as values more than 3 standard deviations from the mean)
filtered = df.groupby('group').filter(lambda x: np.abs(x['value'] - x['value'].mean()) <= 3 * x['value'].std())

print(filtered)
This example removes groups that contain outlier values.
Selecting Groups Based on Size
import pandas as pd

# Create a sample DataFrame
df = pd.DataFrame({
    'category': ['A', 'B', 'C', 'A', 'B', 'C', 'A', 'B', 'D'],
    'value': [1, 2, 3, 4, 5, 6, 7, 8, 9]
})

# Select groups with more than 2 members
filtered = df.groupby('category').filter(lambda x: len(x) > 2)

print(filtered)
Output:
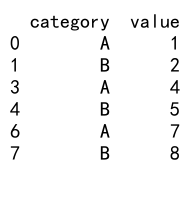
This example selects only the categories that have more than two entries.
Best Practices for Using Pandas GroupBy Filter
To make the most of pandas groupby filter, consider the following best practices:
- Use descriptive variable names: Choose clear and meaningful names for your DataFrames, groups, and filtered results.
-
Optimize for performance: For large datasets, consider using more efficient methods like
transform()instead ofapply()when possible. -
Handle missing data: Be aware of how missing data affects your groupby and filter operations, and handle it appropriately.
-
Use appropriate data types: Ensure your columns have the correct data types to avoid unexpected behavior during grouping and filtering.
-
Combine with other pandas functions: Leverage other pandas functions like
sort_values(),reset_index(), ordrop_duplicates()to further refine your results.
Let’s see an example that incorporates some of these best practices:
import pandas as pd

# Create a sample DataFrame
sales_data = pd.DataFrame({
    'date': pd.date_range(start='2023-01-01', periods=100),
    'product': ['A', 'B', 'C'] * 33 + ['A'],
    'sales': [100, 150, 200] * 33 + [100],
    'returns': [5, 8, 10] * 33 + [5]
})

# Convert date to datetime type
sales_data['date'] = pd.to_datetime(sales_data['date'])

# Group by product and month, filter based on average daily sales
high_performing_products = (
    sales_data.groupby([sales_data['date'].dt.to_period('M'), 'product'])
    .filter(lambda x: x['sales'].mean() > 150)
    .sort_values('date')
    .reset_index(drop=True)
)

print(high_performing_products)
Output:
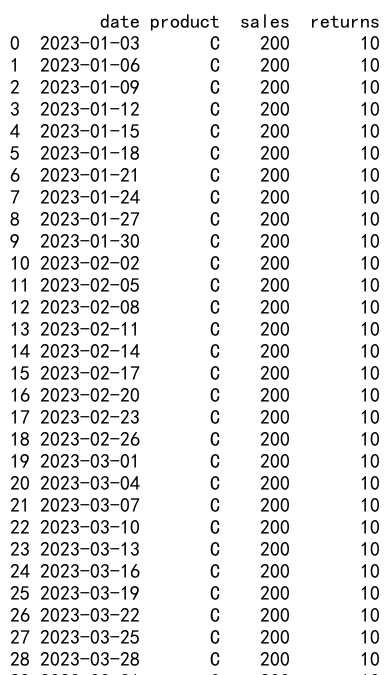
This example demonstrates good practices such as using descriptive variable names, handling date data types correctly, and combining groupby filter with sorting and index resetting.
Common Pitfalls and How to Avoid Them
When working with pandas groupby filter, be aware of these common pitfalls:
- Forgetting to reset the index: After filtering, the index may not be continuous. Use
reset_index()to avoid issues. -
Applying filter to the wrong level: When dealing with multi-level grouping, ensure you’re applying the filter to the correct level.
-
Not handling empty groups: Consider how your filter function behaves with empty groups and handle them appropriately.
-
Ignoring data types: Inconsistent data types can lead to unexpected results. Always check and convert data types as needed.
-
Overlooking performance for large datasets: For very large datasets, consider using more efficient methods or sampling techniques.
Let’s look at an example that addresses some of these pitfalls:
import pandas as pd

# Create a sample DataFrame
df = pd.DataFrame({
    'category': ['A', 'B', 'C', 'A', 'B', 'C', 'A', 'B', 'D'],
    'subcategory': ['X', 'Y', 'Z', 'X', 'Y', 'Z', 'Y', 'Z', 'X'],
    'value': [1, 2, 3, 4, 5, 6, 7, 8, 9]
})

# Multi-level grouping and filtering
filtered = (
    df.groupby(['category', 'subcategory'])
    .filter(lambda x: len(x) > 0 and x['value'].mean() > 3)
    .reset_index(drop=True)
)

print(filtered)
Output:
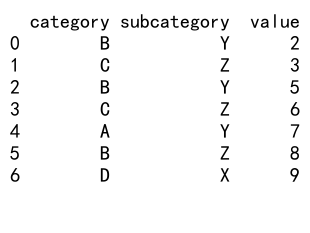
This example demonstrates handling multi-level grouping, avoiding empty groups, and resetting the index after filtering.
Advanced Applications of Pandas GroupBy Filter
Pandas groupby filter can be used in more complex scenarios for advanced data analysis. Here are some advanced applications:
Time Series Analysis
import pandas as pd

# Create a sample time series DataFrame
df = pd.DataFrame({
    'date': pd.date_range(start='2023-01-01', periods=100),
    'product': ['A', 'B', 'C'] * 33 + ['A'],
    'sales': [100, 150, 200] * 33 + [100]
})

# Convert date to datetime and set as index
df['date'] = pd.to_datetime(df['date'])
df.set_index('date', inplace=True)

# Group by product and month, filter products with increasing monthly sales
increasing_sales_products = df.groupby('product').resample('M').sum().groupby('product').filter(
    lambda x: x['sales'].is_monotonic_increasing
)

print(increasing_sales_products)
This example demonstrates using pandas groupby filter for time series analysis, identifying products with consistently increasing monthly sales.
Complex Aggregations
import pandas as pd

# Create a sample DataFrame
df = pd.DataFrame({
    'store': ['S1', 'S1', 'S2', 'S2', 'S3', 'S3'],
    'product': ['A', 'B', 'A', 'B', 'A', 'B'],
    'sales': [100, 150, 200, 250, 300, 350],
    'returns': [5, 8, 10, 12, 15, 18]
})

# Complex aggregation and filtering
filtered = df.groupby('store').filter(
    lambda x: (x['sales'].sum() > 400) &
              (x['returns'].mean() < 15) &
              (x['sales'].max() / x['sales'].min() < 2)
)

print(filtered)
Output:
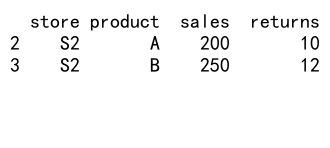
This example shows how to use multiple complex aggregations within a single filter condition.
Handling Missing Data
import pandas as pd
import numpy as np

# Create a sample DataFrame with missing data
df = pd.DataFrame({
    'group': ['A', 'A', 'B', 'B', 'C', 'C'],
    'value': [1, np.nan, 3, 4, np.nan, 6]
})

# Filter groups with at least one non-null value and calculate mean
filtered = df.groupby('group').filter(lambda x: x['value'].count() > 0)
result = filtered.groupby('group')['value'].mean()

print(result)
Output:
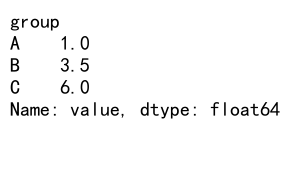
This example demonstrates how to handle missing data when using pandas groupby filter.
Optimizing Performance with Pandas GroupBy Filter
When working with large datasets, optimizing the performance of pandas groupby filter operations becomes crucial. Here are some techniques to improve performance:
Using transform() Instead of apply()
For certain operations, using transform() can be more efficient than apply():
import pandas as pd
import numpy as np

# Create a large sample DataFrame
df = pd.DataFrame({
    'group': np.random.choice(['A', 'B', 'C'], size=1000000),
    'value': np.random.rand(1000000)
})

# Efficient filtering using transform
filtered = df[df.groupby('group')['value'].transform('mean') > 0.5]

print(filtered.head())
Output:
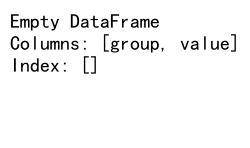
This example uses transform() to efficiently filter groups based on their mean value.
Chunking Large Datasets
For very large datasets that don’t fit in memory, you can process the data in chunks:
import pandas as pd

# Function to process a chunk of data
def process_chunk(chunk):
    return chunk.groupby('group').filter(lambda x: x['value'].mean() > 0.5)

# Read and process data in chunks
chunk_size = 100000
result = pd.DataFrame()

for chunk in pd.read_csv('large_dataset.csv', chunksize=chunk_size):
    processed_chunk = process_chunk(chunk)
    result = pd.concat([result, processed_chunk])

print(result.head())
This example demonstrates how to process a large dataset in chunks using pandas groupby filter.
Combining Pandas GroupBy Filter with Other Pandas Functions
Pandas groupby filter can be combined with other pandas functions to perform more complex data manipulations:
Combining with merge()
import pandas as pd

# Create sample DataFrames
df1 = pd.DataFrame({
    'group': ['A', 'B', 'C', 'A', 'B', 'C'],
    'value1': [1, 2, 3, 4, 5, 6]
})

df2 = pd.DataFrame({
    'group': ['A', 'B', 'C', 'D'],
    'value2': [10, 20, 30, 40]
})

# Filter df1 and merge with df2
filtered_df1 = df1.groupby('group').filter(lambda x: x['value1'].mean() > 2)
result = pd.merge(filtered_df1, df2, on='group', how='left')

print(result)
Output:
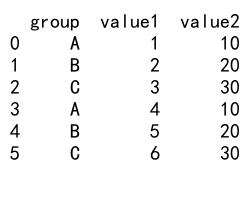
This example demonstrates combining pandas groupby filter with a merge operation.
Combining with pivot_table()
import pandas as pd

# Create a sample DataFrame
df = pd.DataFrame({
    'date': pd.date_range(start='2023-01-01', periods=100),
    'product': ['A', 'B', 'C'] * 33 + ['A'],
    'store': ['S1', 'S2'] * 50,
    'sales': [100, 150, 200] * 33 + [100]
})

# Filter and create a pivot table
filtered = df.groupby('product').filter(lambda x: x['sales'].mean() > 150)
pivot_result = pd.pivot_table(filtered, values='sales', index='date', columns=['product', 'store'], aggfunc='sum')

print(pivot_result.head())
Output:
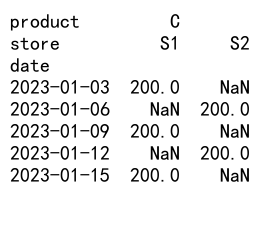
This example shows how to combine pandas groupby filter with pivot table creation.
Real-world Examples of Pandas GroupBy Filter
Let’s explore some real-world scenarios where pandas groupby filter can be particularly useful:
Customer Segmentation
import pandas as pd

# Create a sample customer DataFrame
customers = pd.DataFrame({
    'customer_id': range(1, 101),
    'segment': ['High', 'Medium', 'Low'] * 33 + ['High'],
    'total_spend': [1000, 500, 100] * 33 + [1000],
    'num_purchases': [10, 5, 2] * 33 + [10]
})

# Identify high-value customer segments
high_value_segments = customers.groupby('segment').filter(
    lambda x: (x['total_spend'].mean() > 750) & (x['num_purchases'].mean() > 7)
)

print(high_value_segments)
Output:
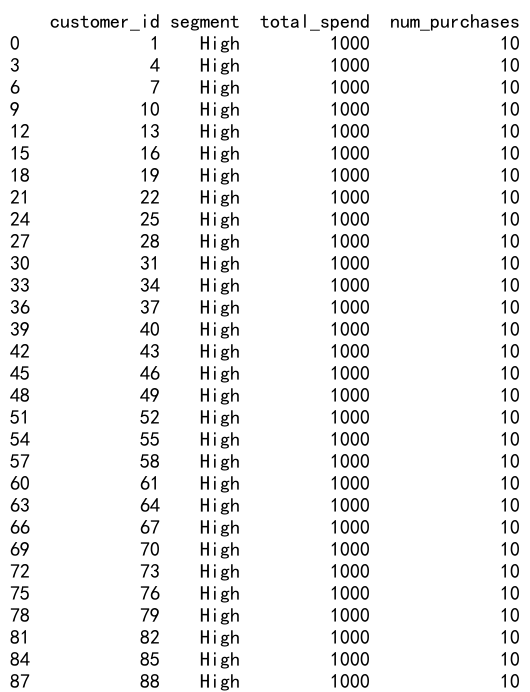
This example demonstrates using pandas groupby filter for customer segmentation based on spending and purchase frequency.
Stock Market Analysis
import pandas as pd
import numpy as np

# Create a sample stock market DataFrame
stocks = pd.DataFrame({
    'date': pd.date_range(start='2023-01-01', periods=100),
    'stock': ['AAPL', 'GOOGL', 'MSFT'] * 33 + ['AAPL'],
    'price': np.random.randint(100, 200, 100),
    'volume': np.random.randint(1000000, 5000000, 100)
})

# Identify stocks with consistently high trading volume
high_volume_stocks = stocks.groupby('stock').filter(
    lambda x: x['volume'].rolling(window=5).mean().min() > 2000000
)

print(high_volume_stocks)
Output:
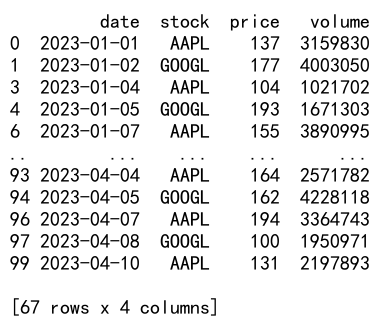
This example shows how to use pandas groupby filter for stock market analysis, identifying stocks with consistently high trading volumes.
Environmental Data Analysis
import pandas as pd
import numpy as np

# Create a sample environmental data DataFrame
env_data = pd.DataFrame({
    'date': pd.date_range(start='2023-01-01', periods=365),
    'city': ['New York', 'Los Angeles', 'Chicago'] * 121 + ['New York'] * 2,
    'temperature': np.random.randint(0, 40, 365),
    'air_quality_index': np.random.randint(0, 500, 365)
})

# Identify cities with poor air quality during summer months
summer_poor_air_quality = env_data[
    (env_data['date'].dt.month.isin([6, 7, 8]))  # Summer months
].groupby('city').filter(
    lambda x: x['air_quality_index'].mean() > 150
)

print(summer_poor_air_quality)
Output:
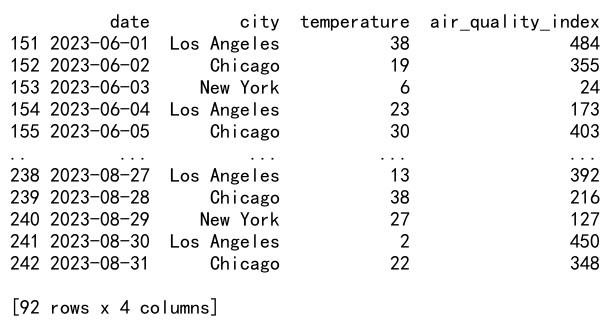
This example demonstrates using pandas groupby filter for environmental data analysis, identifying cities with poor air quality during summer months.
Conclusion
Pandas groupby filter is a powerful tool for data analysis and manipulation in Python. It combines the flexibility of grouping data with the ability to apply custom filtering conditions, making it invaluable for a wide range of data processing tasks. From basic operations to advanced applications, pandas groupby filter offers a versatile approach to handling complex data scenarios.
Throughout this article, we’ve explored various aspects of pandas groupby filter, including:
- Basic concepts and syntax
- Key components and their functions
- Advanced techniques and use cases
- Best practices and common pitfalls
- Performance optimization strategies
- Integration with other pandas functions
- Real-world examples and applications
 Pandas Dataframe